Cited by 292Sleep and Wakefulness ResearchMemory and Neural MechanismsNeuroscience and Neuropharmacology Research

The DOI matches its Crossref record; 68 of the 68 references it cites were found in a registry or an index.

Sleep deprivation causes memory deficits by negatively impacting neuronal connectivity in hippocampal area CA1

Open access

Abstract

Brief periods of sleep loss have long-lasting consequences such as impaired memory consolidation. Structural changes in synaptic connectivity have been proposed as a substrate of memory storage. Here, we examine the impact of brief periods of sleep deprivation on dendritic structure. In mice, we find that five hours of sleep deprivation decreases dendritic spine numbers selectively in hippocampal area CA1 and increased activity of the filamentous actin severing protein cofilin. Recovery sleep normalizes these structural alterations. Suppression of cofilin function prevents spine loss, deficits in hippocampal synaptic plasticity, and impairments in long-term memory caused by sleep deprivation. The elevated cofilin activity is caused by cAMP-degrading phosphodiesterase-4A5 (PDE4A5), which hampers cAMP-PKA-LIMK signaling. Attenuating PDE4A5 function prevents changes in cAMP-PKA-LIMK-cofilin signaling and cognitive deficits associated with sleep deprivation. Our work demonstrates the necessity of an intact cAMP-PDE4-PKA-LIMK-cofilin activation-signaling pathway for sleep deprivation-induced memory disruption and reduction in hippocampal spine density.

Overview

The claims and statistics of this paper haven’t been checked yet.

Run the check — free, no account needed. It reads the open-access text and checks the sources it cites.

A few free checks a day · papers already verified open instantly · results are public

Integrity signals

Registry

Crossref · 10.7554/elife.13424

Cites

68 of 68 references verified0 citation errors · 0 not checkable

Statistics

Figures

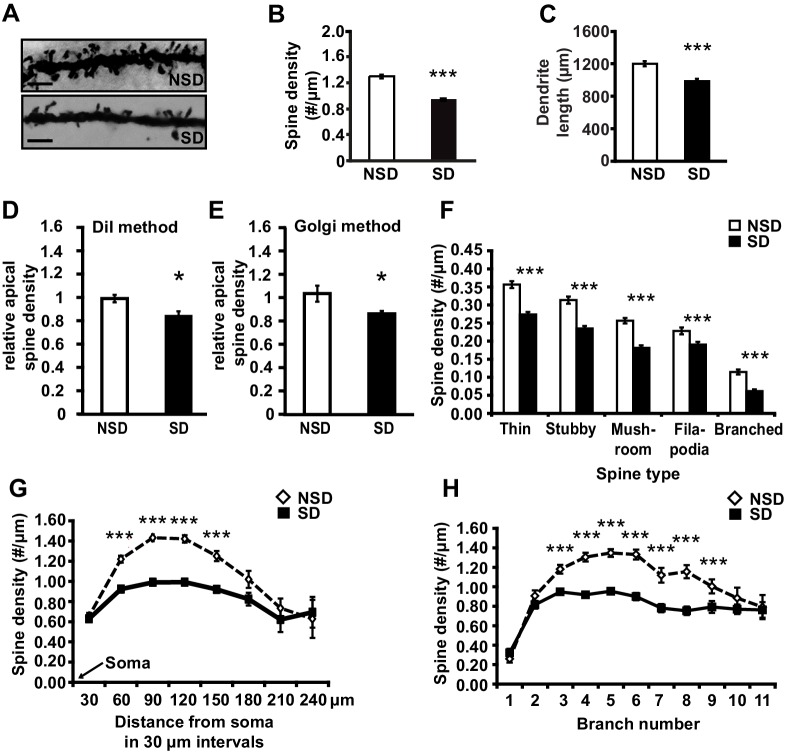
Figure 1. Sleep deprivation reduces spine numbers and dendrite length in CA1 neurons of the hippocampus. (A) Representative images of Golgi-impregnated dendritic spines of CA1 pyramidal neurons from sleep deprived (SD) and non-sleep deprived (NSD) mice. Scale bar, 5 µm. (B) Sleep deprivation reduces the spine density of apical/basal dendrites of CA1 neurons (n = 5–6, Student’s t-test, p=0.0002). (C) Sleep deprivation decreases apical/basal dendrite length of CA1 neurons (n = 5–6, Student’s t-test, p=0.0012). (D, E) Comparative analyses of spine numbers in the second-third branch of apical dendrites of CA1 neurons reveal a significant reduction as a result of sleep deprivation using either the DiI labeling method (n = 3–4, Student’s t-test, p=0.03) or Golgi analyses (n = 5, Student’s t-test, p=0.03). Importantly, for the comparison of the two methods we focused on the second and third branch of the apical dendrites. See also the Materials and methods section. (F) Sleep deprivation reduces the number of all spine types in apical/basal dendrites of CA1 neurons (n = 5–6, Student’s t-test, p<0.005). (G) Sleep deprivation reduces spine density of apical/basal dendrites between 60 and 150 µm away from the soma of CA1 neurons (n = 5–6, Student’s t-test, p<0.005). (H) Sleep deprivation reduces apical/basal spine density in branch 3–9 of CA1 neurons (n = 5–6, Student’s t-test, p<0.005). NSD: non-sleep deprived, SD: sleep deprived, Values represent the mean ± SEM. *p<0.05, ***p<0.005, by Student’s t test. See also Figure 1—figure supplement 1 and 2 for separate Golgi analyses of apical and basal spine numbers. DOI: http://dx.doi.org/10.7554/eLife.13424.003
Figure 1. Sleep deprivation reduces spine numbers and dendrite length in CA1 neurons of the hippocampus. (A) Representative images of Golgi-impregnated dendritic spines of CA1 pyramidal neurons from sleep deprived (SD) and non-sleep deprived (NSD) mice. Scale bar, 5 µm. (B) Sleep deprivation reduces the spine density of apical/basal dendrites of CA1 neurons (n = 5–6, Student’s t-test, p=0.0002). (C) Sleep deprivation decreases apical/basal dendrite length of CA1 neurons (n = 5–6, Student’s t-test, p=0.0012). (D, E) Comparative analyses of spine numbers in the second-third branch of apical dendrites of CA1 neurons reveal a significant reduction as a result of sleep deprivation using either the DiI labeling method (n = 3–4, Student’s t-test, p=0.03) or Golgi analyses (n = 5, Student’s t-test, p=0.03). Importantly, for the comparison of the two methods we focused on the second and third branch of the apical dendrites. See also the Materials and methods section. (F) Sleep deprivation reduces the number of all spine types in apical/basal dendrites of CA1 neurons (n = 5–6, Student’s t-test, p<0.005). (G) Sleep deprivation reduces spine density of apical/basal dendrites between 60 and 150 µm away from the soma of CA1 neurons (n = 5–6, Student’s t-test, p<0.005). (H) Sleep deprivation reduces apical/basal spine density in branch 3–9 of CA1 neurons (n = 5–6, Student’s t-test, p<0.005). NSD: non-sleep deprived, SD: sleep deprived, Values represent the mean ± SEM. *p<0.05, ***p<0.005, by Student’s t test. See also Figure 1—figure supplement 1 and 2 for separate Golgi analyses of apical and basal spine numbers. DOI: http://dx.doi.org/10.7554/eLife.13424.003CC BY · PubMed Central
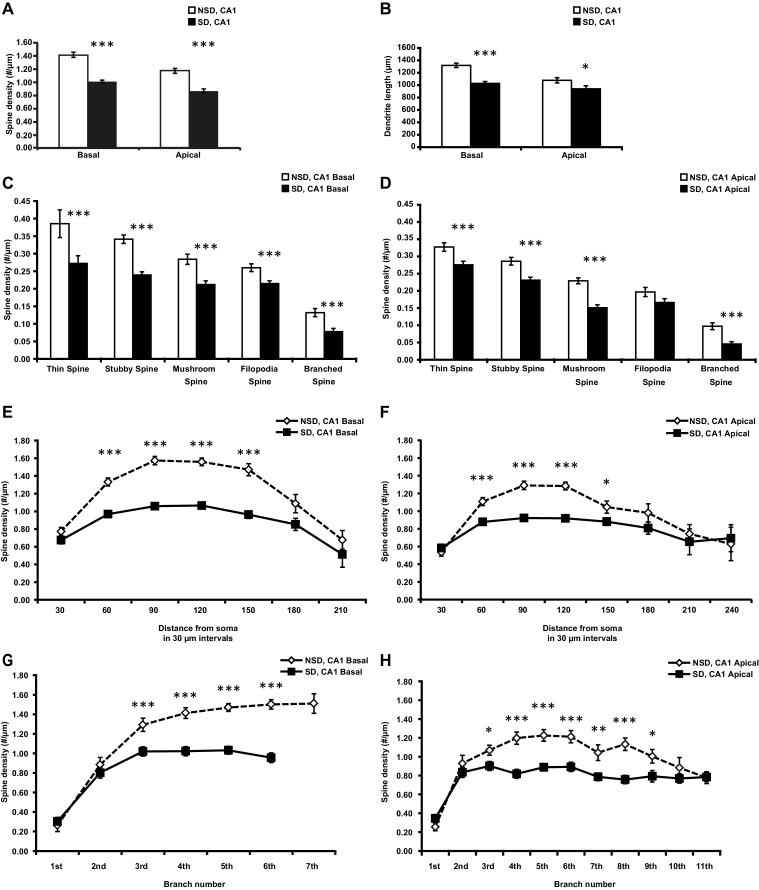
Figure 1—figure supplement 1. Sleep deprivation decreases spine density and dendrite length in both basal and apical dendrites of CA1 neurons. (A) Sleep deprivation reduces the spine density of both basal and apical dendrites in CA1 neurons (5–6 animals per group, 5 neurons per animal). (B) Sleep deprivation decreases basal and apical dendrite length of CA1 neurons (5–6 animals per group, 5 neurons per animal). (C) Sleep deprivation reduces the number of all spine types in basal dendrites in CA1 neurons (5–6 animals per group, 5 neurons per animal). (D) Sleep deprivation reduces the number of all spine types with exception of filopodia spines in apical dendrites of CA1 neurons (5–6 animals per group, 5 neurons per animal). (E) Sleep deprivation reduces spine density of basal dendrites between 60 and 150 µm away from the soma (5–6 animals per group, 5 neurons per animal). (F) Sleep deprivation reduces spine density of apical dendrites between 60 and 150 µm away from the soma (5–6 animals per group, 5 neurons per animal). (G) Sleep deprivation decreases spine density in the third to sixth branch of basal dendrites of hippocampal CA1 neurons (5–6 animals per group, 5 neurons per animal). (H) Sleep deprivation decreases spine density in the third to ninth branch of apical dendrites in hippocampal CA1 neurons (5–6 animals per group, 5 neurons per animal). NSD: non-sleep deprived, SD: sleep deprived. Values represent the mean ± SEM. *p<0.05, **p<0.01, ****p<0.0001 by Student’s t test. DOI: http://dx.doi.org/10.7554/eLife.13424.004
Figure 1—figure supplement 1. Sleep deprivation decreases spine density and dendrite length in both basal and apical dendrites of CA1 neurons. (A) Sleep deprivation reduces the spine density of both basal and apical dendrites in CA1 neurons (5–6 animals per group, 5 neurons per animal). (B) Sleep deprivation decreases basal and apical dendrite length of CA1 neurons (5–6 animals per group, 5 neurons per animal). (C) Sleep deprivation reduces the number of all spine types in basal dendrites in CA1 neurons (5–6 animals per group, 5 neurons per animal). (D) Sleep deprivation reduces the number of all spine types with exception of filopodia spines in apical dendrites of CA1 neurons (5–6 animals per group, 5 neurons per animal). (E) Sleep deprivation reduces spine density of basal dendrites between 60 and 150 µm away from the soma (5–6 animals per group, 5 neurons per animal). (F) Sleep deprivation reduces spine density of apical dendrites between 60 and 150 µm away from the soma (5–6 animals per group, 5 neurons per animal). (G) Sleep deprivation decreases spine density in the third to sixth branch of basal dendrites of hippocampal CA1 neurons (5–6 animals per group, 5 neurons per animal). (H) Sleep deprivation decreases spine density in the third to ninth branch of apical dendrites in hippocampal CA1 neurons (5–6 animals per group, 5 neurons per animal). NSD: non-sleep deprived, SD: sleep deprived. Values represent the mean ± SEM. *p<0.05, **p<0.01, ****p<0.0001 by Student’s t test. DOI: http://dx.doi.org/10.7554/eLife.13424.004CC BY · PubMed Central
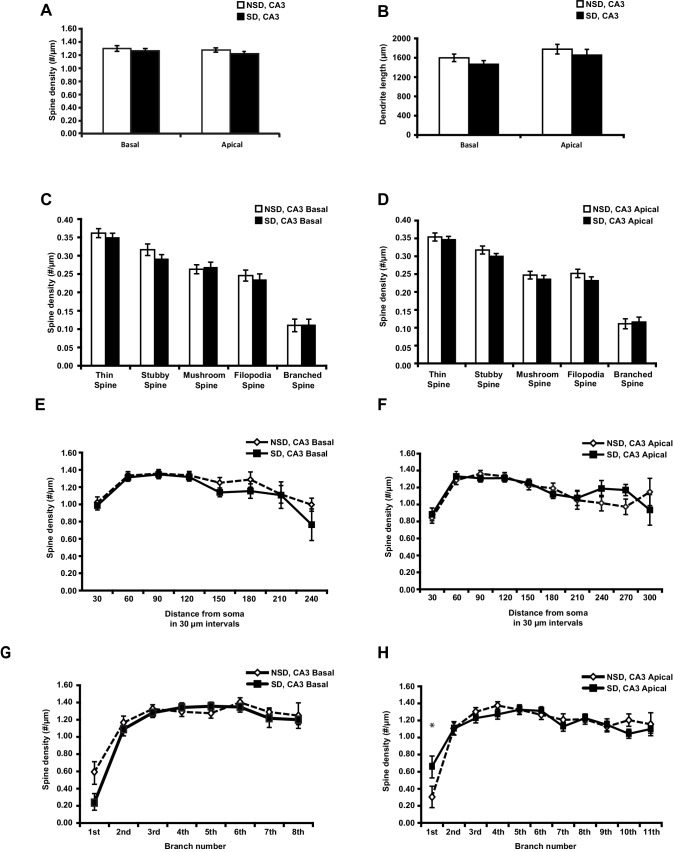
Figure 1—figure supplement 2. Sleep deprivation does not reduce spine density and dendrite length in both basal and apical dendrites of CA3 neurons. (A) Sleep deprivation does not alter the spine density of basal and apical dendrites in CA3 neurons (6 animals per group, 4 neurons per animal, Student’s t test p>0.28). (B) Sleep deprivation does not alter basal and apical dendrite length of CA3 neurons (6 animals per group, 4 neurons per animal, Student’s t test, p>0.37). (C) Sleep deprivation does not change the number of any spine type in basal dendrites of CA3 neurons (6 animals per group, 4 neurons per animal, Student’s t test, p>0.31). (D) Sleep deprivation does not affect the number of any spine type in apical dendrites of CA3 neurons (6 animals per group, 4 neurons per animal, Student’s t test, p>0.31). (E) Sleep deprivation does not alter the spine density of basal dendrites at any distance from the soma (6 animals per group, 4 neurons per animal, Student’s t test, p>0.05). (F) Sleep deprivation does not impact spine density of apical dendrites at any distance from the soma (6 animals per group, 4 neurons per animal). (G) Sleep deprivation does not affect the number of spines of basal dendrites at any branch number (6 animals per group, 4 neurons per animal, Student’s t test, p>0.05). (H) Sleep deprivation does not affect the number of spines of apical dendrites at any branch number with exception of the first apical branch (6 animals per group, 4 neurons per animal, Student’s t test, p>0.05; branch 1 Student’s t test, p<0.05). NSD: non-sleep deprived, SD: sleep deprived. Values represent the mean ± SEM. *p<0.05, by Student’s t test. DOI: http://dx.doi.org/10.7554/eLife.13424.005
Figure 1—figure supplement 2. Sleep deprivation does not reduce spine density and dendrite length in both basal and apical dendrites of CA3 neurons. (A) Sleep deprivation does not alter the spine density of basal and apical dendrites in CA3 neurons (6 animals per group, 4 neurons per animal, Student’s t test p>0.28). (B) Sleep deprivation does not alter basal and apical dendrite length of CA3 neurons (6 animals per group, 4 neurons per animal, Student’s t test, p>0.37). (C) Sleep deprivation does not change the number of any spine type in basal dendrites of CA3 neurons (6 animals per group, 4 neurons per animal, Student’s t test, p>0.31). (D) Sleep deprivation does not affect the number of any spine type in apical dendrites of CA3 neurons (6 animals per group, 4 neurons per animal, Student’s t test, p>0.31). (E) Sleep deprivation does not alter the spine density of basal dendrites at any distance from the soma (6 animals per group, 4 neurons per animal, Student’s t test, p>0.05). (F) Sleep deprivation does not impact spine density of apical dendrites at any distance from the soma (6 animals per group, 4 neurons per animal). (G) Sleep deprivation does not affect the number of spines of basal dendrites at any branch number (6 animals per group, 4 neurons per animal, Student’s t test, p>0.05). (H) Sleep deprivation does not affect the number of spines of apical dendrites at any branch number with exception of the first apical branch (6 animals per group, 4 neurons per animal, Student’s t test, p>0.05; branch 1 Student’s t test, p<0.05). NSD: non-sleep deprived, SD: sleep deprived. Values represent the mean ± SEM. *p<0.05, by Student’s t test. DOI: http://dx.doi.org/10.7554/eLife.13424.005CC BY · PubMed Central
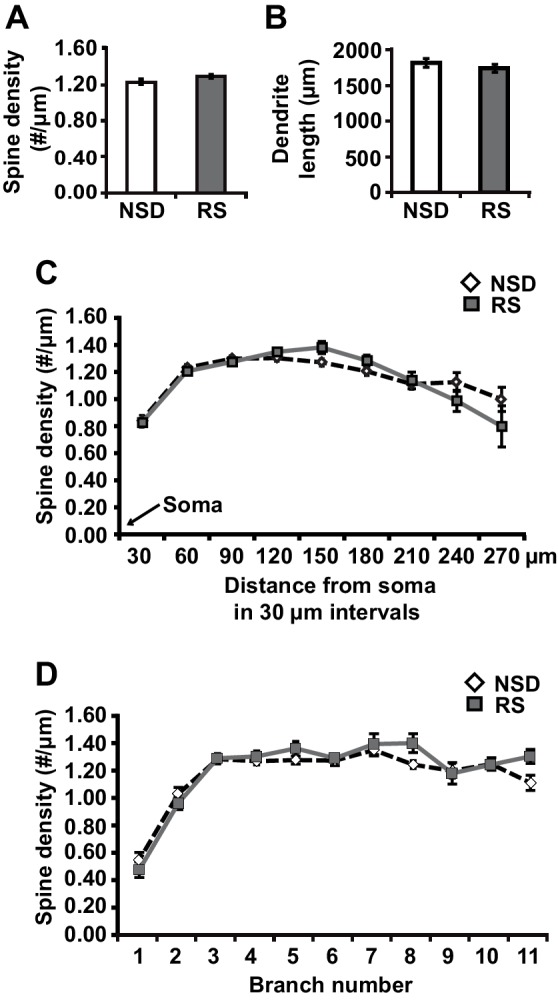
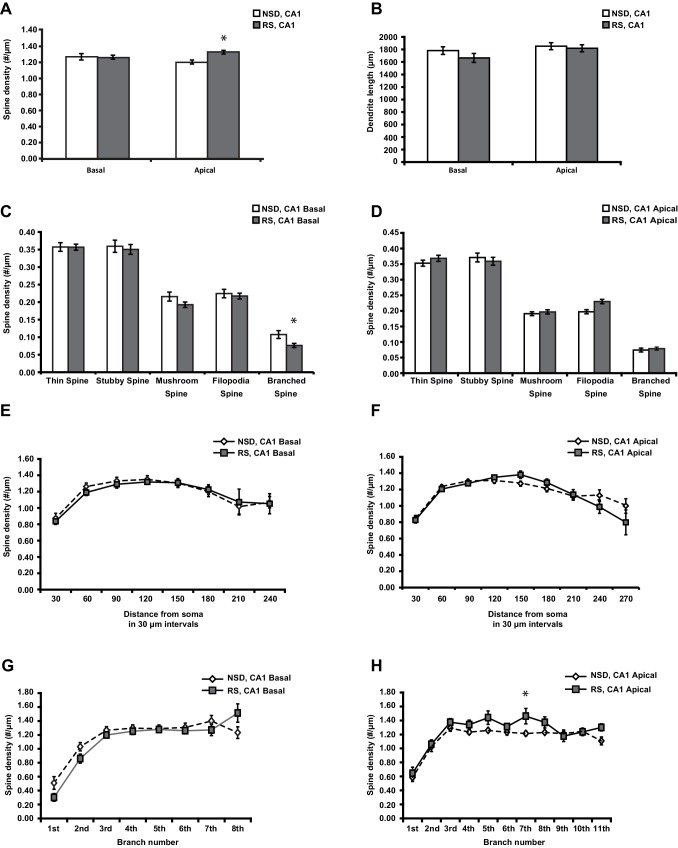
Figure 2. Three hours of recovery sleep restores spine numbers and dendrite length of CA1 neurons in the hippocampus. (A) Golgi analyses indicated that three hours of recovery sleep after 5 hr of sleep deprivation restores the total number of spines per apical/basal dendrite of CA1 neurons (n = 6, Student’s t-test, p>0.05). (B) Three hours of recovery sleep after 5 hr of sleep deprivation restores apical/basal dendrite length of CA1 neurons (n = 6, Student’s t-test, p=0.173). (C, D) Three hours of recovery sleep restores apical/basal spine numbers at all distances from the soma (Student’s t-test, p>0.05 for each distance from soma, C) and at each branch number (Student’s t-test, p>0.05 for each branch number, C). NSD: non-sleep deprived, RS: Sleep deprivation + recovery sleep. Values represent the mean ± SEM. See also Figure 2—figure supplement 1 for separate Golgi analyses of apical and basal spine numbers. DOI: http://dx.doi.org/10.7554/eLife.13424.006
Figure 2. Three hours of recovery sleep restores spine numbers and dendrite length of CA1 neurons in the hippocampus. (A) Golgi analyses indicated that three hours of recovery sleep after 5 hr of sleep deprivation restores the total number of spines per apical/basal dendrite of CA1 neurons (n = 6, Student’s t-test, p>0.05). (B) Three hours of recovery sleep after 5 hr of sleep deprivation restores apical/basal dendrite length of CA1 neurons (n = 6, Student’s t-test, p=0.173). (C, D) Three hours of recovery sleep restores apical/basal spine numbers at all distances from the soma (Student’s t-test, p>0.05 for each distance from soma, C) and at each branch number (Student’s t-test, p>0.05 for each branch number, C). NSD: non-sleep deprived, RS: Sleep deprivation + recovery sleep. Values represent the mean ± SEM. See also Figure 2—figure supplement 1 for separate Golgi analyses of apical and basal spine numbers. DOI: http://dx.doi.org/10.7554/eLife.13424.006CC BY · PubMed Central
Figure 2—figure supplement 1. Three hours of recovery sleep after 5 hr of sleep deprivation is sufficient to restore spine numbers and dendrite length in both basal and apical dendrites of CA1 neurons. (A) Recovery sleep leads to increased spine density in apical dendrite of CA1 neurons (6 animals per group, 4 neurons per animal, Student’s t test p<0.05). (B) Recovery sleep restores basal and apical dendrite length of CA1 neurons (6 animals per group, 4 neurons per animal, Student’s t test p>0.16). (C) Recovery sleep restores the number of all spine types in basal dendrites of CA1 neurons with the exception of branched spines (6 animals per group, 4 neurons per animal, Student’s t test p>0.15; branched spines Student’s t test p<0.05). (D) Recovery sleep restores the number of all spine types in apical dendrites of CA1 neurons with the exception of branched spines which are increased by recovery sleep (6 animals per group, 4 neurons per animal, Student’s t test p>0.4; filopodia spines Student’s t test p<0.05). (E) Recovery sleep restores the spine density of basal dendrites at all distances of the soma (6 animals per group, 4 neurons per anima, Student’s t test p>0.05). (F) Recovery sleep restores the spine density of apical dendrites between at all distances from the soma (6 animals per group, 4 neurons per animal, Student’s t test p>0.05). (G) Recovery sleep restores the spine density of basal dendrites of hippocampal CA1 neurons at all branch numbers (6 animals per group, 4 neurons per animal, Student’s t test p>0.05). (H) Recovery sleep restores the spine density of apical dendrites of hippocampal CA1 neurons at all branch numbers with exception of the seventh branch (6 animals per group, 4 neurons per animal, Student’s t test p>0.05; branch 7 Student’s t test p<0.05). NSD: non-sleep deprived, RS: recovery sleep. Values represent the mean ± SEM. *p<0.05, by Student’s t test. DOI: http://dx.doi.org/10.7554/eLife.13424.007
Figure 2—figure supplement 1. Three hours of recovery sleep after 5 hr of sleep deprivation is sufficient to restore spine numbers and dendrite length in both basal and apical dendrites of CA1 neurons. (A) Recovery sleep leads to increased spine density in apical dendrite of CA1 neurons (6 animals per group, 4 neurons per animal, Student’s t test p<0.05). (B) Recovery sleep restores basal and apical dendrite length of CA1 neurons (6 animals per group, 4 neurons per animal, Student’s t test p>0.16). (C) Recovery sleep restores the number of all spine types in basal dendrites of CA1 neurons with the exception of branched spines (6 animals per group, 4 neurons per animal, Student’s t test p>0.15; branched spines Student’s t test p<0.05). (D) Recovery sleep restores the number of all spine types in apical dendrites of CA1 neurons with the exception of branched spines which are increased by recovery sleep (6 animals per group, 4 neurons per animal, Student’s t test p>0.4; filopodia spines Student’s t test p<0.05). (E) Recovery sleep restores the spine density of basal dendrites at all distances of the soma (6 animals per group, 4 neurons per anima, Student’s t test p>0.05). (F) Recovery sleep restores the spine density of apical dendrites between at all distances from the soma (6 animals per group, 4 neurons per animal, Student’s t test p>0.05). (G) Recovery sleep restores the spine density of basal dendrites of hippocampal CA1 neurons at all branch numbers (6 animals per group, 4 neurons per animal, Student’s t test p>0.05). (H) Recovery sleep restores the spine density of apical dendrites of hippocampal CA1 neurons at all branch numbers with exception of the seventh branch (6 animals per group, 4 neurons per animal, Student’s t test p>0.05; branch 7 Student’s t test p<0.05). NSD: non-sleep deprived, RS: recovery sleep. Values represent the mean ± SEM. *p<0.05, by Student’s t test. DOI: http://dx.doi.org/10.7554/eLife.13424.007CC BY · PubMed Central
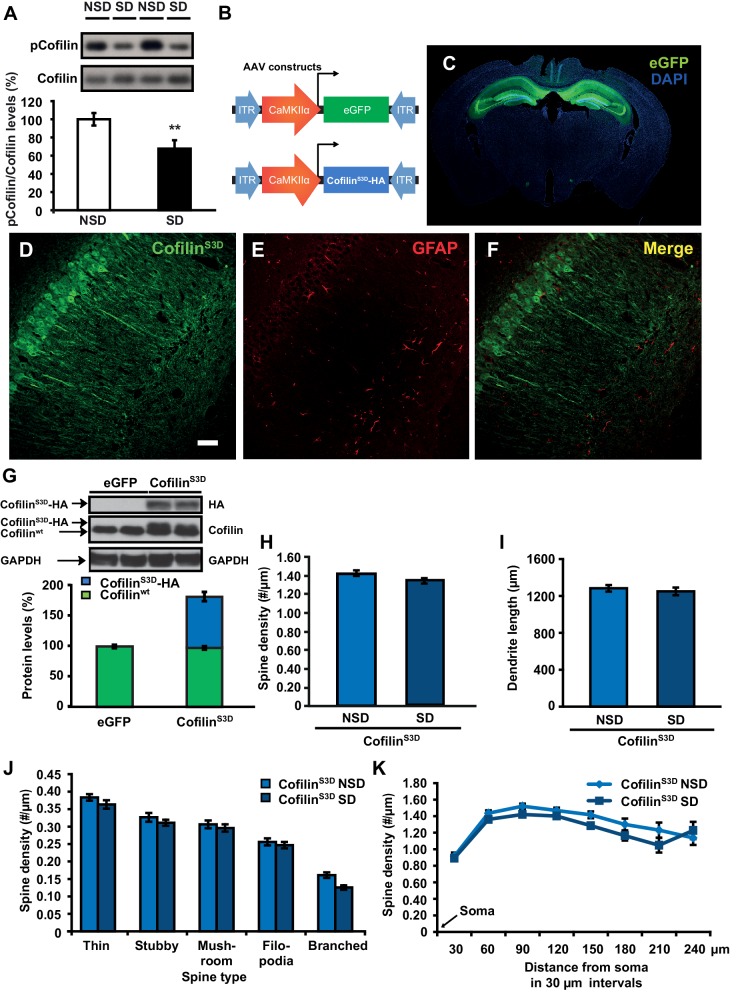
Figure 3. Increased cofilin activity in the hippocampus mediates the spine loss associated with sleep deprivation. (A) Five hours of sleep deprivation leads to a reduction in cofilin phosphorylation at serine 3 in the hippocampus. A representative blot is shown. Each band represents an individual animal. (n = 13–14, Student’s t-test p=0.0090). (B) Mice were injected with pAAV9-CaMKIIα0.4-eGFP or pAAV9-CaMKIIα0.4-cofilinS3D-HA into the hippocampus to drive expression of eGFP or the mutant inactive form of cofilin (cofilinS3D) in excitatory neurons. This inactive mutant form of cofilin was made by substituting serine 3 for aspartic acid, which mimics a phosphoserine residue. An HA-tag was included to discriminate between mutant and endogenous cofilin. (C) A representative image showing that viral eGFP expression was restricted to the hippocampus. (D–F) CofilinS3D expression was excluded from astrocytes in area CA1 as indicated by a lack of co-labeling (F) between viral cofilin (D) and GFAP expression (E). Scale bar, 100 µM. (G) Virally delivered cofilinS3D protein levels were approximately 75% (blue bar) of wild-type cofilin levels (green bar). Wild-type cofilin levels were not significantly affected by expression of cofilinS3D. An HA-tag antibody was used to detect the mutant inactive form of cofilin. (n = 4). (H) Hippocampal cofilinS3D expression prevents spine loss in apical/basal dendrites of CA1 neurons that is associated with sleep deprivation (n = 6, Student’s t-test, p>0.05). (I) Hippocampal cofilinS3D expression prevents the decrease in apical/basal dendritic spine length in neurons of hippocampal that is caused by sleep deprivation (n = 6, Student’s t-test, p>0.05). (J) Sleep deprivation does not alter the number of any spine type in apical/basal dendrites of CA1 neurons in the hippocampus of mice expressing cofilinS3D (n = 6, Student’s t-test, p>0.05). (K) Sleep deprivation does not attenuate apical/basal spine density at any distance from the soma in mice expressing cofilinS3D (n = 6, Student’s t-test, p>0.05). NSD: non-sleep deprived, SD: sleep deprived. Values represent the mean ± SEM. **p=0.0090. Student’s t test. See also Figure 3—figure supplement 1. For separate analyses of apical and basal spine numbers see Figure 3—figure supplement 2. DOI: http://dx.doi.org/10.7554/eLife.13424.008
Figure 3. Increased cofilin activity in the hippocampus mediates the spine loss associated with sleep deprivation. (A) Five hours of sleep deprivation leads to a reduction in cofilin phosphorylation at serine 3 in the hippocampus. A representative blot is shown. Each band represents an individual animal. (n = 13–14, Student’s t-test p=0.0090). (B) Mice were injected with pAAV9-CaMKIIα0.4-eGFP or pAAV9-CaMKIIα0.4-cofilinS3D-HA into the hippocampus to drive expression of eGFP or the mutant inactive form of cofilin (cofilinS3D) in excitatory neurons. This inactive mutant form of cofilin was made by substituting serine 3 for aspartic acid, which mimics a phosphoserine residue. An HA-tag was included to discriminate between mutant and endogenous cofilin. (C) A representative image showing that viral eGFP expression was restricted to the hippocampus. (D–F) CofilinS3D expression was excluded from astrocytes in area CA1 as indicated by a lack of co-labeling (F) between viral cofilin (D) and GFAP expression (E). Scale bar, 100 µM. (G) Virally delivered cofilinS3D protein levels were approximately 75% (blue bar) of wild-type cofilin levels (green bar). Wild-type cofilin levels were not significantly affected by expression of cofilinS3D. An HA-tag antibody was used to detect the mutant inactive form of cofilin. (n = 4). (H) Hippocampal cofilinS3D expression prevents spine loss in apical/basal dendrites of CA1 neurons that is associated with sleep deprivation (n = 6, Student’s t-test, p>0.05). (I) Hippocampal cofilinS3D expression prevents the decrease in apical/basal dendritic spine length in neurons of hippocampal that is caused by sleep deprivation (n = 6, Student’s t-test, p>0.05). (J) Sleep deprivation does not alter the number of any spine type in apical/basal dendrites of CA1 neurons in the hippocampus of mice expressing cofilinS3D (n = 6, Student’s t-test, p>0.05). (K) Sleep deprivation does not attenuate apical/basal spine density at any distance from the soma in mice expressing cofilinS3D (n = 6, Student’s t-test, p>0.05). NSD: non-sleep deprived, SD: sleep deprived. Values represent the mean ± SEM. **p=0.0090. Student’s t test. See also Figure 3—figure supplement 1. For separate analyses of apical and basal spine numbers see Figure 3—figure supplement 2. DOI: http://dx.doi.org/10.7554/eLife.13424.008CC BY · PubMed Central
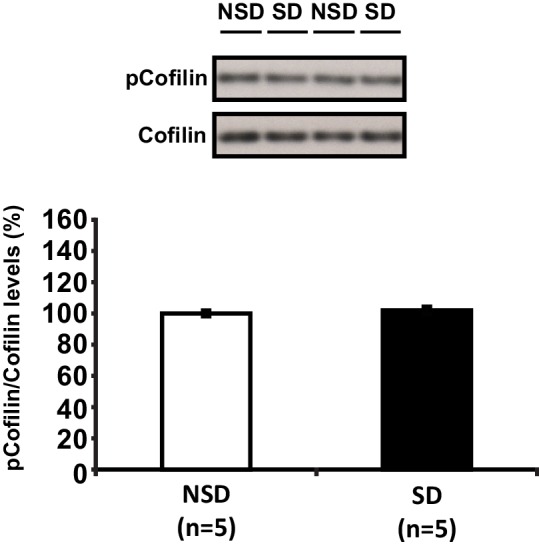
Figure 3—figure supplement 1. Sleep deprivation does not alter cofilin phosphorylation in the prefrontal cortex. Five hours of sleep deprivation does not lead to a reduction in cofilin phosphorylation at serine 3 in the prefrontal cortex. A representative blot is shown. Each band represents an individual animal. (Student’s t test p>0.5). DOI: http://dx.doi.org/10.7554/eLife.13424.010
Figure 3—figure supplement 1. Sleep deprivation does not alter cofilin phosphorylation in the prefrontal cortex. Five hours of sleep deprivation does not lead to a reduction in cofilin phosphorylation at serine 3 in the prefrontal cortex. A representative blot is shown. Each band represents an individual animal. (Student’s t test p>0.5). DOI: http://dx.doi.org/10.7554/eLife.13424.010CC BY · PubMed Central
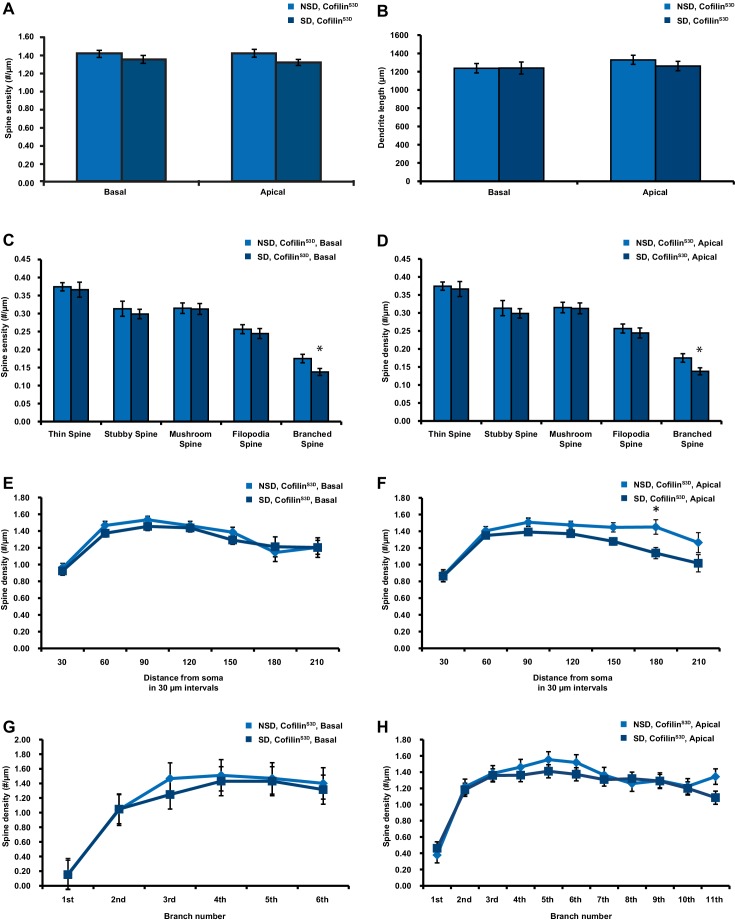
Figure 3—figure supplement 2. CofilinS3D expression prevents sleep deprivation-induced reductions in spine numbers and dendrite length in both basal and apical dendrites of CA1 neurons. (A) In mice expressing cofilinS3D, sleep deprivation does not decrease the spine density of basal and apical dendrite of CA1 neurons (6 animals per group, 4 neurons per animal). (B) In mice expressing cofilinS3D, sleep deprivation does not cause a decrease in the length of basal and apical dendrite length of CA1 neurons (6 animals per group, 4 neurons per animal). (C) In mice expressing cofilinS3D, sleep deprivation does not cause a reduction in the total number of spines for each subtype in basal dendrites of CA1 neurons with exception of the branched spines (6 animals per group, 4 neurons per animal, Student’s t test p>0.5, branched spines Student’s t test p<0.05). (D) In mice expressing cofilinS3D, sleep deprivation does not cause a decrease in the total number of spines for each subtype in apical dendrites of CA1 neurons with exception of the branched spines (6 animals per group, 4 neurons per animal, Student’s t test p>0.5, branched spines Student’s t test p<0.05). (E) In mice expressing cofilinS3D, sleep deprivation does not reduce the spine density of basal dendrites at any distance from the soma (6 animals per group, 4 neurons per animal, Student’s t test p>0.05). (F) In mice expressing cofilinS3D, sleep deprivation reduces spine density of apical dendrites only at a 180 µm distance from the soma (6 animals per group, 4 neurons per animal, Student’s t test p>0.05). (G) In mice expressing cofilinS3D, sleep deprivation does not decrease the spine density in any dendritic branch of the basal dendrites of CA1 neurons (6 animals per group, 4 neurons per animal, Student’s t test p>0.05). (H) In mice expressing cofilinS3D, sleep deprivation does not reduce the spine density in any dendritic branch of apical dendrites of hippocampal CA1 neurons (6 animals per group, 4 neurons per animal, Student’s t test p>0.05). NSD: non-sleep deprived, SD: sleep deprived. Values represent the mean ± SEM. *p<0.05 by Student’s t test. DOI: http://dx.doi.org/10.7554/eLife.13424.012
Figure 3—figure supplement 2. CofilinS3D expression prevents sleep deprivation-induced reductions in spine numbers and dendrite length in both basal and apical dendrites of CA1 neurons. (A) In mice expressing cofilinS3D, sleep deprivation does not decrease the spine density of basal and apical dendrite of CA1 neurons (6 animals per group, 4 neurons per animal). (B) In mice expressing cofilinS3D, sleep deprivation does not cause a decrease in the length of basal and apical dendrite length of CA1 neurons (6 animals per group, 4 neurons per animal). (C) In mice expressing cofilinS3D, sleep deprivation does not cause a reduction in the total number of spines for each subtype in basal dendrites of CA1 neurons with exception of the branched spines (6 animals per group, 4 neurons per animal, Student’s t test p>0.5, branched spines Student’s t test p<0.05). (D) In mice expressing cofilinS3D, sleep deprivation does not cause a decrease in the total number of spines for each subtype in apical dendrites of CA1 neurons with exception of the branched spines (6 animals per group, 4 neurons per animal, Student’s t test p>0.5, branched spines Student’s t test p<0.05). (E) In mice expressing cofilinS3D, sleep deprivation does not reduce the spine density of basal dendrites at any distance from the soma (6 animals per group, 4 neurons per animal, Student’s t test p>0.05). (F) In mice expressing cofilinS3D, sleep deprivation reduces spine density of apical dendrites only at a 180 µm distance from the soma (6 animals per group, 4 neurons per animal, Student’s t test p>0.05). (G) In mice expressing cofilinS3D, sleep deprivation does not decrease the spine density in any dendritic branch of the basal dendrites of CA1 neurons (6 animals per group, 4 neurons per animal, Student’s t test p>0.05). (H) In mice expressing cofilinS3D, sleep deprivation does not reduce the spine density in any dendritic branch of apical dendrites of hippocampal CA1 neurons (6 animals per group, 4 neurons per animal, Student’s t test p>0.05). NSD: non-sleep deprived, SD: sleep deprived. Values represent the mean ± SEM. *p<0.05 by Student’s t test. DOI: http://dx.doi.org/10.7554/eLife.13424.012CC BY · PubMed Central
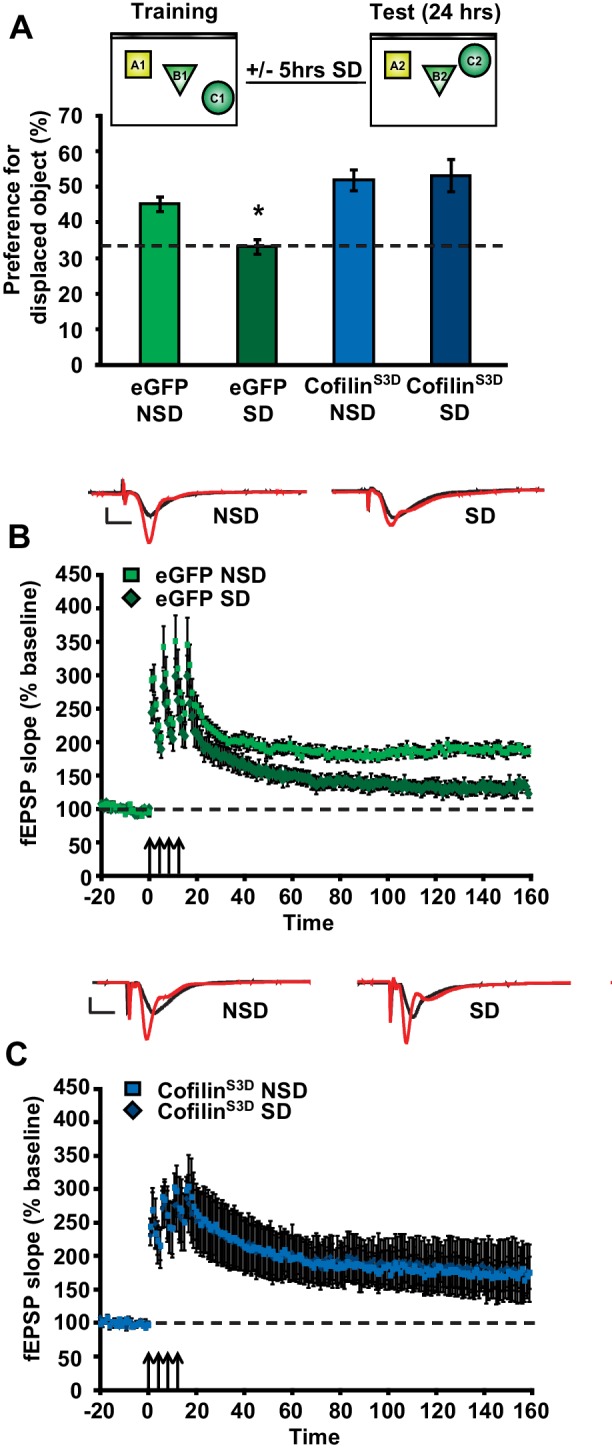
Figure 4. Increased cofilin activity in the hippocampus mediates the memory and synaptic plasticity deficits associated with sleep deprivation. (A) Mice expressing eGFP or cofilinS3D were trained in the hippocampus-dependent object-place recognition task. Half of the groups were sleep deprived for 5 hr and all mice were tested 24 hr later. Hippocampal cofilinS3D expression prevents memory deficits caused by sleep deprivation (n = 9–10, two-way ANOVA, effect of virus F1,35 = 18.567, p=0.0001; effect of sleep deprivation F1,35 = 2.975, p=0.093; interaction effect F1,35 = 4.567, p=0.040; eGFP SD group versus other groups, p<0.05). The dotted line indicates chance performance (33.3%). (B, C) Following 5 hr of sleep deprivation, long-lasting LTP was induced in hippocampal slices by application of four 100 Hz trains, 1 s each, spaced 5 min apart to the Schaffer collateral pathway. Five hours of sleep deprivation impairs long-lasting LTP in slices from mice expressing eGFP (n = 6–7, two-way ANOVA, effect of virus F1,10 = 21.685, p<0.001). In contrast, virally delivered cofilinS3D prevents sleep deprivation-induced deficits (n = 5, two-way ANOVA, effect of virus F1,8 = 0.016, p>0.902). NSD: non-sleep deprived, SD: sleep deprived. Values represent the mean ± SEM. *p<0.05 by posthoc Dunnet’s test, **p<0.01 by Student’s t test. See also Figure 4—figure supplement 1. DOI: http://dx.doi.org/10.7554/eLife.13424.013
Figure 4. Increased cofilin activity in the hippocampus mediates the memory and synaptic plasticity deficits associated with sleep deprivation. (A) Mice expressing eGFP or cofilinS3D were trained in the hippocampus-dependent object-place recognition task. Half of the groups were sleep deprived for 5 hr and all mice were tested 24 hr later. Hippocampal cofilinS3D expression prevents memory deficits caused by sleep deprivation (n = 9–10, two-way ANOVA, effect of virus F1,35 = 18.567, p=0.0001; effect of sleep deprivation F1,35 = 2.975, p=0.093; interaction effect F1,35 = 4.567, p=0.040; eGFP SD group versus other groups, p<0.05). The dotted line indicates chance performance (33.3%). (B, C) Following 5 hr of sleep deprivation, long-lasting LTP was induced in hippocampal slices by application of four 100 Hz trains, 1 s each, spaced 5 min apart to the Schaffer collateral pathway. Five hours of sleep deprivation impairs long-lasting LTP in slices from mice expressing eGFP (n = 6–7, two-way ANOVA, effect of virus F1,10 = 21.685, p<0.001). In contrast, virally delivered cofilinS3D prevents sleep deprivation-induced deficits (n = 5, two-way ANOVA, effect of virus F1,8 = 0.016, p>0.902). NSD: non-sleep deprived, SD: sleep deprived. Values represent the mean ± SEM. *p<0.05 by posthoc Dunnet’s test, **p<0.01 by Student’s t test. See also Figure 4—figure supplement 1. DOI: http://dx.doi.org/10.7554/eLife.13424.013CC BY · PubMed Central
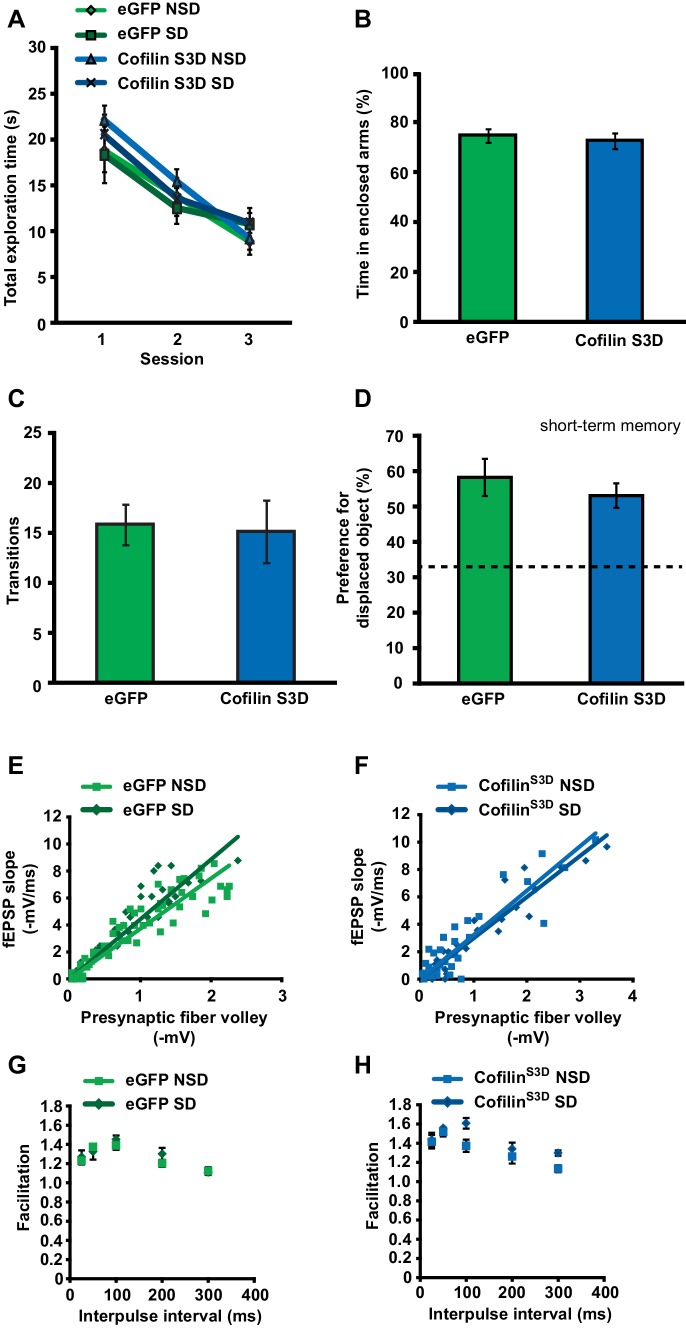
Figure 4—figure supplement 1. CofilinS3D expression in hippocampal neurons does not affect exploratory activity, anxiety levels, or basal synaptic transmission. (A) Expression of the catalytically inactive cofilinS3D in hippocampal neurons does not affect the total time spent exploring objects during training in the object place recognition task (ANOVA F1,35 = 1.026, p=0.318). All groups show a decrease in the total object exploration time during the training sessions (n = 9–10, two-way ANOVA, effect of session F2,70 = 54.060, p = 0.0001; interaction effect F2,70 = 0.880, p=0.419). (B) Mice expressing cofilinS3D in hippocampal neurons spent a similar amount of time in the enclosed arm of the zero maze as eGFP expressing mice indicating normal anxiety-related behavior (n = 7, Student’s t test, p=0.632). (C) Mice expressing cofilinS3D in hippocampal neurons had a similar number of transitions in the zero maze as eGFP expressing mice indicating normal locomotor activity (n = 7, Student’s t test, p=0.849). (D) CofilinS3D expression did not alter the formation of short-term object location memories measured one hour after training (n = 7–8, Student’s t test, p=0.42). (E, F) Input-output curves relating the amplitude of the presynaptic fiber volley to the initial slope of the corresponding fEPSP at various stimulus intensities are similar in slices from eGFP and cofilinS3D in slices from sleep deprived and non-sleep deprived mice (n = 5, eGFP NSD vs SD group, Student’s t test p=0.75; cofilinS3D, NSD vs SD group, Student’s t test p=0.17). (G, H) Paired-pulse facilitation, a short-term form of synaptic plasticity, was not changed in slices from eGFP and cofilinS3D in slices from sleep deprived and non-sleep deprived mice (n = 5, eGFP NSD vs SD group two-way repeated-measures ANOVA, F1,8= 0.393, p=0.545) (cofilinS3D NSD vs SD group two-way repeated-measures ANOVA, F1,8= 3.056, = 0.114). NSD: non-sleep deprived, SD: sleep deprived. Values represent the mean ± SEM. DOI: http://dx.doi.org/10.7554/eLife.13424.015
Figure 4—figure supplement 1. CofilinS3D expression in hippocampal neurons does not affect exploratory activity, anxiety levels, or basal synaptic transmission. (A) Expression of the catalytically inactive cofilinS3D in hippocampal neurons does not affect the total time spent exploring objects during training in the object place recognition task (ANOVA F1,35 = 1.026, p=0.318). All groups show a decrease in the total object exploration time during the training sessions (n = 9–10, two-way ANOVA, effect of session F2,70 = 54.060, p = 0.0001; interaction effect F2,70 = 0.880, p=0.419). (B) Mice expressing cofilinS3D in hippocampal neurons spent a similar amount of time in the enclosed arm of the zero maze as eGFP expressing mice indicating normal anxiety-related behavior (n = 7, Student’s t test, p=0.632). (C) Mice expressing cofilinS3D in hippocampal neurons had a similar number of transitions in the zero maze as eGFP expressing mice indicating normal locomotor activity (n = 7, Student’s t test, p=0.849). (D) CofilinS3D expression did not alter the formation of short-term object location memories measured one hour after training (n = 7–8, Student’s t test, p=0.42). (E, F) Input-output curves relating the amplitude of the presynaptic fiber volley to the initial slope of the corresponding fEPSP at various stimulus intensities are similar in slices from eGFP and cofilinS3D in slices from sleep deprived and non-sleep deprived mice (n = 5, eGFP NSD vs SD group, Student’s t test p=0.75; cofilinS3D, NSD vs SD group, Student’s t test p=0.17). (G, H) Paired-pulse facilitation, a short-term form of synaptic plasticity, was not changed in slices from eGFP and cofilinS3D in slices from sleep deprived and non-sleep deprived mice (n = 5, eGFP NSD vs SD group two-way repeated-measures ANOVA, F1,8= 0.393, p=0.545) (cofilinS3D NSD vs SD group two-way repeated-measures ANOVA, F1,8= 3.056, = 0.114). NSD: non-sleep deprived, SD: sleep deprived. Values represent the mean ± SEM. DOI: http://dx.doi.org/10.7554/eLife.13424.015CC BY · PubMed Central
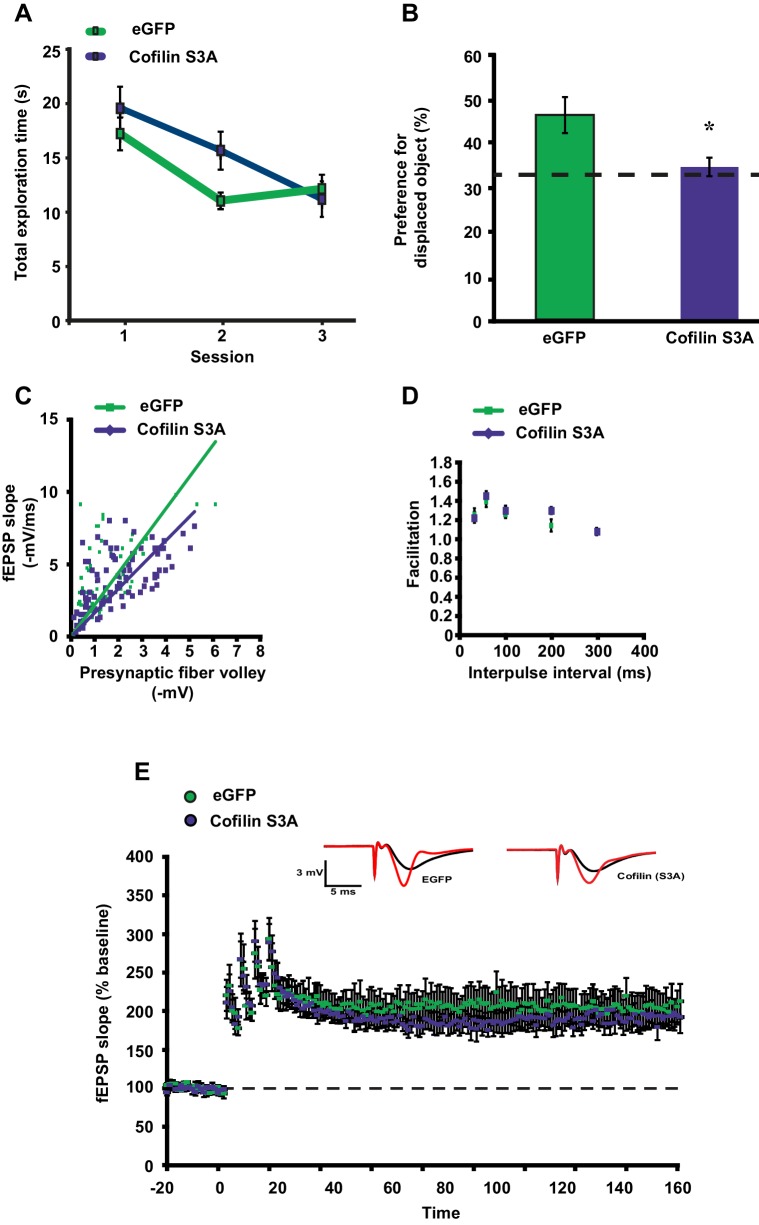
Figure 4—figure supplement 2. CofilinS3A expression in hippocampal neurons attenuates the formation of long-term object-location memories but not long-term potentiation induced by spaced-four train LTP. (A) Mice expressing eGFP or the catalytically active cofilinS3A in hippocampal neurons were trained in the hippocampus-dependent object-place recognition task. Expression of the cofilinS3A does not affect the total time spent exploring objects during training in the object place recognition task (ANOVA F1,18 = 1.919, p=0.183). Both groups show a decrease in the total object exploration time during the training sessions (n = 10, two-way ANOVA, effect of session F2,36 = 11.696, p=0.0001; interaction effect F2,36 = 1.85, p=0.172). (B) During the test session 24 hr after training, eGFP mice preferentially explored the displaced object indicating that they successfully remembered the previous location of the individual objects. In contrast, mice expressing cofilinS3A explored all objects to a similar extent, indicative of a poor memory for the original object locations (eGFP, 46.9 ± 4.2%; cofilinS3A, 34.9 ± 2.1%; Student’s t test, p=0.025). (C) Input-output curves relating the amplitude of the presynaptic fiber volley to the initial slope of the corresponding fEPSP at various stimulus intensities are similar in slices from eGFP and cofilinS3A in slices from non-sleep deprived mice (eGFP n = 6, cofilinS3A n = 8, Student’s t test p = 0.857). (D) Paired-pulse facilitation, a short-term form of synaptic plasticity, was not changed in slices from eGFP and cofilinS3A in slices from non-sleep deprived mice (n = 5–6, eGFP vs cofilinS3A group two-way repeated-measures ANOVA, F1,12= 0.218, p=0.649). (E) Long-lasting LTP was induced in hippocampal slices by application of four 100 Hz trains, 1 s each, spaced 5 min apart to the Schaffer collateral pathway. Virally delivered CofilinS3A expression did not alter LTP expression (n = 5, two-way ANOVA, effect of virus F1,8 = 1.102, p=0.0325). Dotted line indicates chance level performance. Values represent the mean ± SEM. *p<0.05 by Student’s t test. DOI: http://dx.doi.org/10.7554/eLife.13424.017
Figure 4—figure supplement 2. CofilinS3A expression in hippocampal neurons attenuates the formation of long-term object-location memories but not long-term potentiation induced by spaced-four train LTP. (A) Mice expressing eGFP or the catalytically active cofilinS3A in hippocampal neurons were trained in the hippocampus-dependent object-place recognition task. Expression of the cofilinS3A does not affect the total time spent exploring objects during training in the object place recognition task (ANOVA F1,18 = 1.919, p=0.183). Both groups show a decrease in the total object exploration time during the training sessions (n = 10, two-way ANOVA, effect of session F2,36 = 11.696, p=0.0001; interaction effect F2,36 = 1.85, p=0.172). (B) During the test session 24 hr after training, eGFP mice preferentially explored the displaced object indicating that they successfully remembered the previous location of the individual objects. In contrast, mice expressing cofilinS3A explored all objects to a similar extent, indicative of a poor memory for the original object locations (eGFP, 46.9 ± 4.2%; cofilinS3A, 34.9 ± 2.1%; Student’s t test, p=0.025). (C) Input-output curves relating the amplitude of the presynaptic fiber volley to the initial slope of the corresponding fEPSP at various stimulus intensities are similar in slices from eGFP and cofilinS3A in slices from non-sleep deprived mice (eGFP n = 6, cofilinS3A n = 8, Student’s t test p = 0.857). (D) Paired-pulse facilitation, a short-term form of synaptic plasticity, was not changed in slices from eGFP and cofilinS3A in slices from non-sleep deprived mice (n = 5–6, eGFP vs cofilinS3A group two-way repeated-measures ANOVA, F1,12= 0.218, p=0.649). (E) Long-lasting LTP was induced in hippocampal slices by application of four 100 Hz trains, 1 s each, spaced 5 min apart to the Schaffer collateral pathway. Virally delivered CofilinS3A expression did not alter LTP expression (n = 5, two-way ANOVA, effect of virus F1,8 = 1.102, p=0.0325). Dotted line indicates chance level performance. Values represent the mean ± SEM. *p<0.05 by Student’s t test. DOI: http://dx.doi.org/10.7554/eLife.13424.017CC BY · PubMed Central
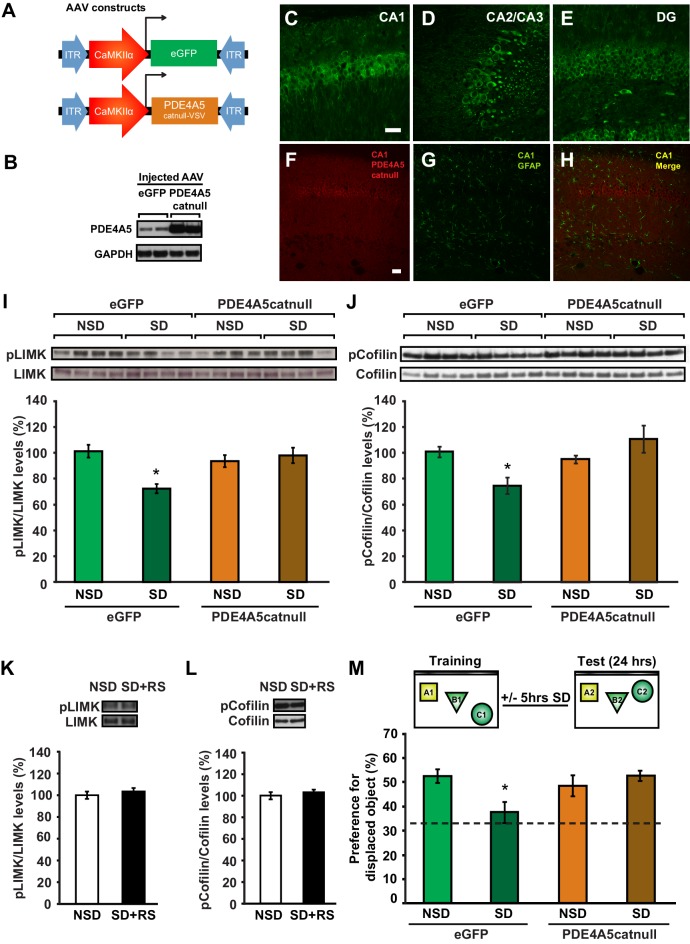
Figure 5. Expression of catalytically inactive PDE4A5 in hippocampal neurons prevents memory deficits and alterations in the cAMP-PKA-LIMK-cofilin signaling pathway associated with sleep deprivation. (A) Mice were injected with pAAV9-CaMKIIα0.4-eGFP or pAAV9-CaMKIIα0.4-PDE4A5catnull-VSV into the hippocampus to drive neuronal expression of eGFP or catalytically inactive full-length PDE4A5 (PDE4A5catnull). (B) Robust PDE4A5catnull expression was observed at the expected molecular weight, 108 kDa, in hippocampal lysates. (C–E) PDE4A5catnullexpression was observed in all 3 subregions of the hippocampus. (F–H) PDE4A5catnullwas not expressed in astrocytes reflected by a lack of co-labeling between PDE4A5catnull and GFAP expression. (I) Sleep deprivation causes a reduction in LIMK serine 596 phosphorylation in the hippocampus that is prevented by PDE4A5catnull expression (n = 7–8; two-way ANOVA, effect of virus F1,27 = 3.299, p=0.08; effect of sleep deprivation F1,27 = 6.124, p=0.02; interaction effect F1,27 = 11.336, p=0.002; eGFP SD group versus other groups p<0.05). (J) Sleep deprivation causes a reduction in cofilin phosphorylation in the hippocampus that is prevented by PDE4A5catnull expression (n = 9–10; two-way ANOVA, effect of virus F1,35 = 4.122, p=0.05; effect of sleep deprivation F1,35 = 2.885, p=0.1; interaction effect F1,35 = 9.416, p=0.004; eGFP SD group versus other groups p<0.05). (K, L) Three hours of recovery sleep after five hours of sleep deprivation restores hippocampal LIMK phosphorylation at serine 596 and cofilin phosphorylation at serine 3 to those observed in non-sleep deprived controls (p>0.45 for both comparisons). (M) Mice expressing eGFP or PDE4A5catnull were trained in the hippocampus-dependent object-place recognition task and immediately sleep deprived for 5 hr after training (SD) or left undisturbed (NSD). Hippocampal PDE4A5catnull expression prevents memory deficits caused by sleep deprivation (n = 8–10; two-way ANOVA, effect of virus F1,33 = 2.626, p=0.115; effect of sleep deprivation F1,33 = 2.311, p=0.138; interaction effect F1,33 = 7.485, p=0.01; posthoc Dunnet test eGFP SD group versus other groups p<0.05). In all blots, each lane represents one individual animal. NSD: non-sleep deprived, SD: sleep deprived, SD+RS: sleep deprived plus recovery sleep. Scale bar, 100 µm. Values represent the mean ± SEM. *p<0.05 by posthoc Dunnet’s posthoc test. See also Figure 5—figure supplement 1. DOI: http://dx.doi.org/10.7554/eLife.13424.018
Figure 5. Expression of catalytically inactive PDE4A5 in hippocampal neurons prevents memory deficits and alterations in the cAMP-PKA-LIMK-cofilin signaling pathway associated with sleep deprivation. (A) Mice were injected with pAAV9-CaMKIIα0.4-eGFP or pAAV9-CaMKIIα0.4-PDE4A5catnull-VSV into the hippocampus to drive neuronal expression of eGFP or catalytically inactive full-length PDE4A5 (PDE4A5catnull). (B) Robust PDE4A5catnull expression was observed at the expected molecular weight, 108 kDa, in hippocampal lysates. (C–E) PDE4A5catnullexpression was observed in all 3 subregions of the hippocampus. (F–H) PDE4A5catnullwas not expressed in astrocytes reflected by a lack of co-labeling between PDE4A5catnull and GFAP expression. (I) Sleep deprivation causes a reduction in LIMK serine 596 phosphorylation in the hippocampus that is prevented by PDE4A5catnull expression (n = 7–8; two-way ANOVA, effect of virus F1,27 = 3.299, p=0.08; effect of sleep deprivation F1,27 = 6.124, p=0.02; interaction effect F1,27 = 11.336, p=0.002; eGFP SD group versus other groups p<0.05). (J) Sleep deprivation causes a reduction in cofilin phosphorylation in the hippocampus that is prevented by PDE4A5catnull expression (n = 9–10; two-way ANOVA, effect of virus F1,35 = 4.122, p=0.05; effect of sleep deprivation F1,35 = 2.885, p=0.1; interaction effect F1,35 = 9.416, p=0.004; eGFP SD group versus other groups p<0.05). (K, L) Three hours of recovery sleep after five hours of sleep deprivation restores hippocampal LIMK phosphorylation at serine 596 and cofilin phosphorylation at serine 3 to those observed in non-sleep deprived controls (p>0.45 for both comparisons). (M) Mice expressing eGFP or PDE4A5catnull were trained in the hippocampus-dependent object-place recognition task and immediately sleep deprived for 5 hr after training (SD) or left undisturbed (NSD). Hippocampal PDE4A5catnull expression prevents memory deficits caused by sleep deprivation (n = 8–10; two-way ANOVA, effect of virus F1,33 = 2.626, p=0.115; effect of sleep deprivation F1,33 = 2.311, p=0.138; interaction effect F1,33 = 7.485, p=0.01; posthoc Dunnet test eGFP SD group versus other groups p<0.05). In all blots, each lane represents one individual animal. NSD: non-sleep deprived, SD: sleep deprived, SD+RS: sleep deprived plus recovery sleep. Scale bar, 100 µm. Values represent the mean ± SEM. *p<0.05 by posthoc Dunnet’s posthoc test. See also Figure 5—figure supplement 1. DOI: http://dx.doi.org/10.7554/eLife.13424.018CC BY · PubMed Central
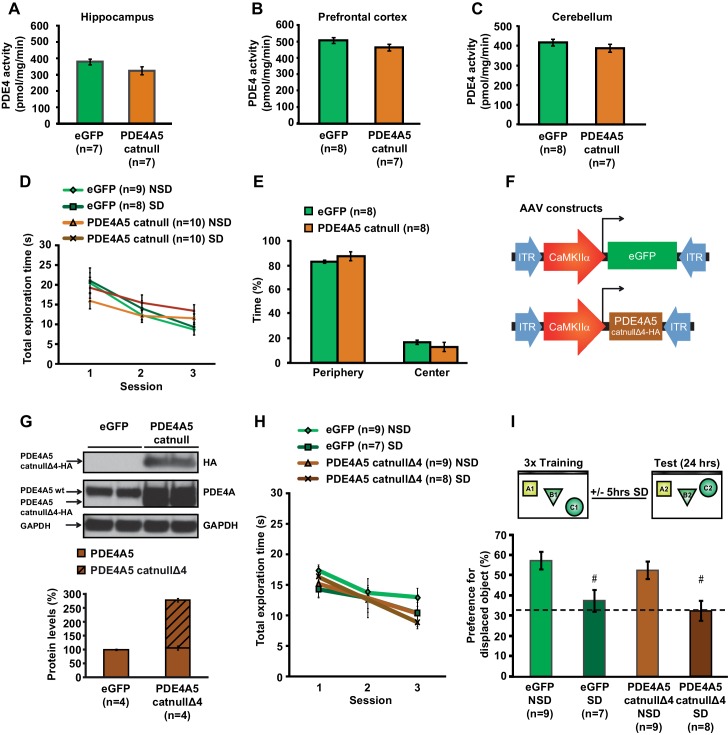
Figure 5—figure supplement 1. Expression of catalytically null PDE4A5 in the hippocampus: Catalytically inactive PDE4A5 without the unique N-terminal localization domain fails to prevent memory deficits associated with sleep loss. (A) PDE4A5catnull expression in hippocampal neurons did not significantly affect PDE4 activity in the hippocampus (n = 7, Student’s t test p=0.097). (B) PDE4 activity in the prefrontal cortex was not altered by expression of the catalytically inactive PDE4A5catnull in the hippocampus (n = 7–8, Student’s t test p=0.162). (C) PDE4 activity in the cerebellum was not changed by expression of the catalytically inactive PDE4A5catnull in the hippocampus (n = 7–8, Student’s t test p=0.293). (D) Expression of the catalytically inactive PDE4A5catnull in hippocampal neurons did not alter the total time spent exploring objects during training in the object-place recognition task (n = 8–10, two-way ANOVA, effect of virus F1,33 = 0.043, p=0.873). All groups show a decrease in the total object exploration time during consecutive training sessions (two-way ANOVA effect of session F2,66 = 32.777, p=0.0001). Mice expressing PDE4A5catnull had a slightly but non-significantly lower object exploration time during the first training session, and a slightly but non-significantly higher object exploration time during the last training session (interaction effect F2,66 = 4.875, p=0.011, one way ANOVAs per session, p>0.05). (E) Mice expressing PDE4A5catnull spend a similar time in the periphery of the open field as mice expressing eGFP in hippocampal neurons (n = 8, Student’s t test, p=0.292). (F) Mice were injected with pAAV9-CaMKIIα0.4-eGFP or pAAV9-CaMKIIα0.4-PDE4A5catnullΔ4-VSV into the hippocampus to drive neuronal expression of eGFP or catalytically inactive full-length PDE4A5 which lacked the N-terminal domain unique for PDE4A5 (PDE4A5catnullΔ4). A VSV-tag was included to discriminate between endogenous PDE4A5 and the truncated PDE4A5catnullΔ4. (G) PDE4A5catnullΔ4 protein levels in the hippocampus 4 weeks after viral injection. A sample blot probed with an isoform-nonspecific PDE4A antibody revealed the presence of both wild-type PDE4A5 protein and truncated PDE4A5catnullΔ4 protein. Probing the blot with an antibody for the HA-tag confirmed that the truncated protein is indeed the N-terminal lacking catalytically inactive PDE4A5catnullΔ4. Each band represents an individual animal (H) Expression of the catalytically inactive PDE4A5catnullΔ4 lacking the N-terminal domain in hippocampal neurons did not affect total object exploration time during training in the object-place recognition task (n = 7–9, two-way ANOVA effect of virus F1,29 = 0.470, p=0.498). All groups show decreased total object exploration times during consecutive training sessions (two-way ANOVA effect of session F2,58 = 13.597, p=0.0001; interaction effect F2,58 = 0.555, p=0.557). (I) Mice expressing eGFP or the N-terminal domain lacking inactive form of PDE4A5catnullΔ4 were trained in the hippocampus-dependent object-place recognition task. Sleep deprivation causes memory deficits in both eGFP and PDE4A5catnullΔ4 mice (n = 7–9; two-way ANOVA effect of sleep deprivation F1,29 = 18.131, p=0.0001; effect of virus F1,29 = 1.064, p=0.311; interaction effect F1,29 = 0.001, p=0.986; eGFP NSD versus EGFP SD, posthoc Tukey’ t test p=0.0054; PDE4A5catnullΔ4 NSD versus PDE4A5catnullΔ4 SD, posthoc Tukey’ t test p=0.0037). Dotted line indicates chance level performance. NSD: non-sleep deprived, SD: sleep deprived. Values represent the mean ± SEM. #p<0.01 by Tukeys t test. DOI: http://dx.doi.org/10.7554/eLife.13424.020
Figure 5—figure supplement 1. Expression of catalytically null PDE4A5 in the hippocampus: Catalytically inactive PDE4A5 without the unique N-terminal localization domain fails to prevent memory deficits associated with sleep loss. (A) PDE4A5catnull expression in hippocampal neurons did not significantly affect PDE4 activity in the hippocampus (n = 7, Student’s t test p=0.097). (B) PDE4 activity in the prefrontal cortex was not altered by expression of the catalytically inactive PDE4A5catnull in the hippocampus (n = 7–8, Student’s t test p=0.162). (C) PDE4 activity in the cerebellum was not changed by expression of the catalytically inactive PDE4A5catnull in the hippocampus (n = 7–8, Student’s t test p=0.293). (D) Expression of the catalytically inactive PDE4A5catnull in hippocampal neurons did not alter the total time spent exploring objects during training in the object-place recognition task (n = 8–10, two-way ANOVA, effect of virus F1,33 = 0.043, p=0.873). All groups show a decrease in the total object exploration time during consecutive training sessions (two-way ANOVA effect of session F2,66 = 32.777, p=0.0001). Mice expressing PDE4A5catnull had a slightly but non-significantly lower object exploration time during the first training session, and a slightly but non-significantly higher object exploration time during the last training session (interaction effect F2,66 = 4.875, p=0.011, one way ANOVAs per session, p>0.05). (E) Mice expressing PDE4A5catnull spend a similar time in the periphery of the open field as mice expressing eGFP in hippocampal neurons (n = 8, Student’s t test, p=0.292). (F) Mice were injected with pAAV9-CaMKIIα0.4-eGFP or pAAV9-CaMKIIα0.4-PDE4A5catnullΔ4-VSV into the hippocampus to drive neuronal expression of eGFP or catalytically inactive full-length PDE4A5 which lacked the N-terminal domain unique for PDE4A5 (PDE4A5catnullΔ4). A VSV-tag was included to discriminate between endogenous PDE4A5 and the truncated PDE4A5catnullΔ4. (G) PDE4A5catnullΔ4 protein levels in the hippocampus 4 weeks after viral injection. A sample blot probed with an isoform-nonspecific PDE4A antibody revealed the presence of both wild-type PDE4A5 protein and truncated PDE4A5catnullΔ4 protein. Probing the blot with an antibody for the HA-tag confirmed that the truncated protein is indeed the N-terminal lacking catalytically inactive PDE4A5catnullΔ4. Each band represents an individual animal (H) Expression of the catalytically inactive PDE4A5catnullΔ4 lacking the N-terminal domain in hippocampal neurons did not affect total object exploration time during training in the object-place recognition task (n = 7–9, two-way ANOVA effect of virus F1,29 = 0.470, p=0.498). All groups show decreased total object exploration times during consecutive training sessions (two-way ANOVA effect of session F2,58 = 13.597, p=0.0001; interaction effect F2,58 = 0.555, p=0.557). (I) Mice expressing eGFP or the N-terminal domain lacking inactive form of PDE4A5catnullΔ4 were trained in the hippocampus-dependent object-place recognition task. Sleep deprivation causes memory deficits in both eGFP and PDE4A5catnullΔ4 mice (n = 7–9; two-way ANOVA effect of sleep deprivation F1,29 = 18.131, p=0.0001; effect of virus F1,29 = 1.064, p=0.311; interaction effect F1,29 = 0.001, p=0.986; eGFP NSD versus EGFP SD, posthoc Tukey’ t test p=0.0054; PDE4A5catnullΔ4 NSD versus PDE4A5catnullΔ4 SD, posthoc Tukey’ t test p=0.0037). Dotted line indicates chance level performance. NSD: non-sleep deprived, SD: sleep deprived. Values represent the mean ± SEM. #p<0.01 by Tukeys t test. DOI: http://dx.doi.org/10.7554/eLife.13424.020CC BY · PubMed Central
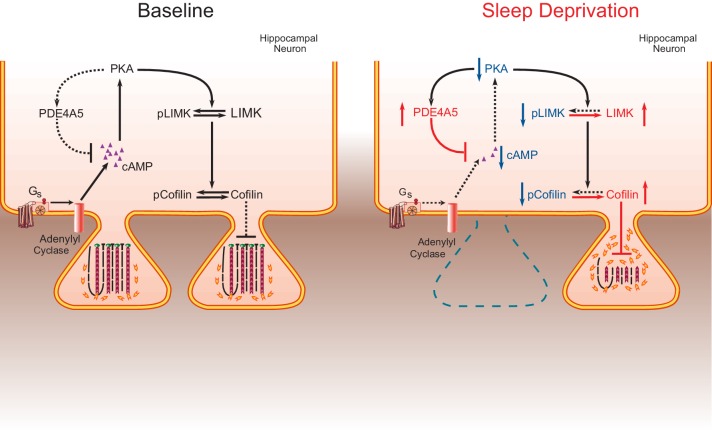
Figure 6. The impact of sleep deprivation on hippocampal spine dynamics. Sleep deprivation increases PDE4A5 protein levels that cause a reduction in cAMP levels and attenuation of the PKA-LIMK signaling pathway, which results in a reduction in the phosphorylation of cofilin. Dephosphorylated cofilin can lead to spine loss. Suppressing PDE4A5 function through viral expression of a catalytically inactive PDE4A5 prevents alterations in LIMK and cofilin signaling as well as the cognitive impairments caused by sleep deprivation. Likewise, attenuating cofilin activity through viral expression of a catalytically inactive form of cofilin prevents the loss of dendritic spines, impairments in synaptic plasticity, and memory deficits associated with sleep loss. Proteins whose function is reduced after sleep deprivation are shown in blue. Proteins whose function is promoted by sleep deprivation are shown in red. DOI: http://dx.doi.org/10.7554/eLife.13424.022
Figure 6. The impact of sleep deprivation on hippocampal spine dynamics. Sleep deprivation increases PDE4A5 protein levels that cause a reduction in cAMP levels and attenuation of the PKA-LIMK signaling pathway, which results in a reduction in the phosphorylation of cofilin. Dephosphorylated cofilin can lead to spine loss. Suppressing PDE4A5 function through viral expression of a catalytically inactive PDE4A5 prevents alterations in LIMK and cofilin signaling as well as the cognitive impairments caused by sleep deprivation. Likewise, attenuating cofilin activity through viral expression of a catalytically inactive form of cofilin prevents the loss of dendritic spines, impairments in synaptic plasticity, and memory deficits associated with sleep loss. Proteins whose function is reduced after sleep deprivation are shown in blue. Proteins whose function is promoted by sleep deprivation are shown in red. DOI: http://dx.doi.org/10.7554/eLife.13424.022CC BY · PubMed Central

Verification

Claims the paper makes

The claims and statistics of this paper haven’t been checked yet.

Run the check — free, no account needed. It reads the open-access text and checks the sources it cites.

A few free checks a day · papers already verified open instantly · results are public

Claims other papers make about this one

Each is checked against this paper’s own text: does it say what the citing paper says it does?

Self-check

Percentages, sums and reported differences re-computed from the paper’s own numbers.

The self-check needs the paper’s full text.

Citations

Cites

1 retracted

Show all 68 references

Cited by

Sorted by citations

Items 201–292 of 292

Metadata

Authors
Havekes, R., Park, A. J., Tudor, J. C., Luczak, V. G., Hansen, R. T., Ferri, S. L., Bruinenberg, V. M., Poplawski, S. G., Day, J. P., Aton, S. J., Radwańska, K., Meerlo, P., Houslay, M. D., Baillie, G. S., & Abel, T.
Affiliations
  • University of Groningen (NL)
  • New York State Psychiatric Institute (US)
  • University of Pennsylvania (US)
  • University of Glasgow (GB)
  • University of Michigan (US)
  • Instytut Biologii Doświadczalnej im. Marcelego Nenckiego (PL)
  • King's College London (GB)
Corresponding author
  • Havekes, Robbert
  • Abel, Ted
Venue
eLife
Published
2016-08-23
Volume
5
ISSN
2050-084X (ISSN-L)
OpenAlex
W2518307403
Cited by
292
References
68
Citations by year
2026: 35 · 2025: 39 · 2024: 32 · 2023: 28 · 2022: 22 · 2021: 38 · 2020: 37 · 2019: 21 · 2018: 19 · 2017: 18 · 2016: 1
FWCI
12.39
Type
journal article
Language
en
Open access
Locations
  • eLife (publishedVersion, cc-by)
  • PubMed Central (publishedVersion, cc-by)
  • PubMed (publishedVersion)
  • University of Groningen research database (University of Groningen / Centre for Information Technology) (publishedVersion, cc-by)
  • ENLIGHTEN (Jurnal Bimbingan dan Konseling Islam) (acceptedVersion)
  • DOAJ (DOAJ: Directory of Open Access Journals) (submittedVersion, cc-by-sa)
  • Research Portal (King's College London) (submittedVersion, cc-by)
  • University of Groningen research database (University of Groningen / Centre for Information Technology) (submittedVersion, cc-by)
Funders
  • Nederlandse Organisatie voor Wetenschappelijk Onderzoek (postdoctoral fellowship 825.07.029)
  • University of Pennsylvania (UPENN rsearch foundation grant)
  • National Institutes of Health (postdoctoral fellowship, 5K12GM081529, postdoctoral fellowship, T32 NS077413, 1RO1MH086415, RO1AG017628)
  • European Commission (FP7-PEOPLE-2009-RG-Alco_CaMK)
  • National Science Centre (Harmonia 2013/08/m/NZ3/00861 Grant)
  • Medical Research Council (Grant MR/J007412/1)
Topics
  • Life Sciences › Neuroscience › Cognitive Neuroscience › Sleep and Wakefulness Research
  • Life Sciences › Neuroscience › Cognitive Neuroscience › Memory and Neural Mechanisms
  • Life Sciences › Neuroscience › Cellular and Molecular Neuroscience › Neuroscience and Neuropharmacology Research
Keywords
sleep deprivation, memory impairment, hippocampal CA1, dendritic spines, cofilin, cAMP signaling, LIM kinase, synaptic plasticity, long-term memory, dendritic morphology, recovery sleep
MeSH terms
Animals, Memory Disorders, Neurons, Sleep Deprivation, Dendritic Spines, Actin Depolymerizing Factors, Mice, Cyclic Nucleotide Phosphodiesterases, Type 4, CA1 Region, Hippocampal

About these checks

Registry, retraction, Cites and statistics results are computed, not judged, with one exception: a printed reference that no index lists is read once by a model before it counts as a citation error. Claims are extracted by a model and kept only when their quote appears verbatim in the text; each cited source is then checked, with a model’s help, for whether it says what the claim relies on. Those verdicts can be wrong — read the claim’s quote and the cited source before relying on one.

Statistics and arithmetic are recomputed, not judged.

Confidence bands are shown only for fields calibrated on our annotated test set. None is calibrated yet, so no band is shown.

What counts as a claim ›How we measure confidence ›How we check this ›

Are you an author, or do you see a problem with this page? Request a review