Student or educator? Sign up with your school email and get 6 months of Pro free.
Cited by 16Ion channel regulation and functionIon Channels and ReceptorsBiochemical Analysis and Sensing Techniques

The DOI matches its Crossref record; 51 of the 51 references it cites were found in a registry or an index.

Zinc activation of OTOP proton channels identifies structural elements of the gating apparatus

Open access

Published version of a preprint

Abstract

Otopetrin proteins (OTOPs) form proton-selective ion channels that are expressed in diverse cell types where they mediate detection of acids or regulation of pH. In vertebrates there are three family members: OTOP1 is required for formation of otoconia in the vestibular system and it forms the receptor for sour taste, while the functions of OTOP2 and OTOP3 are not yet known. Importantly, the gating mechanisms of any of the OTOP channels are not well understood. Here, we show that zinc (Zn 2+) , as well as other transition metals including copper (Cu 2+ ), potently activates murine OTOP3 (mOTOP3). Zn 2+ pre-exposure increases the magnitude of mOTOP3 currents to a subsequent acid stimulus by as much as 10-fold. In contrast, mOTOP2 currents are insensitive to activation by Zn 2+ . Swapping the extracellular tm 11–12 linker between mOTOP3 and mOTOP2 was sufficient to eliminate Zn 2+ activation of mOTOP3 and confer Zn 2+ activation on mOTOP2. Mutation to alanine of H531 and E535 within the tm 11–12 linker and H234 and E238 within the 5–6 linker reduced or eliminated activation of mOTOP3 by Zn 2+ , indicating that these residues likely contribute to the Zn 2+ activating site. Kinetic modeling of the data is consistent with Zn 2+ stabilizing the opn2+en state of the channel, competing with H + for activation of the channels. These results establish the tm 11–12 and tm 5–6 linkers as part of the gating apparatus of OTOP channels and a target for drug discovery. Zn 2+ is an essential micronutrient and its activation of OTOP channels will undoubtedly have important physiological sequelae.

Overview

The claims and statistics of this paper haven’t been checked yet.

Run the check — free, no account needed. It reads the open-access text and checks the sources it cites.

A few free checks a day · papers already verified open instantly · results are public

Integrity signals

Registry

Crossref · 10.7554/elife.85317

Cites

51 of 51 references verified0 citation errors · 0 not checkable

Statistics

Figures

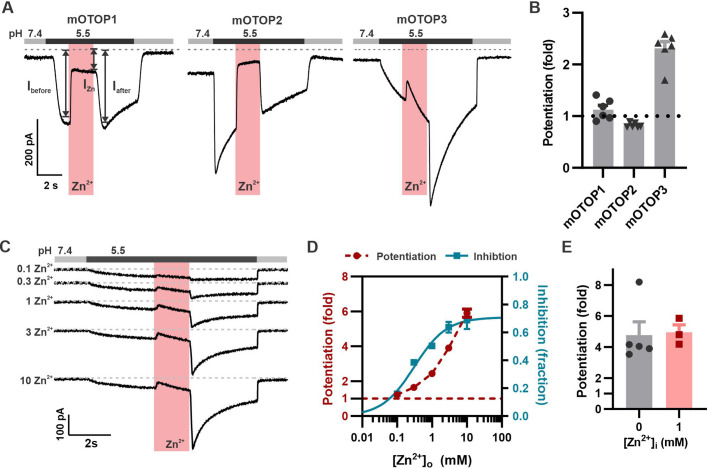
Figure 1. Zn2+ blocks and potentiates mOTOP3 currents. (A) Representative traces show Zn2+ both inhibits and potentiates mOTOP3 currents. Proton currents were elicited in HEK293 cells expressing each of the three mOTOP channels in response to lowering the extracellular pH to 5.5 in the absence of extracellular Na+ as indicated. Zn2+ (pink bar, 1 mM) inhibits currents through all three channels, but only mOTOP3 currents are potentiated following Zn2+ removal. Vm was held at –80 mV. (B) Average and all points data for experiments as in (A) showing fold potentiation as measured by comparing the current magnitude before and after Zn2+ application (arrows shown in A) .(C) Zn2+ applied at varying concentrations (pink bar, concentration indicated in mM) produces a dose-dependent inhibition and potentiation of mOTOP3 currents. (D) Average data from experiments in (C) show the dose dependence of potentiation and inhibition (n=4 for Zn2+ potentiation, n=6 for Zn2+ inhibition). The dose dependence of Zn2+ inhibition was fit with a Hill equation, with an IC50=0.31 mM, and Hill coefficient = 0.94. (E) Average potentiation of mOTOP3 currents in response to 1 mM extracellular Zn2+ with (gray) or without (pink) 1 mM Zn2+ loaded in the pipette. There was no difference between the two conditions (Student’s t-test, p=0.88).
Figure 1. Zn2+ blocks and potentiates mOTOP3 currents. (A) Representative traces show Zn2+ both inhibits and potentiates mOTOP3 currents. Proton currents were elicited in HEK293 cells expressing each of the three mOTOP channels in response to lowering the extracellular pH to 5.5 in the absence of extracellular Na+ as indicated. Zn2+ (pink bar, 1 mM) inhibits currents through all three channels, but only mOTOP3 currents are potentiated following Zn2+ removal. Vm was held at –80 mV. (B) Average and all points data for experiments as in (A) showing fold potentiation as measured by comparing the current magnitude before and after Zn2+ application (arrows shown in A) .(C) Zn2+ applied at varying concentrations (pink bar, concentration indicated in mM) produces a dose-dependent inhibition and potentiation of mOTOP3 currents. (D) Average data from experiments in (C) show the dose dependence of potentiation and inhibition (n=4 for Zn2+ potentiation, n=6 for Zn2+ inhibition). The dose dependence of Zn2+ inhibition was fit with a Hill equation, with an IC50=0.31 mM, and Hill coefficient = 0.94. (E) Average potentiation of mOTOP3 currents in response to 1 mM extracellular Zn2+ with (gray) or without (pink) 1 mM Zn2+ loaded in the pipette. There was no difference between the two conditions (Student’s t-test, p=0.88).CC BY · PubMed Central
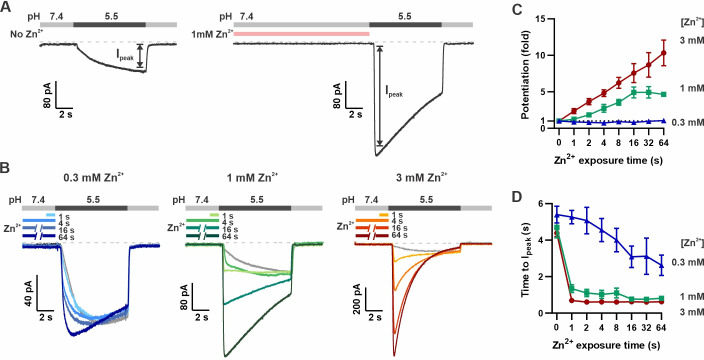
Figure 2. Pre-exposure to Zn2+ potentiates mOTOP3 currents in a dose- and time-dependent manner. (A) Solution exchange protocol designed to measure effects of Zn2+ on gating of OTOP currents without confounds due to its inhibitory effects. Vm was held at –80 mV. In this example, currents were elicited to a pH 5.5 stimulus without pre-exposure to Zn2+ and then following a 16 s exposure to 1 mM Zn2+. (B) Representative traces show mOTOP3 currents elicited in response to pH 5.5 stimulus with pre-exposure to 0.3 mM (blue), 1 mM (green), and 3 mM (orange/red) Zn2+ for durations from 1 to 64 s as indicated. (C, D) The fold potentiation (C) and time to Ipeak (D) as a function of Zn2+ pre-exposure time from experiments as in (B) (n=5–7). Fold potentiation was measured as the ratio of the current evoked to the pH 5.5 stimulus after Zn2+ to the control response in the absence of Zn2+. Data are plotted as mean ± s.e.m.
Figure 2. Pre-exposure to Zn2+ potentiates mOTOP3 currents in a dose- and time-dependent manner. (A) Solution exchange protocol designed to measure effects of Zn2+ on gating of OTOP currents without confounds due to its inhibitory effects. Vm was held at –80 mV. In this example, currents were elicited to a pH 5.5 stimulus without pre-exposure to Zn2+ and then following a 16 s exposure to 1 mM Zn2+. (B) Representative traces show mOTOP3 currents elicited in response to pH 5.5 stimulus with pre-exposure to 0.3 mM (blue), 1 mM (green), and 3 mM (orange/red) Zn2+ for durations from 1 to 64 s as indicated. (C, D) The fold potentiation (C) and time to Ipeak (D) as a function of Zn2+ pre-exposure time from experiments as in (B) (n=5–7). Fold potentiation was measured as the ratio of the current evoked to the pH 5.5 stimulus after Zn2+ to the control response in the absence of Zn2+. Data are plotted as mean ± s.e.m.CC BY · PubMed Central
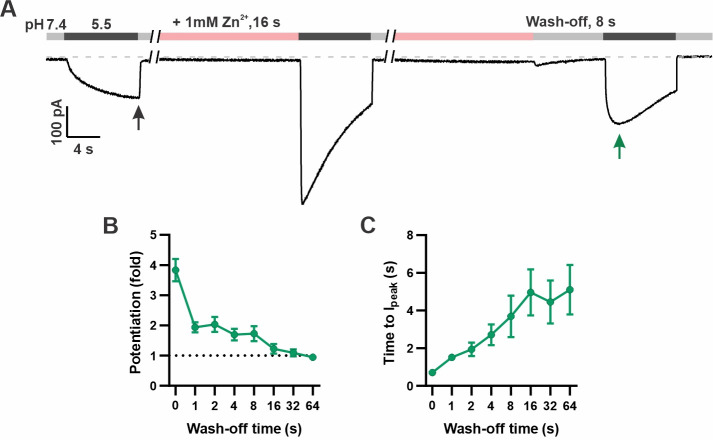
Figure 3. Time dependence of the recovery of mOTOP3 currents from Zn2+ pre-potentiation. (A) Solution exchange protocol designed to measure the recovery of mOTOP3 currents following exposure to Zn2+. In this example, the cell expressing mOTOP3 was first exposed to 1 mM Zn2+ for 16 s which was followed by an 8 s wash-off phase in pH 7.4 solution before currents were elicited in response to the pH 5.5 solution. (B, C) The fold potentiation (B) and time to Ipeak (C) as a function of Zn2+ wash-off time from experiments as in (A) (n=4–6). Data are plotted as mean ± s.e.m.
Figure 3. Time dependence of the recovery of mOTOP3 currents from Zn2+ pre-potentiation. (A) Solution exchange protocol designed to measure the recovery of mOTOP3 currents following exposure to Zn2+. In this example, the cell expressing mOTOP3 was first exposed to 1 mM Zn2+ for 16 s which was followed by an 8 s wash-off phase in pH 7.4 solution before currents were elicited in response to the pH 5.5 solution. (B, C) The fold potentiation (B) and time to Ipeak (C) as a function of Zn2+ wash-off time from experiments as in (A) (n=4–6). Data are plotted as mean ± s.e.m.CC BY · PubMed Central
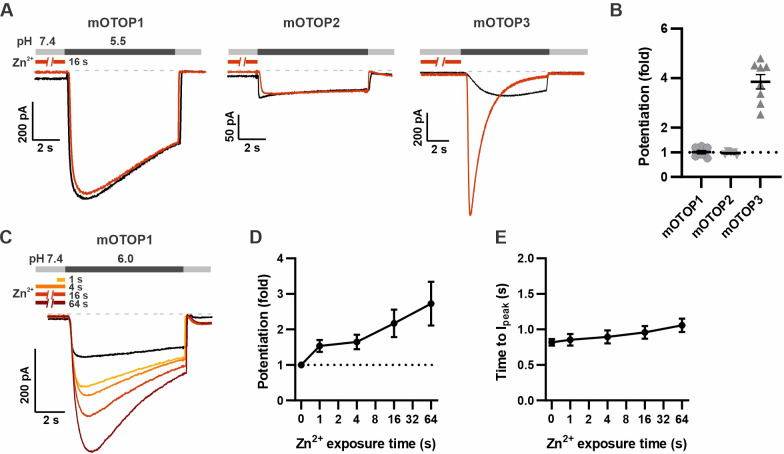
Figure 4. mOTOP1 is potentiated by Zn2+ when activated by a mild acid stimulus. (A) Proton currents recorded from HEK293 cells expressing each of the three mOTOP channels as indicated, in response to pH 5.5 with (red) or without (black) Zn2+ pre-exposure. Vm was held at –80 mV. The cells were exposed to 1 mM Zn2+ for 16 s prior to pH 5.5 solutions. (B) Average and all points data from experiments as in (A) showing the fold potentiation in response to 1 mM Zn2+ for 16 s. (C) Representative traces showing mOTOP1 currents evoked in response to a pH 6.0 stimulus before and after exposure to Zn2+ for varying times as indicated. (D, E) The fold potentiation (C) and time to Ipeak (D) as a function of Zn2+ pre-exposure time from experiments as in (C) (n=5). Data are plotted as mean ± s.e.m.
Figure 4. mOTOP1 is potentiated by Zn2+ when activated by a mild acid stimulus. (A) Proton currents recorded from HEK293 cells expressing each of the three mOTOP channels as indicated, in response to pH 5.5 with (red) or without (black) Zn2+ pre-exposure. Vm was held at –80 mV. The cells were exposed to 1 mM Zn2+ for 16 s prior to pH 5.5 solutions. (B) Average and all points data from experiments as in (A) showing the fold potentiation in response to 1 mM Zn2+ for 16 s. (C) Representative traces showing mOTOP1 currents evoked in response to a pH 6.0 stimulus before and after exposure to Zn2+ for varying times as indicated. (D, E) The fold potentiation (C) and time to Ipeak (D) as a function of Zn2+ pre-exposure time from experiments as in (C) (n=5). Data are plotted as mean ± s.e.m.CC BY · PubMed Central
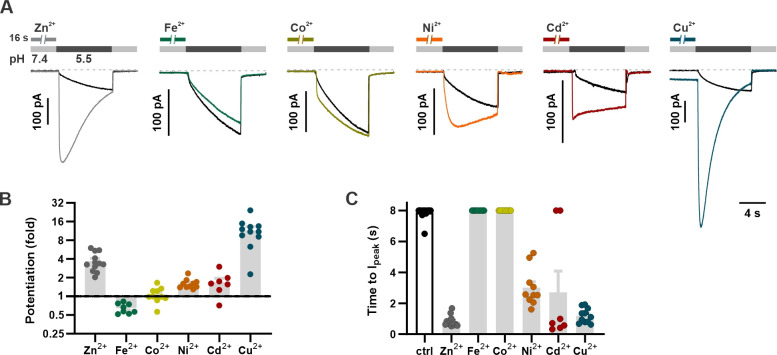
Figure 5. Divalent transition metal ions also potentiate mOTOP3. (A) Proton currents in response to a pH 5.5 stimulus following exposure (1 mM, 16 s) to various d-block transition metals recorded from HEK293 cells expressing wildtype mOTOP3. Vm was held at –80 mV. Black trace is the control from the same experiment (cell). (B) Average (mean ± s.e.m.) and all points data showing the fold potentiation measured from experiments as in (A). (C) Average (mean ± s.e.m.) and all points data for latency to Ipeak, measured from experiments as in (A). The latency to peak in (C) was scored as 8 s when peak magnitudes were not reached before 8 s.
Figure 5. Divalent transition metal ions also potentiate mOTOP3. (A) Proton currents in response to a pH 5.5 stimulus following exposure (1 mM, 16 s) to various d-block transition metals recorded from HEK293 cells expressing wildtype mOTOP3. Vm was held at –80 mV. Black trace is the control from the same experiment (cell). (B) Average (mean ± s.e.m.) and all points data showing the fold potentiation measured from experiments as in (A). (C) Average (mean ± s.e.m.) and all points data for latency to Ipeak, measured from experiments as in (A). The latency to peak in (C) was scored as 8 s when peak magnitudes were not reached before 8 s.CC BY · PubMed Central
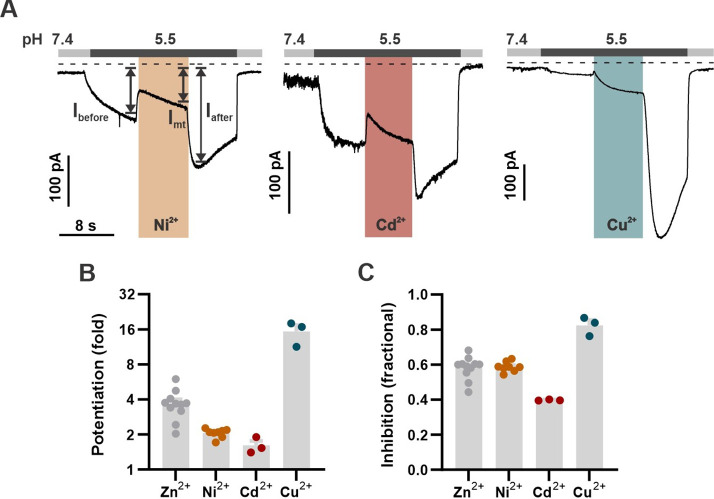
Figure 5—figure supplement 1. Divalent transition metals also inhibit mOTOP3. (A) Representative traces show Ni2+, Cd2+, and Cu2+ all inhibit mOTOP3 currents. Proton currents were elicited in HEK293 cells expressing wildtype mOTOP3 in response to lowering the extracellular pH to 5.5. Ni2+, Cd2+, and Cu2+ (orange, red, and blue bars, 1 mM) was applied during the pH 5.5 stimulus. Vm was held at –80 mV. (B) Average (mean ± s.e.m.) and all points data showing the fold potentiation measured from experiments as in (A). (C) Average (mean ± s.e.m.) and all points data showing fractional inhibition of the various metals, measured from experiments as in (A).
Figure 5—figure supplement 1. Divalent transition metals also inhibit mOTOP3. (A) Representative traces show Ni2+, Cd2+, and Cu2+ all inhibit mOTOP3 currents. Proton currents were elicited in HEK293 cells expressing wildtype mOTOP3 in response to lowering the extracellular pH to 5.5. Ni2+, Cd2+, and Cu2+ (orange, red, and blue bars, 1 mM) was applied during the pH 5.5 stimulus. Vm was held at –80 mV. (B) Average (mean ± s.e.m.) and all points data showing the fold potentiation measured from experiments as in (A). (C) Average (mean ± s.e.m.) and all points data showing fractional inhibition of the various metals, measured from experiments as in (A).CC BY · PubMed Central
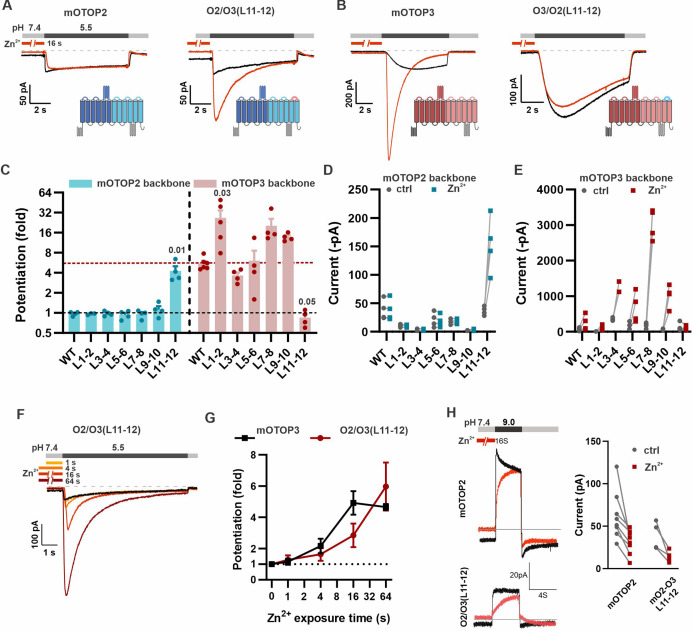
Figure 6. The tm 11–12 linker is both necessary and sufficient for Zn2+ potentiation. (A, B) Proton currents in response to a pH 5.5 stimulus with (red) or without (black) Zn2+ pre-exposure (1 mM, 16 s) recorded from HEK293 cells expressing either wildtype (WT) OTOP channels or chimeric channels as indicated. Vm was held at –80 mV. The WT traces are the same set as shown in Figure 3A. (C) Average data showing the fold potentiation after Zn2+ pre-exposure (1 mM, 16 s) measured from experiments as in (A) and (B). Bars are mean ± s.e.m. mOTOP2 and its chimeras are shown in blue, mOTOP3 and its chimeras are shown in red. Statistical significance determined with an ANOVA using Kruskal-Wallis (non-parametric) statistics. P values are shown where less than 0.05. (D, E) Same data as in (C) plotted to show current magnitudes before and after Zn2+ for WT channels and each of the chimeras. (F) Representative traces of O2/O3(L11-12) currents in response to pH 5.5 after pre-exposure to Zn2+ for varying times as indicated. (G) Average data for experiments as in (F) showing the time dependence of the potentiation by Zn2+ for the O2/O3(L11-12) chimera as compared with WT (n=4–5). Data of the WT mOTOP3 are the same set as shown in Figure 2C and D. (H) Left panel: response of mOTOP2 to alkaline stimulus (pH 9.0) with (red) and without (black) Zn2+ pre-exposure (1 mM, 16 s). Right panel: magnitude of currents at pH 9 for WT and mutant channels with and without Zn2+ pre-exposure. Currents were smaller after Zn2+ pre-exposure for both.
Figure 6. The tm 11–12 linker is both necessary and sufficient for Zn2+ potentiation. (A, B) Proton currents in response to a pH 5.5 stimulus with (red) or without (black) Zn2+ pre-exposure (1 mM, 16 s) recorded from HEK293 cells expressing either wildtype (WT) OTOP channels or chimeric channels as indicated. Vm was held at –80 mV. The WT traces are the same set as shown in Figure 3A. (C) Average data showing the fold potentiation after Zn2+ pre-exposure (1 mM, 16 s) measured from experiments as in (A) and (B). Bars are mean ± s.e.m. mOTOP2 and its chimeras are shown in blue, mOTOP3 and its chimeras are shown in red. Statistical significance determined with an ANOVA using Kruskal-Wallis (non-parametric) statistics. P values are shown where less than 0.05. (D, E) Same data as in (C) plotted to show current magnitudes before and after Zn2+ for WT channels and each of the chimeras. (F) Representative traces of O2/O3(L11-12) currents in response to pH 5.5 after pre-exposure to Zn2+ for varying times as indicated. (G) Average data for experiments as in (F) showing the time dependence of the potentiation by Zn2+ for the O2/O3(L11-12) chimera as compared with WT (n=4–5). Data of the WT mOTOP3 are the same set as shown in Figure 2C and D. (H) Left panel: response of mOTOP2 to alkaline stimulus (pH 9.0) with (red) and without (black) Zn2+ pre-exposure (1 mM, 16 s). Right panel: magnitude of currents at pH 9 for WT and mutant channels with and without Zn2+ pre-exposure. Currents were smaller after Zn2+ pre-exposure for both.CC BY · PubMed Central
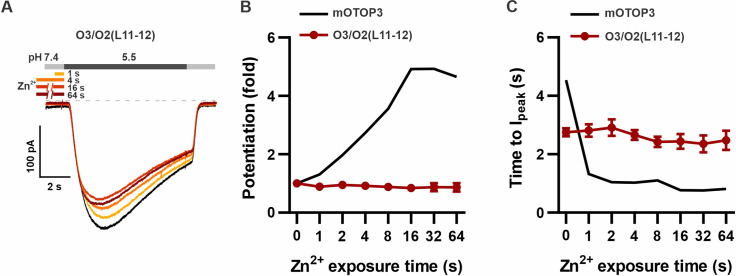
Figure 6—figure supplement 1. O3/O2(L11-12) chimera is completely insensitive to potentiation by Zn2+. (A) Representative traces show O3/O2(L11-12) currents in the absence of Zn2+ (black) and with pre-exposure times as indicated. (B,C) Average data for fold potentiation (B) and time to peak (C) of O3/O2L(11-12) currents as in (A), or mOTOP3 (data for the wildtype mOTOP3 are the same as shown in Figure 2C and D) (n=4–5).
Figure 6—figure supplement 1. O3/O2(L11-12) chimera is completely insensitive to potentiation by Zn2+. (A) Representative traces show O3/O2(L11-12) currents in the absence of Zn2+ (black) and with pre-exposure times as indicated. (B,C) Average data for fold potentiation (B) and time to peak (C) of O3/O2L(11-12) currents as in (A), or mOTOP3 (data for the wildtype mOTOP3 are the same as shown in Figure 2C and D) (n=4–5).CC BY · PubMed Central
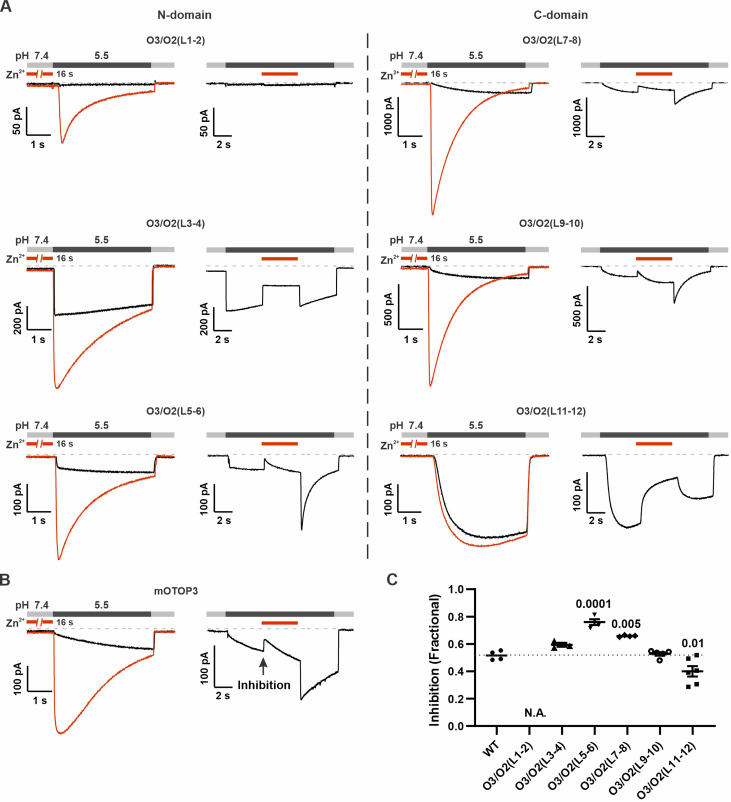
Figure 7. Inhibition of mOTOP3 by Zn2+ is retained in chimeric channels. (A) Zn2+ sensitivity of chimeric mOTOP3-mOTOP2 channels as measured with a pre-exposure protocol (left panel in each) or by adding 1 mM Zn2+ to the pH 5.5 stimulus (blocking protocol; right panel in each). Chimeras containing mOTOP2 N-domain and C-domain linkers are shown in the left column and right columns, respectively. Data from pre-exposure experiments is also presented in Figure 6, and here is shown for comparison to results with the blocking protocol. (B) Representative traces of wildtype mOTOP3 currents in response to the same protocols as in (A). The arrow indicates the time point in this trace where inhibition by Zn2+ was measured, by comparison with the current magnitude before adding Zn2+. (C) Average (mean ± s.e.m.) and all points data showing fractional inhibition of currents by 1 mM Zn2+ measured from wildtype mOTOP3 and its chimeras. All channels were similarly inhibited by 1 mM Zn2+. Significance determined by ANOVA with Dunnett’s test corrected for multiple comparisons.
Figure 7. Inhibition of mOTOP3 by Zn2+ is retained in chimeric channels. (A) Zn2+ sensitivity of chimeric mOTOP3-mOTOP2 channels as measured with a pre-exposure protocol (left panel in each) or by adding 1 mM Zn2+ to the pH 5.5 stimulus (blocking protocol; right panel in each). Chimeras containing mOTOP2 N-domain and C-domain linkers are shown in the left column and right columns, respectively. Data from pre-exposure experiments is also presented in Figure 6, and here is shown for comparison to results with the blocking protocol. (B) Representative traces of wildtype mOTOP3 currents in response to the same protocols as in (A). The arrow indicates the time point in this trace where inhibition by Zn2+ was measured, by comparison with the current magnitude before adding Zn2+. (C) Average (mean ± s.e.m.) and all points data showing fractional inhibition of currents by 1 mM Zn2+ measured from wildtype mOTOP3 and its chimeras. All channels were similarly inhibited by 1 mM Zn2+. Significance determined by ANOVA with Dunnett’s test corrected for multiple comparisons.CC BY · PubMed Central
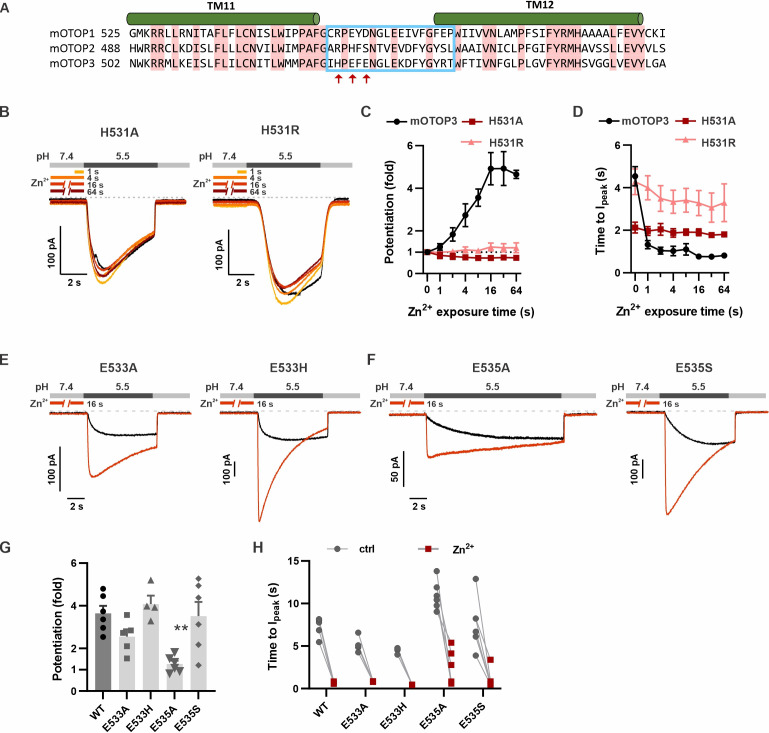
Figure 8. H531 in mOTOP3 L11–12 is essential for Zn2+ potentiation. (A) Sequence alignment of three mOTOP channels. The residues that were exchanged between mOTOP2 and mOTOP3 in the L11–12 chimeras is indicated with a blue box. Residues that differed between the two channels and that were tested are indicated by red arrows. (B) Representative traces of mOTOP3_H531A and H531R currents in response to pH 5.5 after pre-exposure to Zn2+ for varying times as indicated. (C, D) Average data for fold potentiation (C) and latency to Ipeak (D) measured from experiments as in (B), plotted as a function of pre-exposure time to Zn2+ (n=3–7). Data from wildtype (WT) mOTOP3 are the same set as shown in Figure 2C and D. (E, F) Responses of mOTOP3 mutants as indicated in response to pH 5.5 with (red) or without (black) Zn2+ pre-exposure (1 mM, 16 s). Vm was held at –80 mV. (G) Average data for fold potentiation measured from experiments as in (E and F). Statistical significance compared with WT determined using the Kruskal-Wallis (non-parametric) test corrected for multiple comparison. (H) Latency to peak currents of WT mOTOP3 or mutant currents, measured from experiments as in (E and F). Each set of points represents a separate cell.
Figure 8. H531 in mOTOP3 L11–12 is essential for Zn2+ potentiation. (A) Sequence alignment of three mOTOP channels. The residues that were exchanged between mOTOP2 and mOTOP3 in the L11–12 chimeras is indicated with a blue box. Residues that differed between the two channels and that were tested are indicated by red arrows. (B) Representative traces of mOTOP3_H531A and H531R currents in response to pH 5.5 after pre-exposure to Zn2+ for varying times as indicated. (C, D) Average data for fold potentiation (C) and latency to Ipeak (D) measured from experiments as in (B), plotted as a function of pre-exposure time to Zn2+ (n=3–7). Data from wildtype (WT) mOTOP3 are the same set as shown in Figure 2C and D. (E, F) Responses of mOTOP3 mutants as indicated in response to pH 5.5 with (red) or without (black) Zn2+ pre-exposure (1 mM, 16 s). Vm was held at –80 mV. (G) Average data for fold potentiation measured from experiments as in (E and F). Statistical significance compared with WT determined using the Kruskal-Wallis (non-parametric) test corrected for multiple comparison. (H) Latency to peak currents of WT mOTOP3 or mutant currents, measured from experiments as in (E and F). Each set of points represents a separate cell.CC BY · PubMed Central
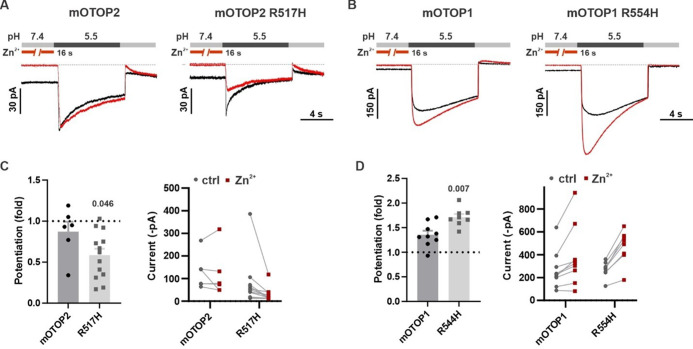
Figure 8—figure supplement 1. Introduction of histidine into mOTOP1 partially confers sensitivity to potentiation by Zn2+. (A,B) Representative traces of OTOP2 and OTOP2_R517H and OTOP1 and OTOP1_R554H currents in response to pH 5.5 with (red) and without (black) pre-exposure to Zn2+ (1 mM, 16 s). Vm was held at –80 mV. (C,D). Average (mean ± s.e.m.) and all points data showing the fold potentiation after pre-exposure to Zn2+ (1 mM, 16 s) and current magnitudes before and after pre-exposure to Zn2+ (1 mM, 16 s) measured from experiments as in (A,B). Statistical significance compared with wildtype (WT) determined using the Mann-Whitney (non-parametric) test.
Figure 8—figure supplement 1. Introduction of histidine into mOTOP1 partially confers sensitivity to potentiation by Zn2+. (A,B) Representative traces of OTOP2 and OTOP2_R517H and OTOP1 and OTOP1_R554H currents in response to pH 5.5 with (red) and without (black) pre-exposure to Zn2+ (1 mM, 16 s). Vm was held at –80 mV. (C,D). Average (mean ± s.e.m.) and all points data showing the fold potentiation after pre-exposure to Zn2+ (1 mM, 16 s) and current magnitudes before and after pre-exposure to Zn2+ (1 mM, 16 s) measured from experiments as in (A,B). Statistical significance compared with wildtype (WT) determined using the Mann-Whitney (non-parametric) test.CC BY · PubMed Central
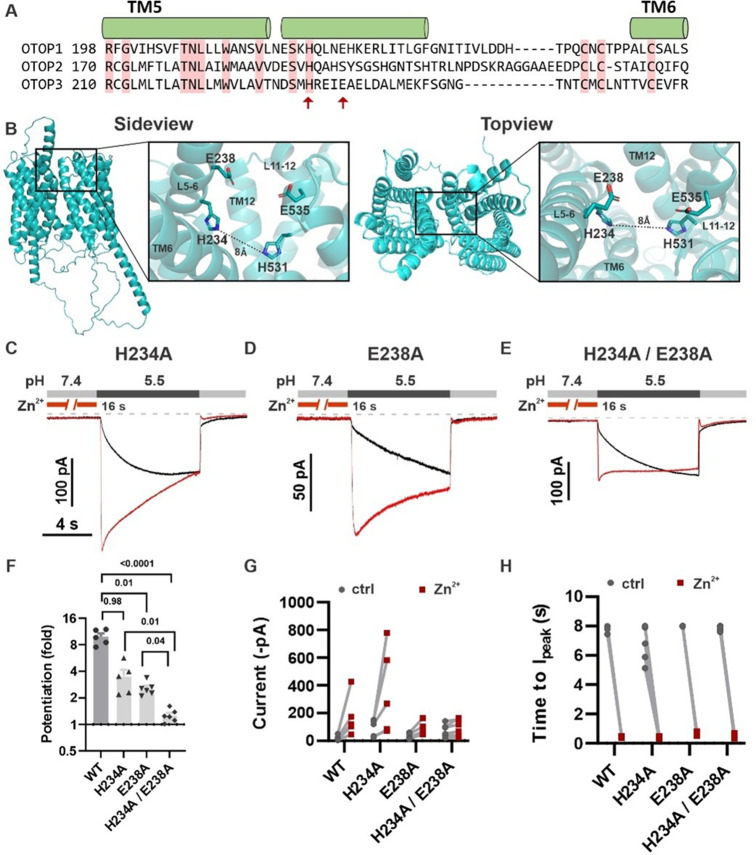
Figure 9. H234 and E238 in transmembrane domain 5 contribute to Zn2+ potentiation of mOTOP3. (A) Sequence alignment of the three mOTOP channels. Alpha helices shown above the sequence are based on the AlphaFold prediction of the structure of mOTOP3. Red arrows indicate residues neutralized to alanine in subsequent experiments. (B) Images generated using the AlphaFold predicted structure of mOTOP3. Left panel shows a sideview and right panel shows a topview of mOTOP3. Each zoom-in highlights the predicted Zn2+ potentiation binding site. (C,D,E) Representative traces of mOTOP3 H234A, E238A, and a double mutation of H234A/E238A in response to lowering the extracellular pH to 5.5 after (red) and without (black) pre-exposure to Zn2+ (1 mM, 16 s). Vm was held at –80 mV. (F) Average (mean ± s.e.m.) and all points data showing the fold potentiation measured from experiments as in (C,D,E). Statistical significance determined using an ANOVA with the Kruskal-Wallis (non-parametric) test. (G,H) Same data as in (F) plotted to show current magnitudes before and after Zn2+ (G) and the time to Ipeak with and without pre-exposure to Zn2+ (H) from experiments in (C,D,E).
Figure 9. H234 and E238 in transmembrane domain 5 contribute to Zn2+ potentiation of mOTOP3. (A) Sequence alignment of the three mOTOP channels. Alpha helices shown above the sequence are based on the AlphaFold prediction of the structure of mOTOP3. Red arrows indicate residues neutralized to alanine in subsequent experiments. (B) Images generated using the AlphaFold predicted structure of mOTOP3. Left panel shows a sideview and right panel shows a topview of mOTOP3. Each zoom-in highlights the predicted Zn2+ potentiation binding site. (C,D,E) Representative traces of mOTOP3 H234A, E238A, and a double mutation of H234A/E238A in response to lowering the extracellular pH to 5.5 after (red) and without (black) pre-exposure to Zn2+ (1 mM, 16 s). Vm was held at –80 mV. (F) Average (mean ± s.e.m.) and all points data showing the fold potentiation measured from experiments as in (C,D,E). Statistical significance determined using an ANOVA with the Kruskal-Wallis (non-parametric) test. (G,H) Same data as in (F) plotted to show current magnitudes before and after Zn2+ (G) and the time to Ipeak with and without pre-exposure to Zn2+ (H) from experiments in (C,D,E).CC BY · PubMed Central
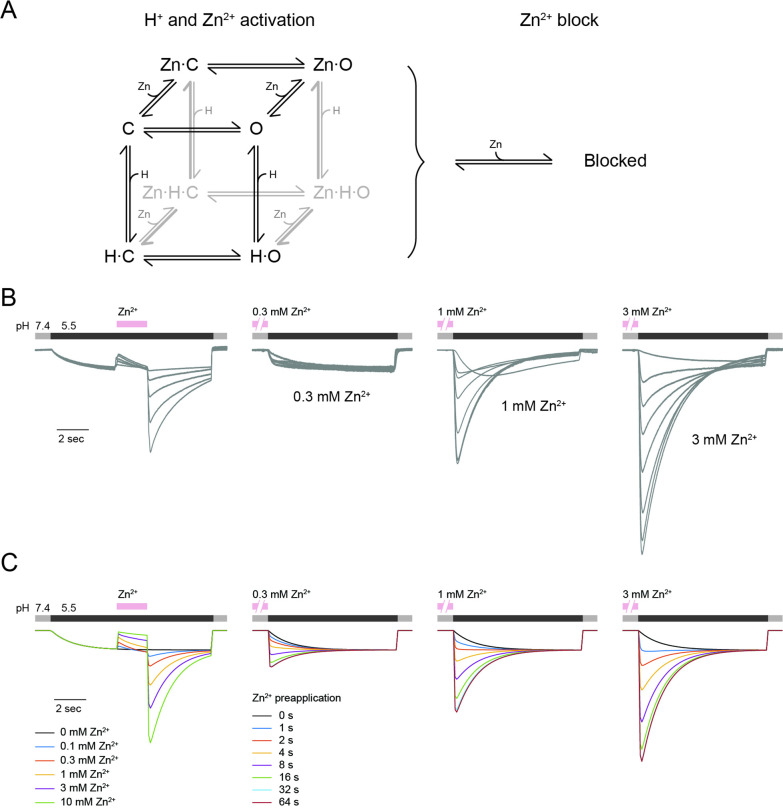
Figure 10. mOTOP3 kinetic model for Zn2+ potentiation and block. (A) Kinetic model for activation of mOTOP3 by H+ and Zn2+. The channel moves from a closed state (C) upon binding H+ or Zn2+ to an open state (Zn-O, H–O) in which it permeates protons. The doubly bound Zn-H-O and Zn-H-C states are disfavored energetically. A separate site binds Zn2+ and inhibits channel permeation, independently of the gating state. See methods for a more detailed description of the model. (B) Example mOTOP3 current recordings from Figure 1C and Figure 2B. Each set of recordings was from a different cell. (C) Simulated currents for the model under the same protocols as in (B). Model parameters were adjusted manually and were the same for all traces. The model replicates the rebound seen upon addition of Zn2+ at pH 5.5, and the potentiation seen with pre-exposure to Zn2+ at pH 7.4.
Figure 10. mOTOP3 kinetic model for Zn2+ potentiation and block. (A) Kinetic model for activation of mOTOP3 by H+ and Zn2+. The channel moves from a closed state (C) upon binding H+ or Zn2+ to an open state (Zn-O, H–O) in which it permeates protons. The doubly bound Zn-H-O and Zn-H-C states are disfavored energetically. A separate site binds Zn2+ and inhibits channel permeation, independently of the gating state. See methods for a more detailed description of the model. (B) Example mOTOP3 current recordings from Figure 1C and Figure 2B. Each set of recordings was from a different cell. (C) Simulated currents for the model under the same protocols as in (B). Model parameters were adjusted manually and were the same for all traces. The model replicates the rebound seen upon addition of Zn2+ at pH 5.5, and the potentiation seen with pre-exposure to Zn2+ at pH 7.4.CC BY · PubMed Central
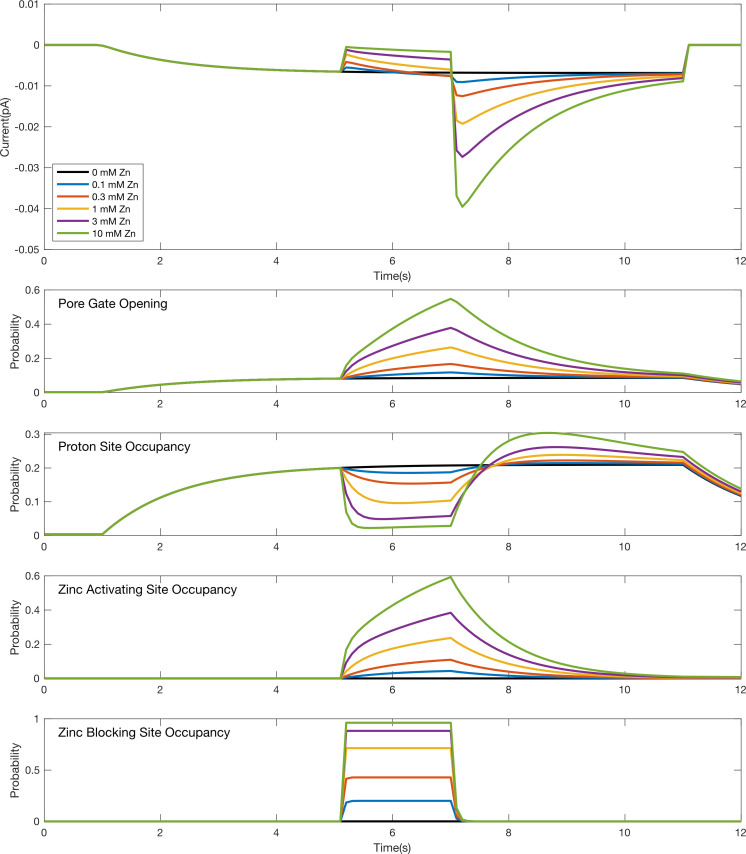
Figure 10—figure supplement 1. Simulation time course for individual gating and binding domains in response to a pulse of Zn2+ during an acid stimulus. Simulated responses to the stimulus protocol shown in Figure 1C for the model in Figure 9A. The top plot shows simulated current responses for various concentrations of Zn2+ (same as depicted in the leftmost plot in Figure 9C). The other plots are the time courses for the probabilities of individual domains to be activated (i.e., opening of the pore gate or binding at a proton or Zn2+ site) during the simulation. The reduction in proton site occupancy when the Zn2+ activating site is occupied reflects their competition as modeled by an energetic destabilization of states with both sites occupied.
Figure 10—figure supplement 1. Simulation time course for individual gating and binding domains in response to a pulse of Zn2+ during an acid stimulus. Simulated responses to the stimulus protocol shown in Figure 1C for the model in Figure 9A. The top plot shows simulated current responses for various concentrations of Zn2+ (same as depicted in the leftmost plot in Figure 9C). The other plots are the time courses for the probabilities of individual domains to be activated (i.e., opening of the pore gate or binding at a proton or Zn2+ site) during the simulation. The reduction in proton site occupancy when the Zn2+ activating site is occupied reflects their competition as modeled by an energetic destabilization of states with both sites occupied.CC BY · PubMed Central
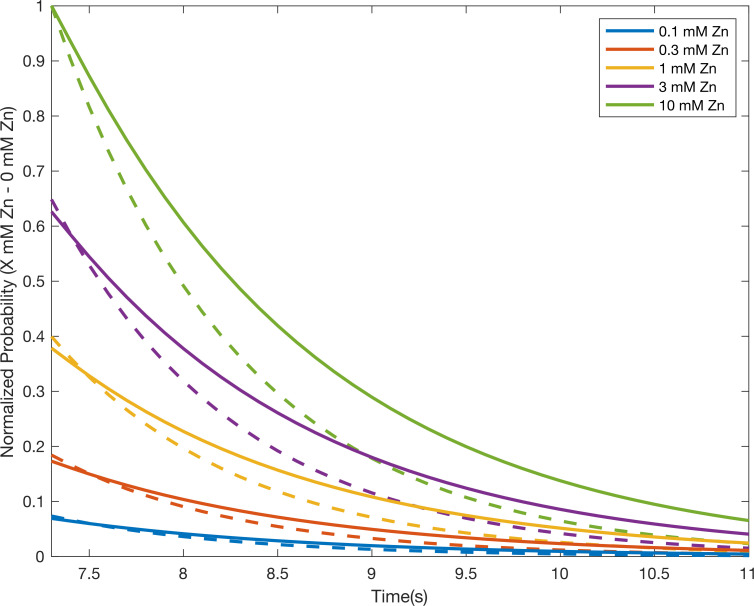
Figure 10—figure supplement 2. Simulated decay of current potentiation largely reflects Zn2+ unbinding from the activating site. Comparison of the simulated time courses for the model in Figure 9 to be conducting (i.e. pore is both open and unblocked; solid lines) and/or the Zn2+ activating site to be occupied (dashed lines) during the decay of the Zn2+ potentiation response in the stimulus protocol described in Figure 1C and Figure 10—figure supplement 1. The normalized probabilities following pulses of the indicated concentrations of Zn2+ were calculated by first subtracting the probability time course in the absence of a Zn2+ pulse and then normalizing to the maximal peak response with 10 mM Zn2+. The current decay largely tracks the Zn2+ unbinding time course from the activating site across concentrations, albeit with a slight lag. This lag reflects the subsequent time for the pore gate to close once the stabilizing effect of Zn2+ at the activating site is removed.
Figure 10—figure supplement 2. Simulated decay of current potentiation largely reflects Zn2+ unbinding from the activating site. Comparison of the simulated time courses for the model in Figure 9 to be conducting (i.e. pore is both open and unblocked; solid lines) and/or the Zn2+ activating site to be occupied (dashed lines) during the decay of the Zn2+ potentiation response in the stimulus protocol described in Figure 1C and Figure 10—figure supplement 1. The normalized probabilities following pulses of the indicated concentrations of Zn2+ were calculated by first subtracting the probability time course in the absence of a Zn2+ pulse and then normalizing to the maximal peak response with 10 mM Zn2+. The current decay largely tracks the Zn2+ unbinding time course from the activating site across concentrations, albeit with a slight lag. This lag reflects the subsequent time for the pore gate to close once the stabilizing effect of Zn2+ at the activating site is removed.CC BY · PubMed Central
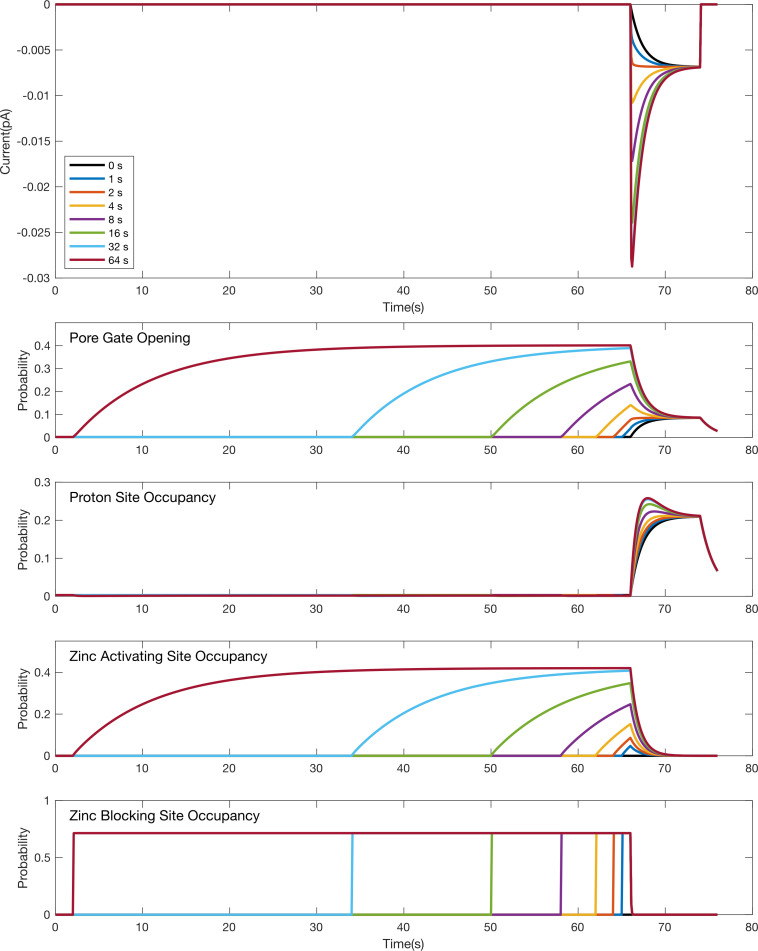
Figure 10—figure supplement 3. Simulation time course for individual gating and binding domains in response to an acid stimulus following pre-exposure to Zn2+. Simulated responses for the model in Figure 9A to the stimulus protocol shown in Figure 2 for pre-incubation with 1 mM Zn2+. The top plot shows simulated current responses for various pre-incubation times in 1 mM Zn2+ (same as depicted in Figure 9C). The other plots are the time courses for the probabilities of individual domains to be activated (i.e. opening of the pore gate or binding at a proton or Zn2+ site) during the simulation. The lack of current during the pre-incubation at pH 7.4 despite Zn2+ induced pore opening during this period reflects both the reduced drive at pH 7.4 relative to pH 5.5 and occupation of the Zn2+ blocking site.
Figure 10—figure supplement 3. Simulation time course for individual gating and binding domains in response to an acid stimulus following pre-exposure to Zn2+. Simulated responses for the model in Figure 9A to the stimulus protocol shown in Figure 2 for pre-incubation with 1 mM Zn2+. The top plot shows simulated current responses for various pre-incubation times in 1 mM Zn2+ (same as depicted in Figure 9C). The other plots are the time courses for the probabilities of individual domains to be activated (i.e. opening of the pore gate or binding at a proton or Zn2+ site) during the simulation. The lack of current during the pre-incubation at pH 7.4 despite Zn2+ induced pore opening during this period reflects both the reduced drive at pH 7.4 relative to pH 5.5 and occupation of the Zn2+ blocking site.CC BY · PubMed Central

Verification

Claims the paper makes

The claims and statistics of this paper haven’t been checked yet.

Run the check — free, no account needed. It reads the open-access text and checks the sources it cites.

A few free checks a day · papers already verified open instantly · results are public

Self-check

Percentages, sums and reported differences re-computed from the paper’s own numbers.

The self-check needs the paper’s full text.

Citations

Cites

Research works printed but not linked: 1

  1. Hille, 2001, Ionic Channels of Excitable Membranes

Metadata

Authors
Teng, B., Kaplan, J. P., Liang, Z., Chyung, K. S., Goldschen-Ohm, M. P., & Liman, E. R.
Affiliations
  • University of Southern California (US)
  • The University of Texas at Austin (US)
Corresponding author
Liman, Emily R
Venue
eLife
Published
2023-04-13
Volume
12
ISSN
2050-084X (ISSN-L)
OpenAlex
W4364350983
Cited by
16
References
51
Citations by year
2026: 2 · 2025: 4 · 2024: 8 · 2023: 2
FWCI
1.42
Type
journal article
Language
en
Open access
Locations
  • eLife (publishedVersion, cc-by)
  • bioRxiv (Cold Spring Harbor Laboratory) (acceptedVersion, cc-by)
  • PubMed Central (publishedVersion, cc-by)
  • PubMed (publishedVersion)
  • DOAJ (DOAJ: Directory of Open Access Journals) (submittedVersion, cc-by-sa)
Funders
National Institutes of Health (R01GM131234, R01GM148591)
Topics
  • Life Sciences › Biochemistry, Genetics and Molecular Biology › Molecular Biology › Ion channel regulation and function
  • Life Sciences › Neuroscience › Sensory Systems › Ion Channels and Receptors
  • Health Sciences › Nursing › Nutrition and Dietetics › Biochemical Analysis and Sensing Techniques
Keywords
zinc activation, channel gating, acid sensing, sour taste, zinc-binding residues, kinetic modeling, pH control
MeSH terms
Acids, Animals, Membrane Proteins, Mutation, Protons, Vertebrates, Zinc, Mice

About these checks

Registry, retraction, Cites and statistics results are computed, not judged, with one exception: a printed reference that no index lists is read once by a model before it counts as a citation error. Claims are extracted by a model and kept only when their quote appears verbatim in the text; each cited source is then checked, with a model’s help, for whether it says what the claim relies on. Those verdicts can be wrong — read the claim’s quote and the cited source before relying on one.

Statistics and arithmetic are recomputed, not judged.

Confidence bands are shown only for fields calibrated on our annotated test set. None is calibrated yet, so no band is shown.

What counts as a claim ›How we measure confidence ›How we check this ›

Are you an author, or do you see a problem with this page? Request a review

Data sources

Bibliographic data: Semantic Scholar, OpenAlex, Crossref.

Contains information from the Semantic Scholar Academic Graph Datasets, made available under the ODC Attribution License (ODC-BY 1.0).

Semantic Scholar’s data is described in: Kinney, R., et al. (2023). The Semantic Scholar Open Data Platform. arXiv:2301.10140.