Cited by 17Malaria Research and ControlBiotin and Related StudiesBiochemical and Structural Characterization

The DOI matches its Crossref record; 6 of the 6 references it cites were found in a registry or an index.

PerTurboID, a targeted in situ method reveals the impact of kinase deletion on its local protein environment in the cytoadhesion complex of malaria-causing parasites

Open access

Published version of a preprint

Abstract

Reverse genetics is key to understanding protein function, but the mechanistic connection between a gene of interest and the observed phenotype is not always clear. Here we describe the use of proximity labeling using TurboID and site-specific quantification of biotinylated peptides to measure changes to the local protein environment of selected targets upon perturbation. We apply this technique, which we call PerTurboID, to understand how the Plasmodium falciparum -exported kinase, FIKK4.1, regulates the function of the major virulence factor of the malaria-causing parasite, PfEMP1. We generated independent TurboID fusions of two proteins that are predicted substrates of FIKK4.1 in a FIKK4.1 conditional KO parasite line. Comparing the abundance of site-specific biotinylated peptides between wildtype and kinase deletion lines reveals the differential accessibility of proteins to biotinylation, indicating changes to localization, protein–protein interactions, or protein structure which are mediated by FIKK4.1 activity. We further show that FIKK4.1 is likely the only FIKK kinase that controls surface levels of PfEMP1, but not other surface antigens, on the infected red blood cell under standard culture conditions. We believe PerTurboID is broadly applicable to study the impact of genetic or environmental perturbation on a selected cellular niche.

Overview

The claims and statistics of this paper haven’t been checked yet.

Run the check — free, no account needed. It reads the open-access text and checks the sources it cites.

A few free checks a day · papers already verified open instantly · results are public

Integrity signals

Registry

Crossref · 10.7554/elife.86367

Cites

6 of 6 references verified0 citation errors · 0 not checkable

Statistics

Figures

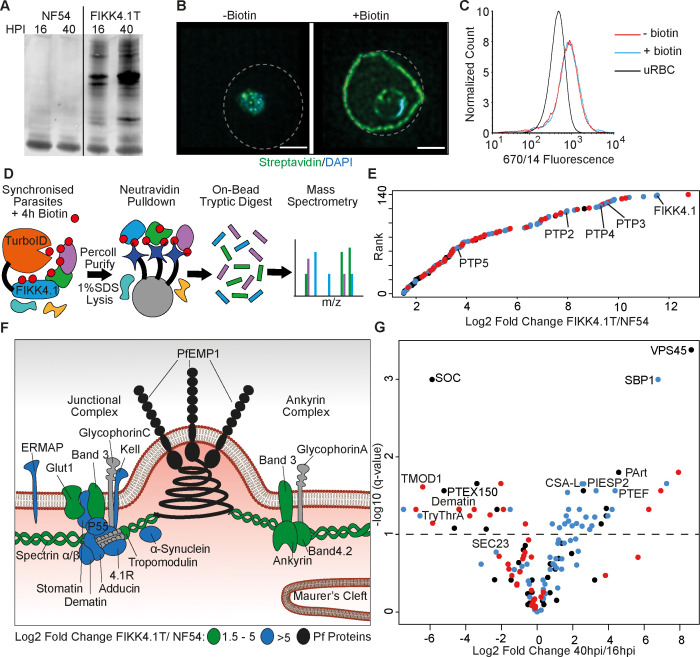
Figure 1. Proximity-dependent protein labeling of the FIKK4.1 subcellular niche. (A) Western blot of parental NF54 and the FIKK4.1-TurboID (FIKK4.1T) fusion line probed with streptavidin conjugated to a fluorophore. Parasites were incubated with biotin either between 16–20 hr post-infection (hpi) or 40–44 hpi. (B) Structured illumination microscopy of FIKK4.1T fusion line incubated with or without biotin, and probed with streptavidin-fluorophore (green), and DAPI (blue). Dotted lines represent the approximate position of the RBC membrane according to brightfield images (see Figure 1—figure supplement 3). Scale bar: 2 µm. (C) Flow cytometric analysis of FIKK4.1T fusion lines using anti-Var2CSA antibodies. (D) Schematic of the classical TurboID protocol. TurboID bait fusion parasites are incubated with biotin (red), purified, then lysed. Biotinylated proteins are enriched, digested, and peptides quantified using mass spectrometry. (E) Ranked plot of all proteins quantified above NF54 background (x-axis – log2 fold change FIKK4.1T/NF54). Red, human proteins; blue, exported parasite proteins; black, non-exported parasite proteins. (F) Schematic of a knob structure at the infected red blood cell (iRBC) cytoskeleton. Human proteins with log2 fold change FIKK4.1T/ NF54 from 1.5 to 5 are highlighted in green, and the most abundant proteins with values >5 are in blue. Parasite proteins are in black, and other RBC proteins are in gray (G) Volcano plot depicting the log2 fold change in abundance between early (16–20 hpi) and late (40–44 hpi) biotin pulses with FIKK4.1T parasites. Red, human proteins; blue, exported P. falciparum proteins; black, non-exported P. falciparum proteins. Selected proteins are labeled.
Figure 1. Proximity-dependent protein labeling of the FIKK4.1 subcellular niche. (A) Western blot of parental NF54 and the FIKK4.1-TurboID (FIKK4.1T) fusion line probed with streptavidin conjugated to a fluorophore. Parasites were incubated with biotin either between 16–20 hr post-infection (hpi) or 40–44 hpi. (B) Structured illumination microscopy of FIKK4.1T fusion line incubated with or without biotin, and probed with streptavidin-fluorophore (green), and DAPI (blue). Dotted lines represent the approximate position of the RBC membrane according to brightfield images (see Figure 1—figure supplement 3). Scale bar: 2 µm. (C) Flow cytometric analysis of FIKK4.1T fusion lines using anti-Var2CSA antibodies. (D) Schematic of the classical TurboID protocol. TurboID bait fusion parasites are incubated with biotin (red), purified, then lysed. Biotinylated proteins are enriched, digested, and peptides quantified using mass spectrometry. (E) Ranked plot of all proteins quantified above NF54 background (x-axis – log2 fold change FIKK4.1T/NF54). Red, human proteins; blue, exported parasite proteins; black, non-exported parasite proteins. (F) Schematic of a knob structure at the infected red blood cell (iRBC) cytoskeleton. Human proteins with log2 fold change FIKK4.1T/ NF54 from 1.5 to 5 are highlighted in green, and the most abundant proteins with values >5 are in blue. Parasite proteins are in black, and other RBC proteins are in gray (G) Volcano plot depicting the log2 fold change in abundance between early (16–20 hpi) and late (40–44 hpi) biotin pulses with FIKK4.1T parasites. Red, human proteins; blue, exported P. falciparum proteins; black, non-exported P. falciparum proteins. Selected proteins are labeled.CC BY · PubMed Central
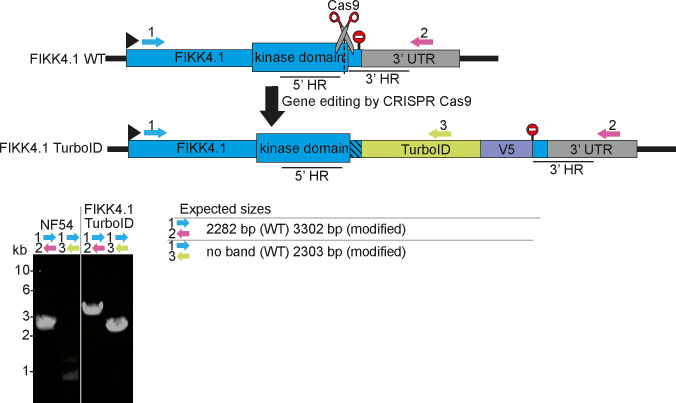
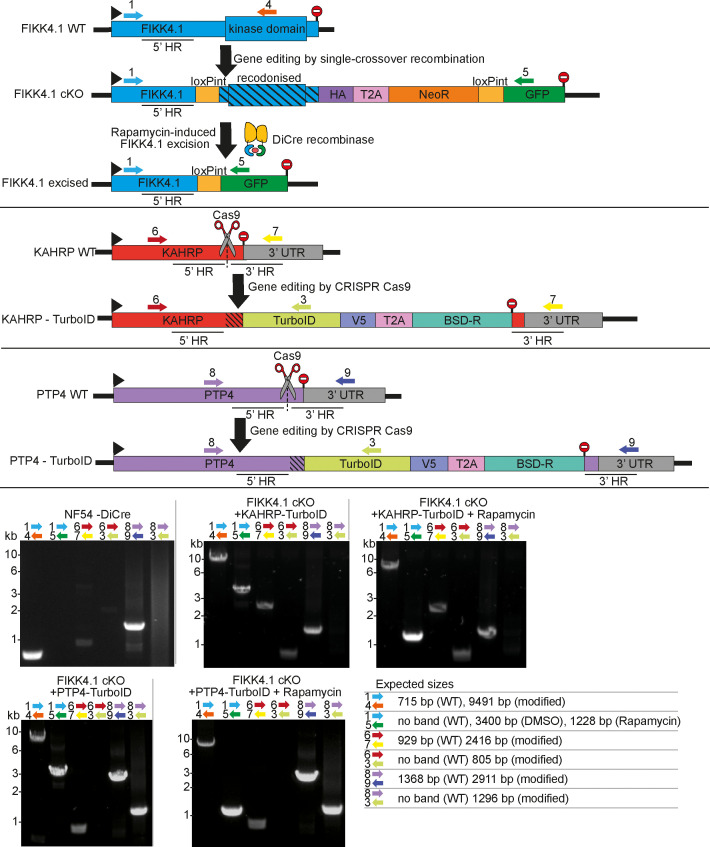
Figure 1—figure supplement 1. PCRs confirming correct genome modification of the FIKK4.1 locus. Primers are represented by numbered arrows on the schematics, stop codons by stop signs. Homology regions used to edit the genome are denoted by 5’ and 3’ HR, and Cas9 guide sites are denoted by scissors. Primer combinations, parasite lines, and whether rapamycin treatment was applied are denoted above each PCR blot, and the expected sizes of PCR bands are shown on the bottom right.
Figure 1—figure supplement 1. PCRs confirming correct genome modification of the FIKK4.1 locus. Primers are represented by numbered arrows on the schematics, stop codons by stop signs. Homology regions used to edit the genome are denoted by 5’ and 3’ HR, and Cas9 guide sites are denoted by scissors. Primer combinations, parasite lines, and whether rapamycin treatment was applied are denoted above each PCR blot, and the expected sizes of PCR bands are shown on the bottom right.CC BY · PubMed Central
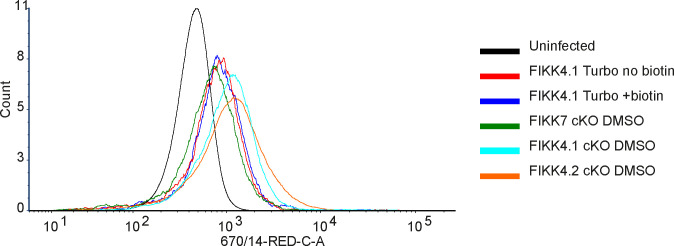
Figure 1—figure supplement 2. Verification of Var2CSA surface translocation in FIKK4.1-TurboID transgenic lines. Flow cytometric analysis of FIKK4.1-TurboID, FIKK4.1 cKO, FIKK4.2 cKO, and FIKK7.1 cKO fusion lines using anti-Var2CSA antibodies. FIKK4.1-TurboID+ biotin was treated with biotin for 4 hr. This confirms that the addition of the TurboID tag to FIKK4.1 and the addition of biotin does not substantially impair Var2CSA surface translocation relative to other parasite lines.
Figure 1—figure supplement 2. Verification of Var2CSA surface translocation in FIKK4.1-TurboID transgenic lines. Flow cytometric analysis of FIKK4.1-TurboID, FIKK4.1 cKO, FIKK4.2 cKO, and FIKK7.1 cKO fusion lines using anti-Var2CSA antibodies. FIKK4.1-TurboID+ biotin was treated with biotin for 4 hr. This confirms that the addition of the TurboID tag to FIKK4.1 and the addition of biotin does not substantially impair Var2CSA surface translocation relative to other parasite lines.CC BY · PubMed Central
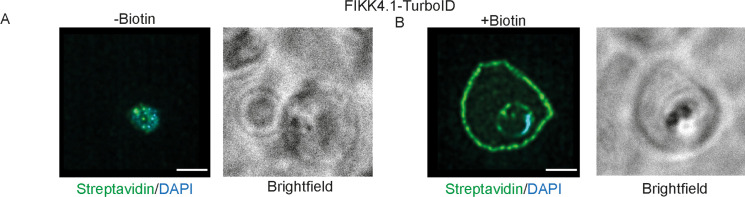
Figure 1—figure supplement 3. Structured illumination microscopy of FIKK4.1-TurboID lines with brightfield images included. Related to images (A, B) from Figure 1B.
Figure 1—figure supplement 3. Structured illumination microscopy of FIKK4.1-TurboID lines with brightfield images included. Related to images (A, B) from Figure 1B.CC BY · PubMed Central
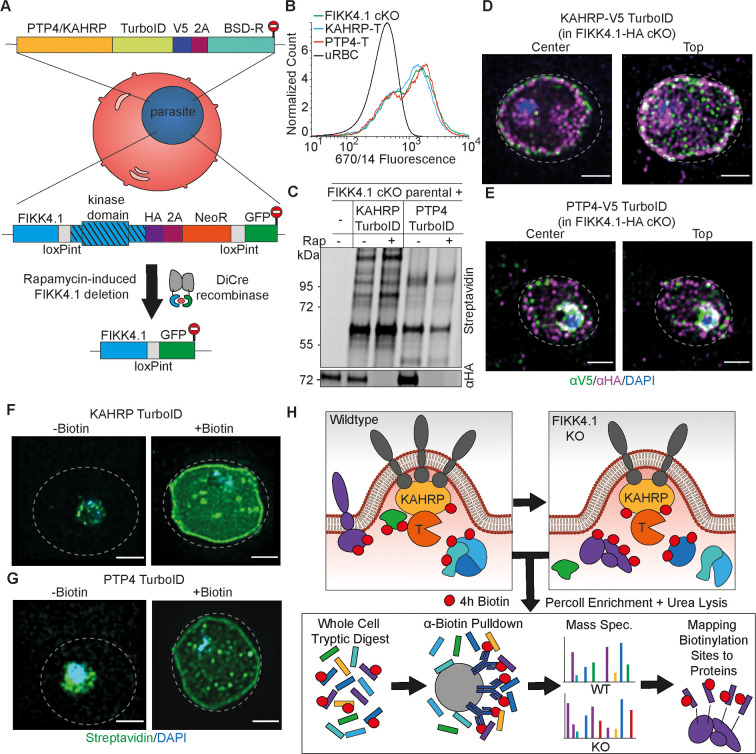
Figure 2. Design and validation of KAHRP and PTP4-TurboID tagging in a FIKK4.1 cKO line for PerTurboID. (A) Schematic of the generation of double transgenic parasite lines containing a loxP-flanked FIKK4.1 kinase domain for conditional KO and KAHRP/PTP4-TurboID fusions. (B) Surface translocation of Var2CSA in KAHRP/PTP4-TurboID and parental lines analyzed by flow cytometry using anti-Var2CSA antibodies. (C) Western blot of FIKK4.1 cKO parental line and KAHRP/PTP4 TurboID-fusion parasites, with full-length FIKK4.1 (-RAP) or the kinase domain deleted (+RAP). The blot was probed with streptavidin-fluorophore or anti-HA antibodies targeting FIKK4.1-HA, confirming excision and biotinylation. (D, E) Structured illumination microscopy of KAHRP/PTP4:TurboID fusion lines probed with anti-HA (FIKK4.1, magenta), anti-V5 (PTP4 or KAHRP, green), and DAPI, blue. Views from the top and center of the cell are shown. (F, G) TurboID transgenic parasites incubated with or without biotin and probed with streptavidin-fluorophore (green) and DAPI (blue). Dotted lines represent the approximate position of the RBC membrane according to bright field images (see Figure 2—figure supplement 5). Scale bar: 2 µm. (H) Schematic depicting the PerTurboID protocol. FIKK4.1 cKO induces hypothetical changes to proteins in the vicinity of KAHRP/PTP4, leading to differences in the accessibility of lysines to biotinylation. Parasites are purified, lysed, then digested. Biotinylated peptides are enriched, then eluted and quantified by mass spectrometry. Biotinylated peptides are mapped onto the protein, indicating protein domains accessible to the TurboID biotin ligase. T, TurboID tag.
Figure 2. Design and validation of KAHRP and PTP4-TurboID tagging in a FIKK4.1 cKO line for PerTurboID. (A) Schematic of the generation of double transgenic parasite lines containing a loxP-flanked FIKK4.1 kinase domain for conditional KO and KAHRP/PTP4-TurboID fusions. (B) Surface translocation of Var2CSA in KAHRP/PTP4-TurboID and parental lines analyzed by flow cytometry using anti-Var2CSA antibodies. (C) Western blot of FIKK4.1 cKO parental line and KAHRP/PTP4 TurboID-fusion parasites, with full-length FIKK4.1 (-RAP) or the kinase domain deleted (+RAP). The blot was probed with streptavidin-fluorophore or anti-HA antibodies targeting FIKK4.1-HA, confirming excision and biotinylation. (D, E) Structured illumination microscopy of KAHRP/PTP4:TurboID fusion lines probed with anti-HA (FIKK4.1, magenta), anti-V5 (PTP4 or KAHRP, green), and DAPI, blue. Views from the top and center of the cell are shown. (F, G) TurboID transgenic parasites incubated with or without biotin and probed with streptavidin-fluorophore (green) and DAPI (blue). Dotted lines represent the approximate position of the RBC membrane according to bright field images (see Figure 2—figure supplement 5). Scale bar: 2 µm. (H) Schematic depicting the PerTurboID protocol. FIKK4.1 cKO induces hypothetical changes to proteins in the vicinity of KAHRP/PTP4, leading to differences in the accessibility of lysines to biotinylation. Parasites are purified, lysed, then digested. Biotinylated peptides are enriched, then eluted and quantified by mass spectrometry. Biotinylated peptides are mapped onto the protein, indicating protein domains accessible to the TurboID biotin ligase. T, TurboID tag.CC BY · PubMed Central
Figure 2—figure supplement 1. PCRs confirming correct genome modification of the PTP4 and KAHRP locus. Primers are represented by numbered arrows on the schematics, stop codons by stop signs. Homology regions used to edit the genome are denoted by 5’ and 3’ HR, and Cas9 guide sites are denoted by scissors. Primer combinations, parasite lines, and whether rapamycin treatment was applied are denoted above each PCR blot, and the expected sizes of PCR bands are shown on the bottom right.
Figure 2—figure supplement 1. PCRs confirming correct genome modification of the PTP4 and KAHRP locus. Primers are represented by numbered arrows on the schematics, stop codons by stop signs. Homology regions used to edit the genome are denoted by 5’ and 3’ HR, and Cas9 guide sites are denoted by scissors. Primer combinations, parasite lines, and whether rapamycin treatment was applied are denoted above each PCR blot, and the expected sizes of PCR bands are shown on the bottom right.CC BY · PubMed Central
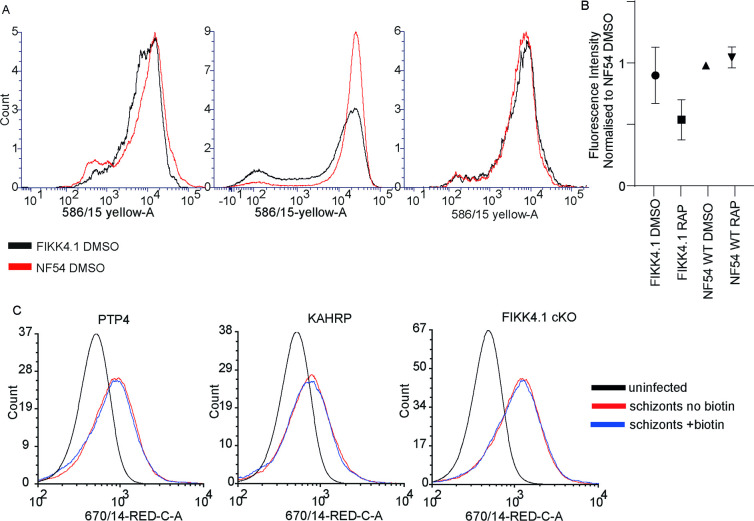
Figure 2—figure supplement 2. Verification of Var2CSA surface translocation in KAHRP and PTP4-TurboID transgenic lines. (A) Flow cytometric verification that FIKK4.1 cKO displays similar levels of Var2CSA on the infected red blood cell (iRBC) surface compared to NF54 wildtype. Three replicates are shown, the median fluorescence intensity of which is shown in (B), normalized to the NF54 DMSO line. (C) Flow cytometric analysis of the effect of a 4 hr biotin treatment on Var2CSA surface translocation in the KAHRP-TurboID and PTP4-TurboID line, as well as the parental line FIKK4.1 cKO as a control.
Figure 2—figure supplement 2. Verification of Var2CSA surface translocation in KAHRP and PTP4-TurboID transgenic lines. (A) Flow cytometric verification that FIKK4.1 cKO displays similar levels of Var2CSA on the infected red blood cell (iRBC) surface compared to NF54 wildtype. Three replicates are shown, the median fluorescence intensity of which is shown in (B), normalized to the NF54 DMSO line. (C) Flow cytometric analysis of the effect of a 4 hr biotin treatment on Var2CSA surface translocation in the KAHRP-TurboID and PTP4-TurboID line, as well as the parental line FIKK4.1 cKO as a control.CC BY · PubMed Central
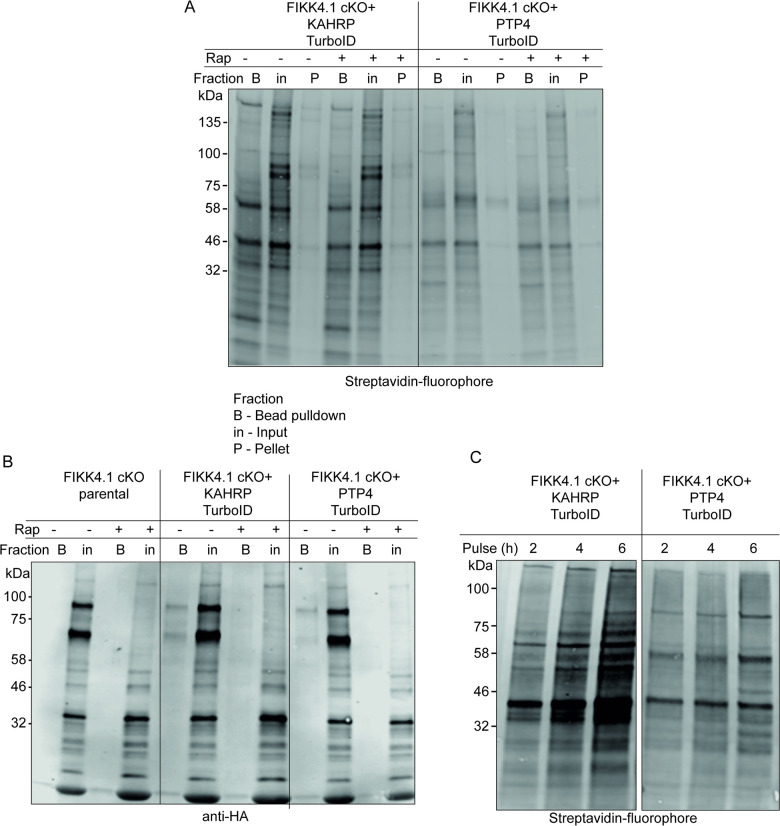
Figure 2—figure supplement 3. Western blot analysis of KAHRP and PTP4-TurboID fusion lines. (A, B) Pulldown of biotinylated proteins by neutravidin-coated beads. Blots were probed with (A) streptavidin-fluorophore or (B) anti-HA targeting FIKK4.1-HA. FIKK4.1 was pulled down only in KAHRP/PTP4-TurboID untreated samples and not the parental line, indicating it is biotinylated by TurboID and successfully excised upon treatment with rapamycin. A double band is observed for FIKK4.1, likely representing a FIKK4.1-NeoR population due to incomplete T2A cleavage of exported proteins. (C) Increasing duration of biotin pulse on biotinylation of proteins in KAHRP/PTP4-TurboID lines. The blot was probed with streptavidin-fluorophore.
Figure 2—figure supplement 3. Western blot analysis of KAHRP and PTP4-TurboID fusion lines. (A, B) Pulldown of biotinylated proteins by neutravidin-coated beads. Blots were probed with (A) streptavidin-fluorophore or (B) anti-HA targeting FIKK4.1-HA. FIKK4.1 was pulled down only in KAHRP/PTP4-TurboID untreated samples and not the parental line, indicating it is biotinylated by TurboID and successfully excised upon treatment with rapamycin. A double band is observed for FIKK4.1, likely representing a FIKK4.1-NeoR population due to incomplete T2A cleavage of exported proteins. (C) Increasing duration of biotin pulse on biotinylation of proteins in KAHRP/PTP4-TurboID lines. The blot was probed with streptavidin-fluorophore.CC BY · PubMed Central
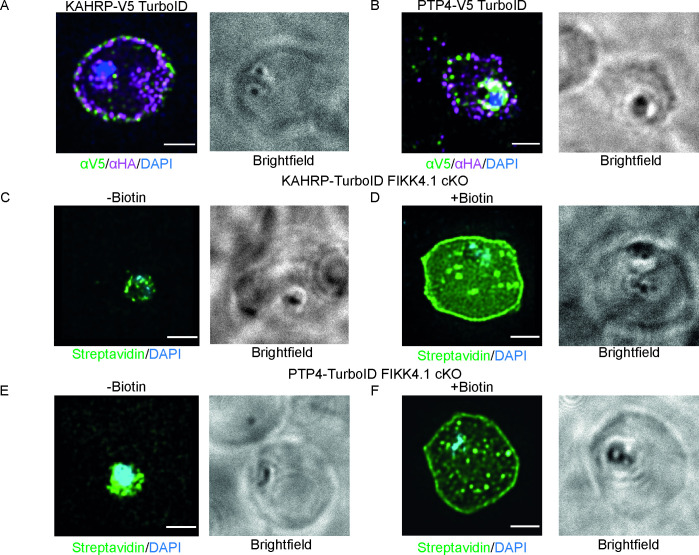
Figure 2—figure supplement 4. Structured illumination microscopy of KAHRP and PTP4-TurboID lines with brightfield images included. Images (A) and (B) related to Figure 2C and D; (C) and (D) related to Figure 2F; and (E); (F) related to Figure 2G, Scale bar: 2 µm.
Figure 2—figure supplement 4. Structured illumination microscopy of KAHRP and PTP4-TurboID lines with brightfield images included. Images (A) and (B) related to Figure 2C and D; (C) and (D) related to Figure 2F; and (E); (F) related to Figure 2G, Scale bar: 2 µm.CC BY · PubMed Central
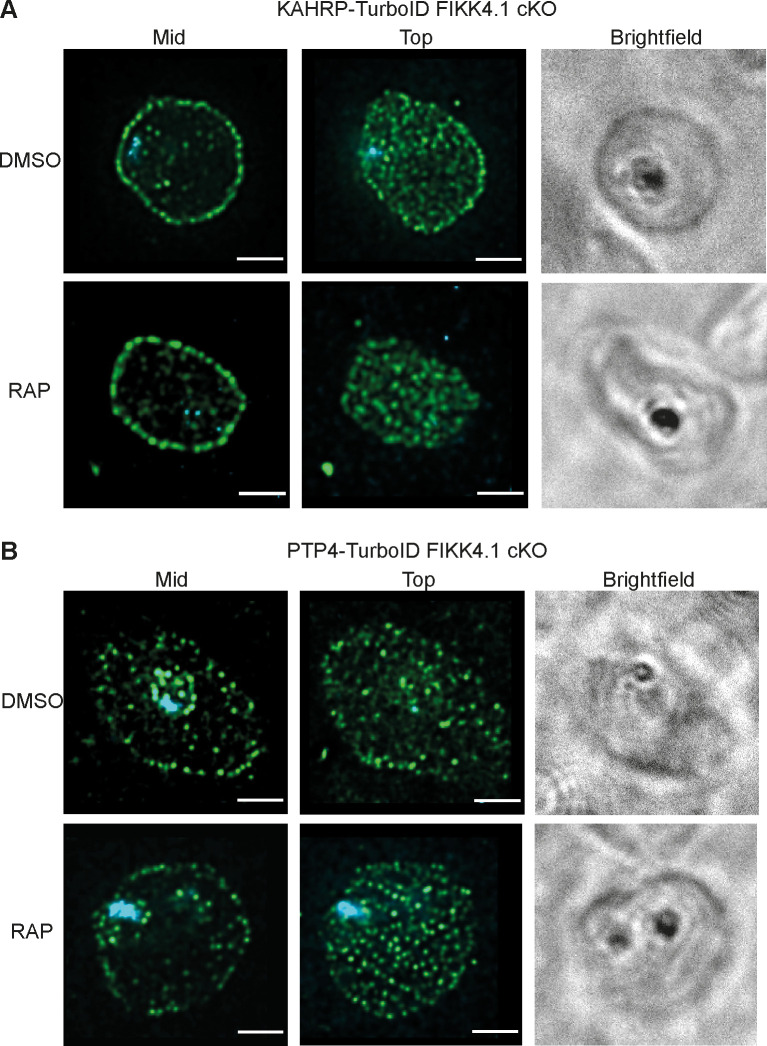
Figure 2—figure supplement 5. Structured illumination microscopy of KAHRP and PTP4-TurboID lines. KAHRP-TurboID (A) and PTP4-TurboID (B) fusion lines treated with rapamycin (FIKK4.1 KO) or DMSO (Wild type), probed with anti-V5 antibody (green), and DAPI (blue). Z stacks were selected from either the center (mid) of the cell or the top, to allow the distribution of peripheral puncta to be visualized. Scale bar: 2 µm.
Figure 2—figure supplement 5. Structured illumination microscopy of KAHRP and PTP4-TurboID lines. KAHRP-TurboID (A) and PTP4-TurboID (B) fusion lines treated with rapamycin (FIKK4.1 KO) or DMSO (Wild type), probed with anti-V5 antibody (green), and DAPI (blue). Z stacks were selected from either the center (mid) of the cell or the top, to allow the distribution of peripheral puncta to be visualized. Scale bar: 2 µm.CC BY · PubMed Central
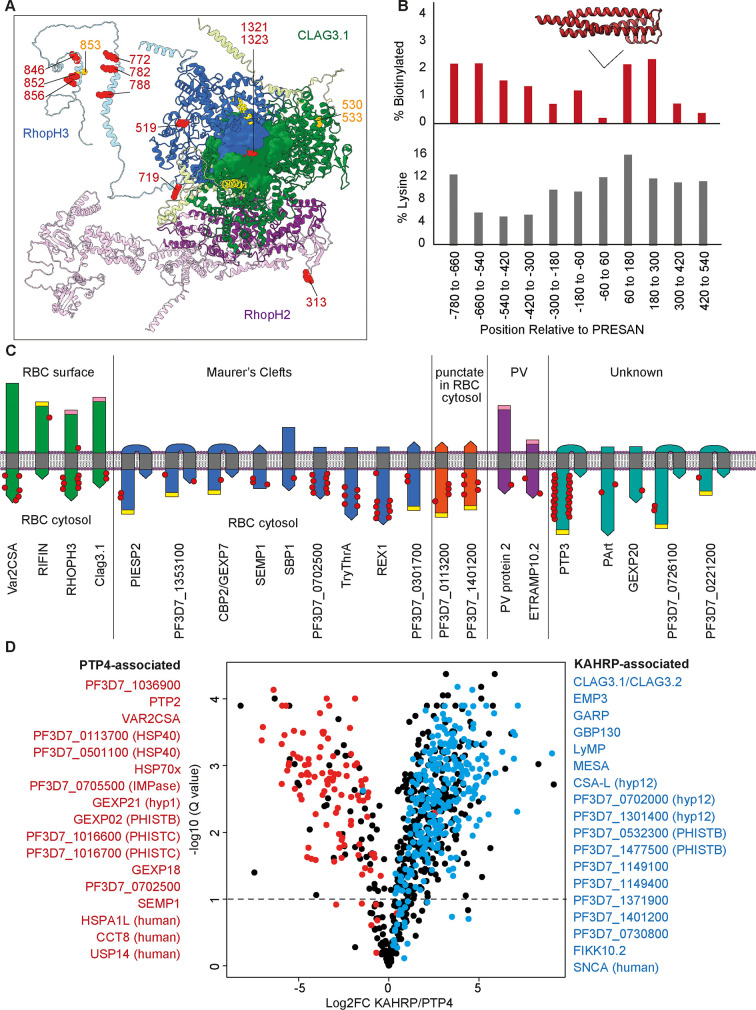
Figure 3. Insights into protein structure, interactions, topology, and localization from KAHRP and PTP4 site-specific TurboID. (A) Cryo-electron microscopy structure (PDB: 7KIY) of the RHOPH complex (RHOPH2, purple; RHOPH3, blue; Clag3.1, green) (Schureck et al., 2021). Unresolved regions have been substituted with the AlphaFold-predicted structures and rotated to prevent clashes (lighter shades) (Jumper et al., 2021). Lysines biotinylated by either KAHRP or PTP4-TurboID are represented as red side-chain spheres. Residues that are either more or less phosphorylated upon FIKK4.1 deletion are in orange. Transmembrane domains are in yellow. Image created in Chimera (Pettersen et al., 2004). (B) A representation of the position of biotinylation of lysines across all 29 Plasmodium helical interspersed subtelomeric (PHIST) proteins in the dataset. Positions (x-axis) are relative to the predicted center of the ~120 aa PRESAN domain which spans positions –60 to 60 (PRESAN position predicted by PFAM via PlasmoDB; Amos et al., 2022). Top panel: y-axis represents the percentage of all lysine residues which are biotinylated in either KAHRP or PTP4 datasets. Bottom panel: percentage of lysines in primary amino acid sequence. A drop in biotinylation is observed within the PRESAN domain itself, with no reduction in the proportion of lysine residues. (C) Schematic depicting transmembrane domain (gray) proteins observed in the dataset, with the orientation based either on the literature (for PfEMP1, RIFIN, and SBP1) or predicted from the position of biotinylation sites. Some MC and punctate proteins may be trafficked in chaperoned complexes before insertion into a membrane at a later stage – we depict this hypothetical ‘membrane-inserted’ form. N-termini are flat, C-termini are pointed. PEXEL motifs, which are cleaved during export, are in yellow. Predicted TM domains and signal peptides upstream of the PEXEL motif are removed. Cleaved signal peptides with no PEXEL motif are in pink. Proteins are grouped according to published subcellular localization. Where proteins occupy more than one subcellular position (e.g. PIESP2 has been found in MC and on the surface), they are placed in one group only. The approximate positions of biotinylated residues are depicted with red dots. Proteins are not to scale. (D) Volcano plot depicting the log2 fold change in biotinylated peptide abundance between KAHRP and PTP4-TurboID fusion parasites. Proteins for which almost all peptides are more abundant in either PTP4 (red) or KAHRP (blue) datasets are highlighted. Peptides originating from KAHRP or PTP4 themselves have been removed for clarity. y-axis (-log10 q-value, N = 3).
Figure 3. Insights into protein structure, interactions, topology, and localization from KAHRP and PTP4 site-specific TurboID. (A) Cryo-electron microscopy structure (PDB: 7KIY) of the RHOPH complex (RHOPH2, purple; RHOPH3, blue; Clag3.1, green) (Schureck et al., 2021). Unresolved regions have been substituted with the AlphaFold-predicted structures and rotated to prevent clashes (lighter shades) (Jumper et al., 2021). Lysines biotinylated by either KAHRP or PTP4-TurboID are represented as red side-chain spheres. Residues that are either more or less phosphorylated upon FIKK4.1 deletion are in orange. Transmembrane domains are in yellow. Image created in Chimera (Pettersen et al., 2004). (B) A representation of the position of biotinylation of lysines across all 29 Plasmodium helical interspersed subtelomeric (PHIST) proteins in the dataset. Positions (x-axis) are relative to the predicted center of the ~120 aa PRESAN domain which spans positions –60 to 60 (PRESAN position predicted by PFAM via PlasmoDB; Amos et al., 2022). Top panel: y-axis represents the percentage of all lysine residues which are biotinylated in either KAHRP or PTP4 datasets. Bottom panel: percentage of lysines in primary amino acid sequence. A drop in biotinylation is observed within the PRESAN domain itself, with no reduction in the proportion of lysine residues. (C) Schematic depicting transmembrane domain (gray) proteins observed in the dataset, with the orientation based either on the literature (for PfEMP1, RIFIN, and SBP1) or predicted from the position of biotinylation sites. Some MC and punctate proteins may be trafficked in chaperoned complexes before insertion into a membrane at a later stage – we depict this hypothetical ‘membrane-inserted’ form. N-termini are flat, C-termini are pointed. PEXEL motifs, which are cleaved during export, are in yellow. Predicted TM domains and signal peptides upstream of the PEXEL motif are removed. Cleaved signal peptides with no PEXEL motif are in pink. Proteins are grouped according to published subcellular localization. Where proteins occupy more than one subcellular position (e.g. PIESP2 has been found in MC and on the surface), they are placed in one group only. The approximate positions of biotinylated residues are depicted with red dots. Proteins are not to scale. (D) Volcano plot depicting the log2 fold change in biotinylated peptide abundance between KAHRP and PTP4-TurboID fusion parasites. Proteins for which almost all peptides are more abundant in either PTP4 (red) or KAHRP (blue) datasets are highlighted. Peptides originating from KAHRP or PTP4 themselves have been removed for clarity. y-axis (-log10 q-value, N = 3).CC BY · PubMed Central
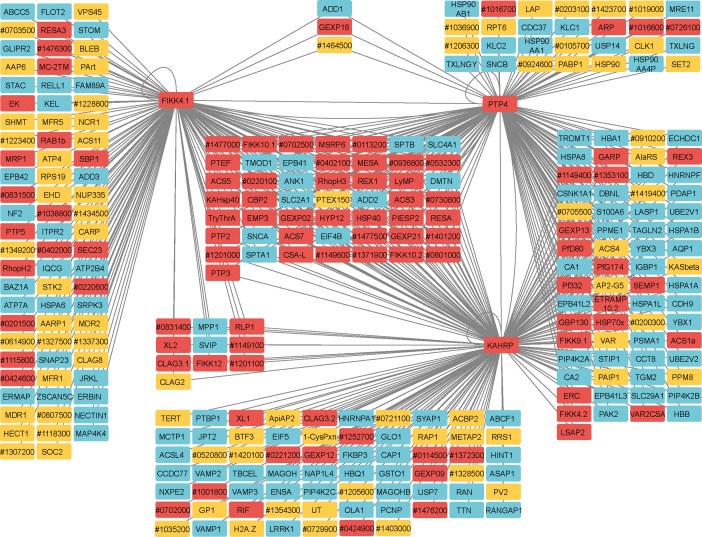
Figure 3—figure supplement 1. Network analysis of proteins observed in FIKK4.1, KAHRP, and PTP4 TurboID datasets. Human proteins are in blue, P. falciparum-predicted exported proteins in red, and other P. falciparum proteins in yellow. ‘Pf3D7’ has been omitted from P. falciparum gene IDs. Connecting lines indicate a gene is likely in the vicinity of the TurboID-tagged gene. Network created with Cytoscape software (Shannon et al., 2003).
Figure 3—figure supplement 1. Network analysis of proteins observed in FIKK4.1, KAHRP, and PTP4 TurboID datasets. Human proteins are in blue, P. falciparum-predicted exported proteins in red, and other P. falciparum proteins in yellow. ‘Pf3D7’ has been omitted from P. falciparum gene IDs. Connecting lines indicate a gene is likely in the vicinity of the TurboID-tagged gene. Network created with Cytoscape software (Shannon et al., 2003).CC BY · PubMed Central
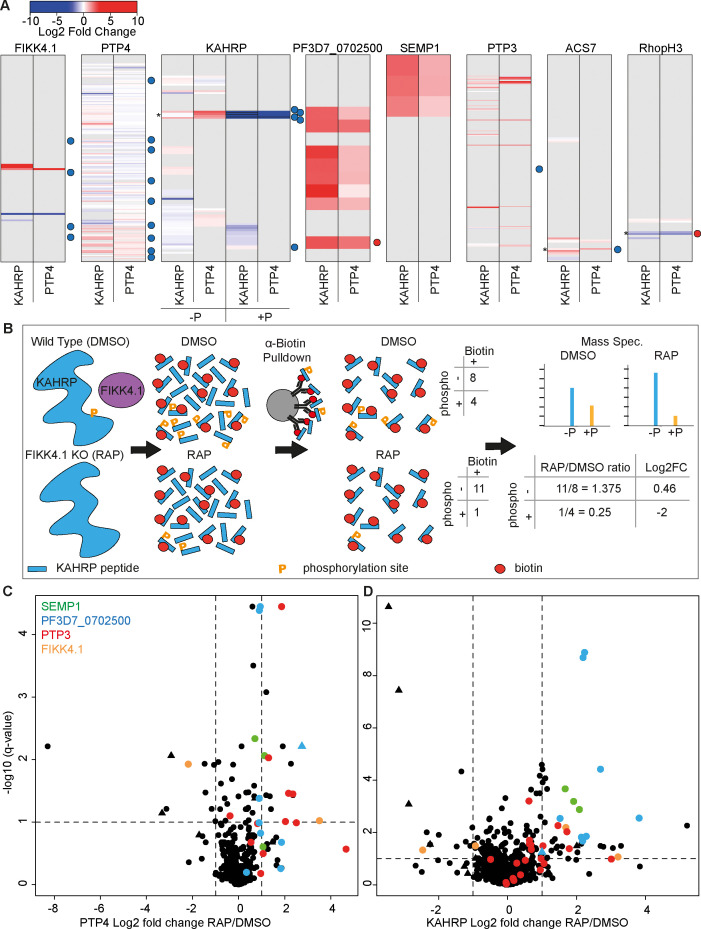
Figure 4. Changes in site-specific biotinylation observed upon FIKK4.1 deletion. (A) Barcodes representing selected proteins from the PerTurboID dataset. Each row represents a lysine, with the N-terminus of the protein at the top. Lysines not biotinylated in either the KAHRP (left) or PTP4 (right) dataset are in gray. Biotinylated lysines are colored according to the log2 fold change in abundance upon FIKK4.1 deletion (RAP/DMSO), with more abundant biotinylated peptides in red and less abundant in blue. For KAHRP, peptides which are both phosphorylated and biotinylated are shown in the right-hand panels (P+) while those biotinylated only are on the left (P-). Phosphorylated peptides for all other proteins are shown in Figure 4—figure supplement 1. Dots to the right of the barcodes represent the approximate position of phosphorylation sites on the protein which were previously shown to be affected by FIKK4.1 deletion (blue, less phosphorylated; red, more phosphorylated upon FIKK4.1 deletion). Asterisks denote positions of interest (351–364 of KAHRP, 876 of ACS7, and 853 of RHOPH3). (B) Schematic demonstrating how PerTurboID can detect changes in protein phosphorylation, using KAHRP as an example. Peptides are represented as blue bars with either one or two modifications: phosphorylation (orange ‘P’) or biotin (red circle). Biotinylated peptides that are also phosphorylated are quantified separately from peptides that are only biotinylated. Loss of phosphorylated + biotinylated peptides upon FIKK4.1 deletion therefore leads to an increase in the biotinylated-only peptide and a positive log2 fold change. (C, D) Volcano plots showing the log2 fold change in biotinylated site abundance between FIKK4.1 wildtype and kinase-deleted conditions (RAP/DMSO) for PTP4-TurboID (B) and KAHRP-TurboID (C) fusion parasites. Biotinylated sites from four parasite proteins, SEMP1, PTP3, Pf3D7_0702500, and FIKK4.1, are highlighted. Sites which are also phosphorylated are represented by triangles.
Figure 4. Changes in site-specific biotinylation observed upon FIKK4.1 deletion. (A) Barcodes representing selected proteins from the PerTurboID dataset. Each row represents a lysine, with the N-terminus of the protein at the top. Lysines not biotinylated in either the KAHRP (left) or PTP4 (right) dataset are in gray. Biotinylated lysines are colored according to the log2 fold change in abundance upon FIKK4.1 deletion (RAP/DMSO), with more abundant biotinylated peptides in red and less abundant in blue. For KAHRP, peptides which are both phosphorylated and biotinylated are shown in the right-hand panels (P+) while those biotinylated only are on the left (P-). Phosphorylated peptides for all other proteins are shown in Figure 4—figure supplement 1. Dots to the right of the barcodes represent the approximate position of phosphorylation sites on the protein which were previously shown to be affected by FIKK4.1 deletion (blue, less phosphorylated; red, more phosphorylated upon FIKK4.1 deletion). Asterisks denote positions of interest (351–364 of KAHRP, 876 of ACS7, and 853 of RHOPH3). (B) Schematic demonstrating how PerTurboID can detect changes in protein phosphorylation, using KAHRP as an example. Peptides are represented as blue bars with either one or two modifications: phosphorylation (orange ‘P’) or biotin (red circle). Biotinylated peptides that are also phosphorylated are quantified separately from peptides that are only biotinylated. Loss of phosphorylated + biotinylated peptides upon FIKK4.1 deletion therefore leads to an increase in the biotinylated-only peptide and a positive log2 fold change. (C, D) Volcano plots showing the log2 fold change in biotinylated site abundance between FIKK4.1 wildtype and kinase-deleted conditions (RAP/DMSO) for PTP4-TurboID (B) and KAHRP-TurboID (C) fusion parasites. Biotinylated sites from four parasite proteins, SEMP1, PTP3, Pf3D7_0702500, and FIKK4.1, are highlighted. Sites which are also phosphorylated are represented by triangles.CC BY · PubMed Central
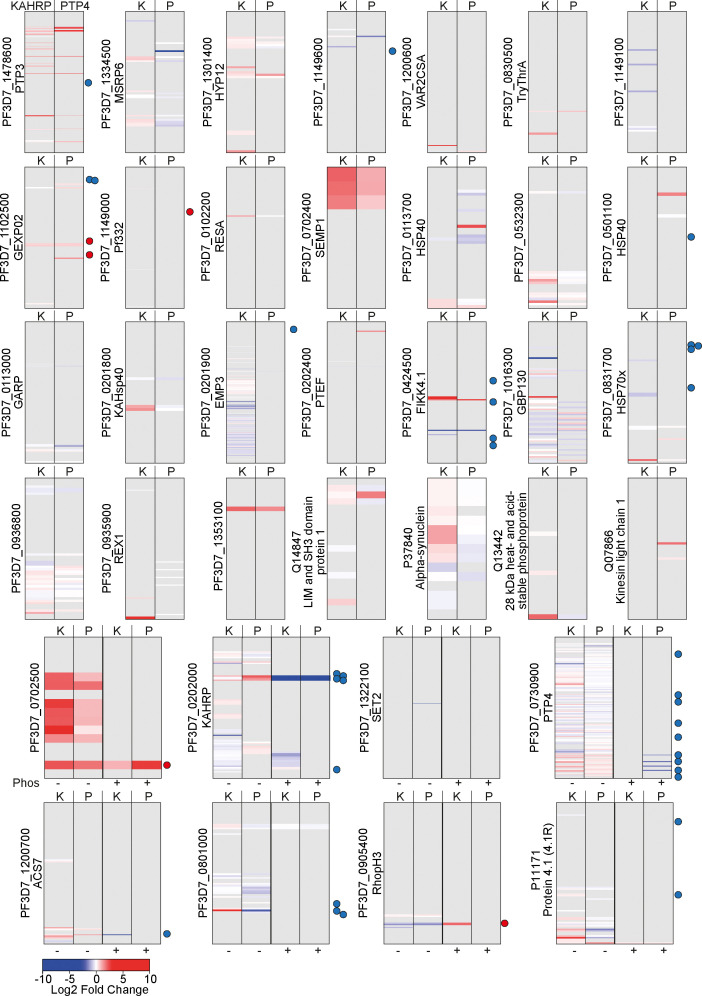
Figure 4—figure supplement 1. Barcodes representing changes to lysine biotinylation upon FIKK4.1 KO on proteins in the PerTurboID dataset. Proteins for which at least two biotinylation sites were observed and at least one biotinylation site was significantly changed upon FIKK4.1 KO are included. Each row represents a lysine from the protein, with the N-terminus at the top. Lysines not biotinylated in either the KAHRP (K, left) or PTP4 (P, right) dataset are in gray. Lysines observed in the dataset are colored according to the log2 fold change in abundance upon FIKK4.1 deletion (RAP/DMSO), with peptides more abundant in the DMSO condition in blue and those more abundant in the RAP condition in red. Dots to the right of the barcodes represent the approximate position of phosphorylation sites on the protein which are affected by FIKK4.1 deletion according to our previous phosphoproteomics data (blue, less phosphorylated; red, more phosphorylated upon FIKK4.1 deletion). For the bottom eight proteins, peptides which are both phosphorylated and biotinylated are shown on the right-hand panels (P+) while those biotinylated only are on the left (P-).
Figure 4—figure supplement 1. Barcodes representing changes to lysine biotinylation upon FIKK4.1 KO on proteins in the PerTurboID dataset. Proteins for which at least two biotinylation sites were observed and at least one biotinylation site was significantly changed upon FIKK4.1 KO are included. Each row represents a lysine from the protein, with the N-terminus at the top. Lysines not biotinylated in either the KAHRP (K, left) or PTP4 (P, right) dataset are in gray. Lysines observed in the dataset are colored according to the log2 fold change in abundance upon FIKK4.1 deletion (RAP/DMSO), with peptides more abundant in the DMSO condition in blue and those more abundant in the RAP condition in red. Dots to the right of the barcodes represent the approximate position of phosphorylation sites on the protein which are affected by FIKK4.1 deletion according to our previous phosphoproteomics data (blue, less phosphorylated; red, more phosphorylated upon FIKK4.1 deletion). For the bottom eight proteins, peptides which are both phosphorylated and biotinylated are shown on the right-hand panels (P+) while those biotinylated only are on the left (P-).CC BY · PubMed Central
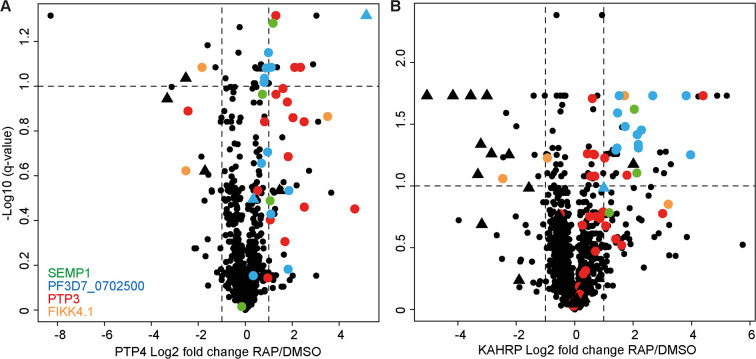
Figure 4—figure supplement 2. Peptide-level volcano plots. Plots represent the log2 fold change in biotinylated peptide abundance between FIKK4.1 intact and kinase-deleted conditions (RAP/DMSO) for PTP4-TurboID (A) and KAHRP-TurboID (B) fusion parasites. Biotinylated peptides from four parasite proteins, SEMP1, PTP3, Pf3D7_0702500, and FIKK4.1, are highlighted. Peptides which are also phosphorylated are represented by triangles. Related to Figure 4C and D, where the intensities of peptides representing the same biotinylated site are averaged.
Figure 4—figure supplement 2. Peptide-level volcano plots. Plots represent the log2 fold change in biotinylated peptide abundance between FIKK4.1 intact and kinase-deleted conditions (RAP/DMSO) for PTP4-TurboID (A) and KAHRP-TurboID (B) fusion parasites. Biotinylated peptides from four parasite proteins, SEMP1, PTP3, Pf3D7_0702500, and FIKK4.1, are highlighted. Peptides which are also phosphorylated are represented by triangles. Related to Figure 4C and D, where the intensities of peptides representing the same biotinylated site are averaged.CC BY · PubMed Central
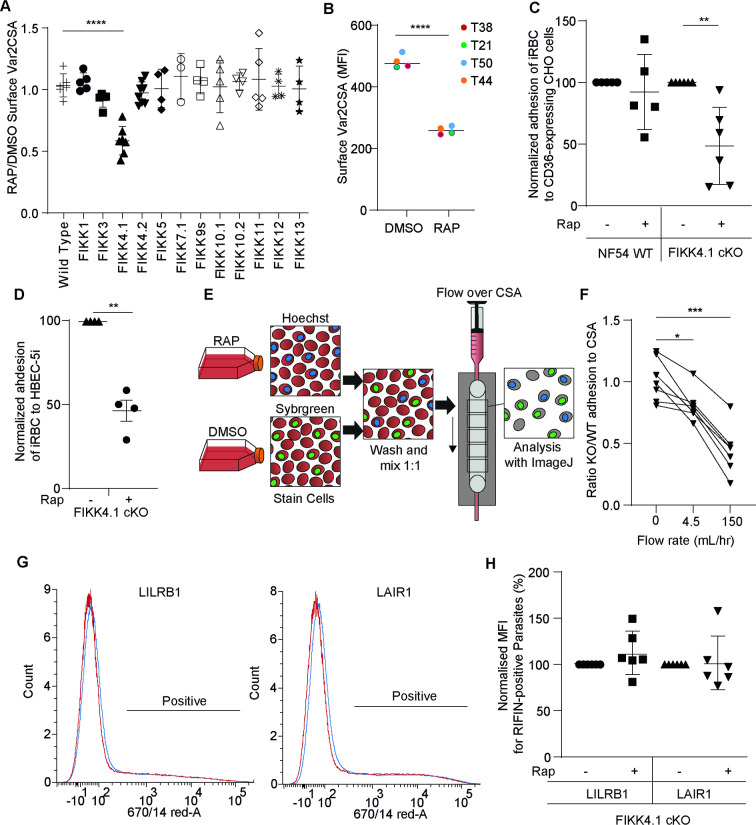
Figure 5. FIKK4.1 is the only FIKK kinase to modulate surface translocation of PfEMP1, but not of RIFINs. (A) Var2CSA surface translocation analysis by flow cytometry using anti-Var2CSA antibodies (Srivastava et al., 2011). y-axis, ratio of median fluorescence intensity of Var2CSA-positive cells between RAP and DMSO-treated parasites lines. x-axis, conditional kinase domain deletion lines for the indicated FIKK kinase. ‘FIKK 9s’ represents the deletion of seven FIKK kinases on chromosome 9. Analyzed by one-way ANOVA with Dunnet’s multiple-comparison test. FIKK4.1 vs. wildtype – adjusted p-value<0.0001, n = 3–6. (B) Flow cytometry analysis of the surface presentation of Var2CSA in WT (DMSO) or FIKK4.1 KO parasites (RAP) using monoclonal antibodies directed towards different extracellular domains of the protein. y-axis, median fluorescence intensity. Paired t-test p-value<0.0001. (C) Adhesion assays with NF54 parental or FIKK4.1 cKO parasites to CD36-expressing CHO cells under flow, with or without RAP treatment, normalized to the no RAP control. Analyzed by one-way ANOVA with Sidak’s multiple-comparison adjustment. FIKK4.1 – Rap vs. +Rap adjusted p-value=0.0014. (D) Binding of iRBC to CSA-expressing HBEC-5i cells under flow. Numbers are normalized to the DMSO control. t-test p-value=0.0033. (E) Schematic depicting the set-up for semi-automated analysis of adhesion to CSA under flow. Dyed wildtype or KO parasites are premixed and flowed over CSA-coated channels. Images are taken along the channel and the ratio of wildtype to KO quantified by ImageJ at different flow speeds. (F) FIKK4.1 KO/WT adhesion under flow using the method depicted in (E). x-axis, flow rate in mL/hr. Images for ‘before’ measurements were taken with a separate uncoated channel with no flow. y-axis, ratio of WT/KO parasites at different flow speeds. Analysis by paired one-way ANOVA with corrected for multiple comparisons by the Sidak method. p-values: before vs. 4.5 mL/hr = 0.0228, before vs. 150 mL/hr = 0.0008. (G) Representative flow cytometry histograms of RIFIN presentation on FIKK4.1 WT (red) or KO (blue) infected red blood cell (iRBC). iRBCs were incubated with LILRB1-Fc or LAIR1-Fc fusion proteins, followed by anti-human Fc-APC and SYBR green staining. Parasites positive for LILRB1 or LAIR1-binding RIFINs are indicated. (H) Histograms from (G) are quantified, with the median fluorescence intensity of positive parasites normalized to the untreated control. No significant difference was observed.
Figure 5. FIKK4.1 is the only FIKK kinase to modulate surface translocation of PfEMP1, but not of RIFINs. (A) Var2CSA surface translocation analysis by flow cytometry using anti-Var2CSA antibodies (Srivastava et al., 2011). y-axis, ratio of median fluorescence intensity of Var2CSA-positive cells between RAP and DMSO-treated parasites lines. x-axis, conditional kinase domain deletion lines for the indicated FIKK kinase. ‘FIKK 9s’ represents the deletion of seven FIKK kinases on chromosome 9. Analyzed by one-way ANOVA with Dunnet’s multiple-comparison test. FIKK4.1 vs. wildtype – adjusted p-value<0.0001, n = 3–6. (B) Flow cytometry analysis of the surface presentation of Var2CSA in WT (DMSO) or FIKK4.1 KO parasites (RAP) using monoclonal antibodies directed towards different extracellular domains of the protein. y-axis, median fluorescence intensity. Paired t-test p-value<0.0001. (C) Adhesion assays with NF54 parental or FIKK4.1 cKO parasites to CD36-expressing CHO cells under flow, with or without RAP treatment, normalized to the no RAP control. Analyzed by one-way ANOVA with Sidak’s multiple-comparison adjustment. FIKK4.1 – Rap vs. +Rap adjusted p-value=0.0014. (D) Binding of iRBC to CSA-expressing HBEC-5i cells under flow. Numbers are normalized to the DMSO control. t-test p-value=0.0033. (E) Schematic depicting the set-up for semi-automated analysis of adhesion to CSA under flow. Dyed wildtype or KO parasites are premixed and flowed over CSA-coated channels. Images are taken along the channel and the ratio of wildtype to KO quantified by ImageJ at different flow speeds. (F) FIKK4.1 KO/WT adhesion under flow using the method depicted in (E). x-axis, flow rate in mL/hr. Images for ‘before’ measurements were taken with a separate uncoated channel with no flow. y-axis, ratio of WT/KO parasites at different flow speeds. Analysis by paired one-way ANOVA with corrected for multiple comparisons by the Sidak method. p-values: before vs. 4.5 mL/hr = 0.0228, before vs. 150 mL/hr = 0.0008. (G) Representative flow cytometry histograms of RIFIN presentation on FIKK4.1 WT (red) or KO (blue) infected red blood cell (iRBC). iRBCs were incubated with LILRB1-Fc or LAIR1-Fc fusion proteins, followed by anti-human Fc-APC and SYBR green staining. Parasites positive for LILRB1 or LAIR1-binding RIFINs are indicated. (H) Histograms from (G) are quantified, with the median fluorescence intensity of positive parasites normalized to the untreated control. No significant difference was observed.CC BY · PubMed Central
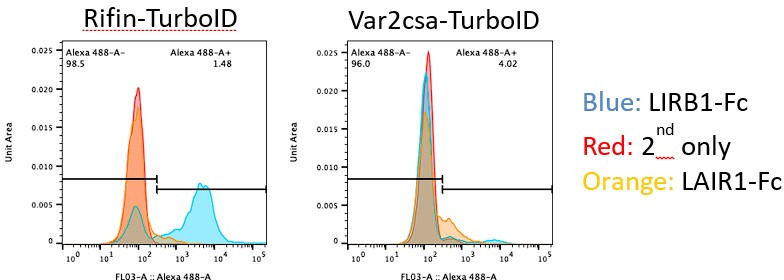
Author response image 1.
Author response image 1. CC BY · PubMed Central

Verification

Claims the paper makes

The claims and statistics of this paper haven’t been checked yet.

Run the check — free, no account needed. It reads the open-access text and checks the sources it cites.

A few free checks a day · papers already verified open instantly · results are public

Self-check

Percentages, sums and reported differences re-computed from the paper’s own numbers.

The self-check needs the paper’s full text.

Citations

Cites

Research works printed but not linked: 63

  1. Amos, 2022, VEuPathDB: the eukaryotic pathogen, vector and host bioinformatics resource center, Nucleic Acids Research, 50, D898, 10.1093/nar/gkab929 · DOI
  2. Aurrecoechea, 2009, PlasmoDB: a functional genomic database for malaria parasites, Nucleic Acids Research, 37, D539, 10.1093/nar/gkn814 · DOI
  3. Bachmann, 2015, A comparative study of the localization and membrane topology of members of the RIFIN, STEVOR and PfMC-2TM protein families in Plasmodium falciparum-infected erythrocytes, Malaria Journal, 14, 10.1186/s12936-015-0784-2 · DOI
  4. Barbour, 2008, Red blood cells are the major source of alpha-synuclein in blood, Neuro-Degenerative Diseases, 5, 55, 10.1159/000112832 · DOI
  5. Baruch, 1996, Plasmodium falciparum erythrocyte membrane protein 1 is a parasitized erythrocyte receptor for adherence to CD36, thrombospondin, and intercellular adhesion molecule 1, PNAS, 93, 3497, 10.1073/pnas.93.8.3497 · DOI · Paper page
  6. Behl, 2019, Cholesterol bound Plasmodium falciparum co-chaperone “PFA0660w” complexes with major virulence factor “PfEMP1” via chaperone “PfHsp70-x.”, Scientific Reports, 9, 10.1038/s41598-019-39217-y · DOI
  7. Birnbaum, 2017, A genetic system to study Plasmodium falciparum protein function, Nature Methods, 14, 450, 10.1038/nmeth.4223 · DOI
  8. Blisnick, 2000, Pfsbp1, a Maurer’s cleft Plasmodium falciparum protein, is associated with the erythrocyte skeleton, Molecular and Biochemical Parasitology, 111, 107, 10.1016/s0166-6851(00)00301-7 · DOI
  9. Branon, 2018, Efficient proximity labeling in living cells and organisms with TurboID, Nature Biotechnology, 36, 880, 10.1038/nbt.4201 · DOI · Paper page
  10. Cappelletti, 2021, Dynamic 3D proteomes reveal protein functional alterations at high resolution in situ, Cell, 184, 545, 10.1016/j.cell.2020.12.021 · DOI
  11. Carmo, 2022, Deletion of the Plasmodium falciparum exported protein PTP7 leads to Maurer’s clefts vesiculation, host cell remodeling defects, and loss of surface presentation of EMP1, PLOS Pathogens, 18, 10.1371/journal.ppat.1009882 · DOI
  12. Collins, 2013, Robust inducible Cre recombinase activity in the human malaria parasite Plasmodium falciparum enables efficient gene deletion within a single asexual erythrocytic growth cycle, Molecular Microbiology, 88, 687, 10.1111/mmi.12206 · DOI
  13. Coppel, 1988, MESA is a Plasmodium falciparum phosphoprotein associated with the erythrocyte membrane skeleton, Molecular and Biochemical Parasitology, 31, 223, 10.1016/0166-6851(88)90152-1 · DOI
  14. Cox, 2008, MaxQuant enables high peptide identification rates, individualized p.p.b.-range mass accuracies and proteome-wide protein quantification, Nature Biotechnology, 26, 1367, 10.1038/nbt.1511 · DOI · Paper page
  15. Cox, 2011, Andromeda: a peptide search engine integrated into the MaxQuant environment, Journal of Proteome Research, 10, 1794, 10.1021/pr101065j · DOI
  16. Crabb, 1997, Targeted gene disruption shows that knobs enable malaria-infected red cells to cytoadhere under physiological shear stress, Cell, 89, 287, 10.1016/S0092-8674(00)80207-X · DOI
  17. Davies, 2016, Expansion of lysine-rich repeats in plasmodium proteins generates novel localization sequences that target the periphery of the host erythrocyte, The Journal of Biological Chemistry, 291, 26188, 10.1074/jbc.M116.761213 · DOI
  18. Davies, 2020, An exported kinase family mediates species-specific erythrocyte remodelling and virulence in human malaria, Nature Microbiology, 5, 848, 10.1038/s41564-020-0702-4 · DOI
  19. de Koning-Ward, 2009, A newly discovered protein export machine in malaria parasites, Nature, 459, 945, 10.1038/nature08104 · DOI
  20. Desai, 2000, A voltage-dependent channel involved in nutrient uptake by red blood cells infected with the malaria parasite, Nature, 406, 1001, 10.1038/35023000 · DOI
  21. Dietz, 2014, Characterization of the small exported Plasmodium falciparum membrane protein SEMP1, PLOS ONE, 9, 10.1371/journal.pone.0103272 · DOI
  22. Ganguly, 2015, Dynamic association of PfEMP1 and KAHRP in knobs mediates cytoadherence during Plasmodium invasion, Scientific Reports, 5, 10.1038/srep08617 · DOI
  23. Geoghegan, 2022, CLK1/CLK2-driven signalling at the Leishmania kinetochore is captured by spatially referenced proximity phosphoproteomics, Communications Biology, 5, 10.1038/s42003-022-04280-1 · DOI
  24. Goel, 2015, RIFINs are adhesins implicated in severe Plasmodium falciparum malaria, Nature Medicine, 21, 314, 10.1038/nm.3812 · DOI
  25. Guy, 2015, Insights into the immunological properties of intrinsically disordered malaria proteins using proteome scale predictions, PLOS ONE, 10, 10.1371/journal.pone.0141729 · DOI
  26. Ho, 2021, Native structure of the RhopH complex, a key determinant of malaria parasite nutrient acquisition, PNAS, 118, 10.1073/pnas.2100514118 · DOI
  27. Horrocks, 2005, PfEMP1 expression is reduced on the surface of knobless Plasmodium falciparum infected erythrocytes, Journal of Cell Science, 118, 2507, 10.1242/jcs.02381 · DOI
  28. Ito, 2017, An essential dual-function complex mediates erythrocyte invasion and channel-mediated nutrient uptake in malaria parasites, eLife, 6, 10.7554/eLife.23485 · DOI
  29. Joergensen, 2010, Surface co-expression of two different PfEMP1 antigens on single Plasmodium falciparum-infected erythrocytes facilitates binding to ICAM1 and PECAM1, PLOS Pathogens, 6, 10.1371/journal.ppat.1001083 · DOI
  30. Jones, 2016, A versatile strategy for rapid conditional genome engineering using loxP sites in A small synthetic intron in Plasmodium falciparum, Scientific Reports, 6, 10.1038/srep21800 · DOI
  31. Jonsdottir, 2021, Characterisation of complexes formed by parasite proteins exported into the host cell compartment of Plasmodium falciparum infected red blood cells, Cellular Microbiology, 23, 10.1111/cmi.13332 · DOI
  32. Kats, 2014, An exported kinase (FIKK4.2) that mediates virulence-associated changes in Plasmodium falciparum-infected red blood cells, International Journal for Parasitology, 44, 319, 10.1016/j.ijpara.2014.01.003 · DOI
  33. Kim, 2018, BioSITe: a method for direct detection and quantitation of site-specific biotinylation, Journal of Proteome Research, 17, 759, 10.1021/acs.jproteome.7b00775 · DOI
  34. Knuepfer, 2017, Generating conditional gene knockouts in Plasmodium - a toolkit to produce stable DiCre recombinase-expressing parasite lines using CRISPR/Cas9, Scientific Reports, 7, 10.1038/s41598-017-03984-3 · DOI
  35. Kriek, 2003, Characterization of the pathway for transport of the cytoadherence-mediating protein, PfEMP1, to the host cell surface in malaria parasite-infected erythrocytes, Molecular Microbiology, 50, 1215, 10.1046/j.1365-2958.2003.03784.x · DOI
  36. Külzer, 2012, Plasmodium falciparum-encoded exported hsp70/hsp40 chaperone/co-chaperone complexes within the host erythrocyte, Cellular Microbiology, 14, 1784, 10.1111/j.1462-5822.2012.01840.x · DOI
  37. Lashuel, 2013, The many faces of α-synuclein: from structure and toxicity to therapeutic target, Nature Reviews. Neuroscience, 14, 38, 10.1038/nrn3406 · DOI
  38. Lee, 2019, Cutting back malaria: CRISPR/Cas9 genome editing of Plasmodium, Briefings in Functional Genomics, 18, 281, 10.1093/bfgp/elz012 · DOI
  39. Love, 2014, Moderated estimation of fold change and dispersion for RNA-seq data with DESeq2, Genome Biology, 15, 10.1186/s13059-014-0550-8 · DOI · Paper page
  40. Lubiana, 2020, Adhesion between P. falciparum infected erythrocytes and human endothelial receptors follows alternative binding dynamics under flow and febrile conditions, Scientific Reports, 10, 10.1038/s41598-020-61388-2 · DOI
  41. Maier, 2008, Exported proteins required for virulence and rigidity of Plasmodium falciparum-infected human erythrocytes, Cell, 134, 48, 10.1016/j.cell.2008.04.051 · DOI
  42. Nunes, 2010, Plasmodium falciparum FIKK kinase members target distinct components of the erythrocyte membrane, PLOS ONE, 5, 10.1371/journal.pone.0011747 · DOI
  43. Oberli, 2014, A Plasmodium falciparum PHIST protein binds the virulence factor PfEMP1 and comigrates to knobs on the host cell surface, FASEB Journal, 28, 4420, 10.1096/fj.14-256057 · DOI
  44. Perez-Riverol, 2019, The PRIDE database and related tools and resources in 2019: improving support for quantification data, Nucleic Acids Research, 47, D442, 10.1093/nar/gky1106 · DOI
  45. Pettersen, 2004, UCSF Chimera--A visualization system for exploratory research and analysis, Journal of Computational Chemistry, 25, 1605, 10.1002/jcc.20084 · DOI
  46. Proellocks, 2014, A lysine-rich membrane-associated PHISTb protein involved in alteration of the cytoadhesive properties of Plasmodium falciparum-infected red blood cells, FASEB Journal, 28, 3103, 10.1096/fj.14-250399 · DOI
  47. Przyborski, 2003, Maurer’s clefts--a novel secretory organelle?, Molecular and Biochemical Parasitology, 132, 17, 10.1016/s0166-6851(03)00212-3 · DOI
  48. Rug, 2006, The role of KAHRP domains in knob formation and cytoadherence of P falciparum-infected human erythrocytes, Blood, 108, 370, 10.1182/blood-2005-11-4624 · DOI
  49. Rug, 2014, Export of virulence proteins by malaria-infected erythrocytes involves remodeling of host actin cytoskeleton, Blood, 124, 3459, 10.1182/blood-2014-06-583054 · DOI
  50. Saito, 2017, Immune evasion of Plasmodium falciparum by RIFIN via inhibitory receptors, Nature, 552, 101, 10.1038/nature24994 · DOI
  51. Salanti, 2004, Evidence for the involvement of VAR2CSA in pregnancy-associated malaria, The Journal of Experimental Medicine, 200, 1197, 10.1084/jem.20041579 · DOI · Paper page
  52. Saridaki, 2009, Export of PfSBP1 to the Plasmodium falciparum Maurer’s clefts, Traffic, 10, 137, 10.1111/j.1600-0854.2008.00860.x · DOI
  53. Schindelin, 2012, Fiji: an open-source platform for biological-image analysis, Nature Methods, 9, 676, 10.1038/nmeth.2019 · DOI · Paper page
  54. Schureck, 2021, Malaria parasites use a soluble RhopH complex for erythrocyte invasion and an integral form for nutrient uptake, eLife, 10, 10.7554/eLife.65282 · DOI
  55. Shannon, 2003, Cytoscape: a software environment for integrated models of biomolecular interaction networks, Genome Research, 13, 2498, 10.1101/gr.1239303 · DOI · Paper page
  56. Tarr, 2014, A conserved domain targets exported PHISTb family proteins to the periphery of Plasmodium infected erythrocytes, Molecular and Biochemical Parasitology, 196, 29, 10.1016/j.molbiopara.2014.07.011 · DOI
  57. Thomas, 2016, Development and application of a simple plaque assay for the human malaria parasite Plasmodium falciparum, PLOS ONE, 11, 10.1371/journal.pone.0157873 · DOI
  58. Tyanova, 2016, The Perseus computational platform for comprehensive analysis of (prote)omics data, Nature Methods, 13, 731, 10.1038/nmeth.3901 · DOI · Paper page
  59. Udeshi, 2017, Antibodies to biotin enable large-scale detection of biotinylation sites on proteins, Nature Methods, 14, 1167, 10.1038/nmeth.4465 · DOI
  60. Udomsangpetch, 2002, Febrile temperatures induce cytoadherence of ring-stage Plasmodium falciparum-infected erythrocytes, PNAS, 99, 11825, 10.1073/pnas.172398999 · DOI
  61. Watermeyer, 2016, A spiral scaffold underlies cytoadherent knobs in Plasmodium falciparum-infected erythrocytes, Blood, 127, 343, 10.1182/blood-2015-10-674002 · DOI
  62. World Health Organization. 2022. World malaria report. Geneva.
  63. Yang, 2020, Interaction analysis of a Plasmodium falciparum PHISTa-like protein and PfEMP1 proteins, Frontiers in Microbiology, 11, 10.3389/fmicb.2020.611190 · DOI

Metadata

Authors
Davies, H., Belda, H., Broncel, M., Dalimot, J., & Treeck, M.
Affiliations
The Francis Crick Institute (GB)
Corresponding author
Treeck, Moritz
Venue
eLife
Published
2023-09-22
Volume
12
ISSN
2050-084X (ISSN-L)
OpenAlex
W4386944183
Cited by
17
References
6
Citations by year
2026: 3 · 2025: 8 · 2024: 4 · 2023: 1
FWCI
4.10
Type
journal article
Language
en
Open access
Locations
  • eLife (publishedVersion, cc-by)
  • bioRxiv (Cold Spring Harbor Laboratory) (acceptedVersion, cc-by)
  • PubMed Central (publishedVersion, cc-by)
  • PubMed (publishedVersion)
  • DOAJ (DOAJ: Directory of Open Access Journals) (submittedVersion, cc-by-sa)
  • Figshare (submittedVersion, cc-by)
  • The Francis Crick Institute (cc-by)
Funders
Francis Crick Institute (CC2132, CC0199)
Topics
  • Health Sciences › Medicine › Public Health, Environmental and Occupational Health › Malaria Research and Control
  • Life Sciences › Biochemistry, Genetics and Molecular Biology › Cell Biology › Biotin and Related Studies
  • Life Sciences › Biochemistry, Genetics and Molecular Biology › Molecular Biology › Biochemical and Structural Characterization
Keywords
TurboID proximity labeling, PfEMP1, Plasmodium falciparum, conditional knockout, protein-protein interaction, protein localization, malaria virulence, infected erythrocytes
MeSH terms
Animals, Erythrocytes, Humans, Malaria, Parasites, Peptides, Phosphotransferases, Plasmodium falciparum, Protozoan Proteins, Malaria, Falciparum

About these checks

Registry, retraction, Cites and statistics results are computed, not judged, with one exception: a printed reference that no index lists is read once by a model before it counts as a citation error. Claims are extracted by a model and kept only when their quote appears verbatim in the text; each cited source is then checked, with a model’s help, for whether it says what the claim relies on. Those verdicts can be wrong — read the claim’s quote and the cited source before relying on one.

Statistics and arithmetic are recomputed, not judged.

Confidence bands are shown only for fields calibrated on our annotated test set. None is calibrated yet, so no band is shown.

What counts as a claim ›How we measure confidence ›How we check this ›

Are you an author, or do you see a problem with this page? Request a review