Cited by 2Tuberculosis Research and EpidemiologyImmune responses and vaccinationsImmune Response and Inflammation

The DOI matches its Crossref record; 2 of the 2 references it cites were found in a registry or an index.

Tribbles1 is host protective during in vivo mycobacterial infection

Open access

Published version of a preprint

Abstract

Tuberculosis is a major global health problem and is one of the top 10 causes of death worldwide. There is a pressing need for new treatments that circumvent emerging antibiotic resistance. Mycobacterium tuberculosis parasitises macrophages, reprogramming them to establish a niche in which to proliferate, therefore macrophage manipulation is a potential host-directed therapy if druggable molecular targets could be identified. The pseudokinase Tribbles1 (Trib1) regulates multiple innate immune processes and inflammatory profiles making it a potential drug target in infections. Trib1 controls macrophage function, cytokine production, and macrophage polarisation. Despite wide-ranging effects on leukocyte biology, data exploring the roles of Tribbles in infection in vivo are limited. Here, we identify that human Tribbles1 is expressed in monocytes and is upregulated at the transcript level after stimulation with mycobacterial antigen. To investigate the mechanistic roles of Tribbles in the host response to mycobacteria in vivo, we used a zebrafish Mycobacterium marinum (Mm) infection tuberculosis model. Zebrafish Tribbles family members were characterised and shown to have substantial mRNA and protein sequence homology to their human orthologues. trib1 overexpression was host-protective against Mm infection, reducing burden by approximately 50%. Conversely, trib1 knockdown/knockout exhibited increased infection. Mechanistically, trib1 overexpression significantly increased the levels of proinflammatory factors il-1β and nitric oxide. The host-protective effect of trib1 was found to be dependent on the E3 ubiquitin kinase Cop1. These findings highlight the importance of Trib1 and Cop1 as immune regulators during infection in vivo and suggest that enhancing macrophage TRIB1 levels may provide a tractable therapeutic intervention to improve bacterial infection outcomes in tuberculosis.

Overview

The claims and statistics of this paper haven’t been checked yet.

Run the check — free, no account needed. It reads the open-access text and checks the sources it cites.

A few free checks a day · papers already verified open instantly · results are public

Integrity signals

Registry

Crossref · 10.7554/elife.95980

Cites

2 of 2 references verified0 citation errors · 0 not checkable

Statistics

Figures

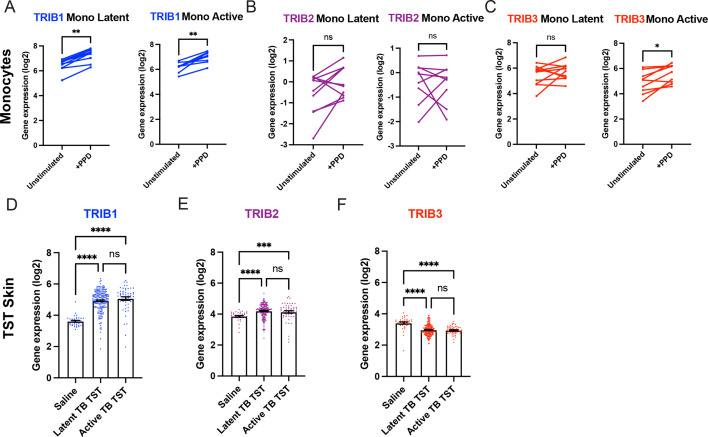
Figure 1. Expression of TRIB1 in human monocytes and tissues is elevated after mycobacterial antigen stimulation. (A–C) Expression of TRIB1, TRIB2, and TRIB3 transcripts in human CD14+ monocytes in patients with active or latent TB before and after 4 hr of Mtb protein derivative (PPD) stimulation in vitro. Each paired data point represents one individual, with active or latent TB (n = 9 and n = 7, respectively). Statistical significance determined by paired Wilcoxon tests. p values shown are: *p < 0.05 and **p < 0.01. (D–F) Expression of TRIB1, TRIB2, and TRIB3 within in saline injected human skin and from biopsies of the site of a tuberculin skin test (TST) in patients with active or latent TB. Each point represents one individual with bars for each group representing mean gene expression. n = 48 and 191 individuals with active or latent TB, respectively. Statistical significance determined via Kruskal–Wallis with multiple comparisons. p values shown are: ***p < 0.001 and ****p < 0.0001.
Figure 1. Expression of TRIB1 in human monocytes and tissues is elevated after mycobacterial antigen stimulation. (A–C) Expression of TRIB1, TRIB2, and TRIB3 transcripts in human CD14+ monocytes in patients with active or latent TB before and after 4 hr of Mtb protein derivative (PPD) stimulation in vitro. Each paired data point represents one individual, with active or latent TB (n = 9 and n = 7, respectively). Statistical significance determined by paired Wilcoxon tests. p values shown are: *p < 0.05 and **p < 0.01. (D–F) Expression of TRIB1, TRIB2, and TRIB3 within in saline injected human skin and from biopsies of the site of a tuberculin skin test (TST) in patients with active or latent TB. Each point represents one individual with bars for each group representing mean gene expression. n = 48 and 191 individuals with active or latent TB, respectively. Statistical significance determined via Kruskal–Wallis with multiple comparisons. p values shown are: ***p < 0.001 and ****p < 0.0001.CC BY · PubMed Central
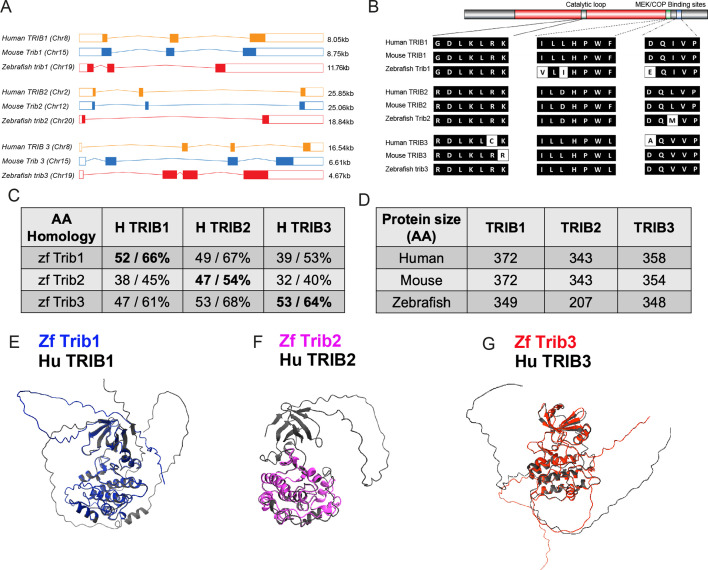
Figure 2. Zebrafish Tribbles share homology with their human and mice counterparts. (A) The gene organisation of human (orange) TRIB1, mouse (blue) Trib1, and zebrafish (red). Exon maps produced from Ensembl database. Chromosome number location (chr) and transcript sizes in kilobases (kb) are shown. (B) Comparison of the three catalytic domains of Tribbles; the pseudokinase catalytic loop and mitogen-activated protein kinase kinase (MEK)/constitutive photomorphogenic 1 (COP1) bind sites, reveals high homology between species. (C) NCBI BLAST Global align revealed a high amino acid (AA) homology between zebrafish (zf) and human Tribbles protein sequences. Values described are positives/identities. (D) Protein sizes of the first and largest protein-coding transcript of each gene are depicted in the number of AA, values obtained from Ensembl and Uniprot databases. (E–G) Protein overlays of predicted structures (AlphaFold DB) of zebrafish (coloured) and human (black) sequences.
Figure 2. Zebrafish Tribbles share homology with their human and mice counterparts. (A) The gene organisation of human (orange) TRIB1, mouse (blue) Trib1, and zebrafish (red). Exon maps produced from Ensembl database. Chromosome number location (chr) and transcript sizes in kilobases (kb) are shown. (B) Comparison of the three catalytic domains of Tribbles; the pseudokinase catalytic loop and mitogen-activated protein kinase kinase (MEK)/constitutive photomorphogenic 1 (COP1) bind sites, reveals high homology between species. (C) NCBI BLAST Global align revealed a high amino acid (AA) homology between zebrafish (zf) and human Tribbles protein sequences. Values described are positives/identities. (D) Protein sizes of the first and largest protein-coding transcript of each gene are depicted in the number of AA, values obtained from Ensembl and Uniprot databases. (E–G) Protein overlays of predicted structures (AlphaFold DB) of zebrafish (coloured) and human (black) sequences.CC BY · PubMed Central
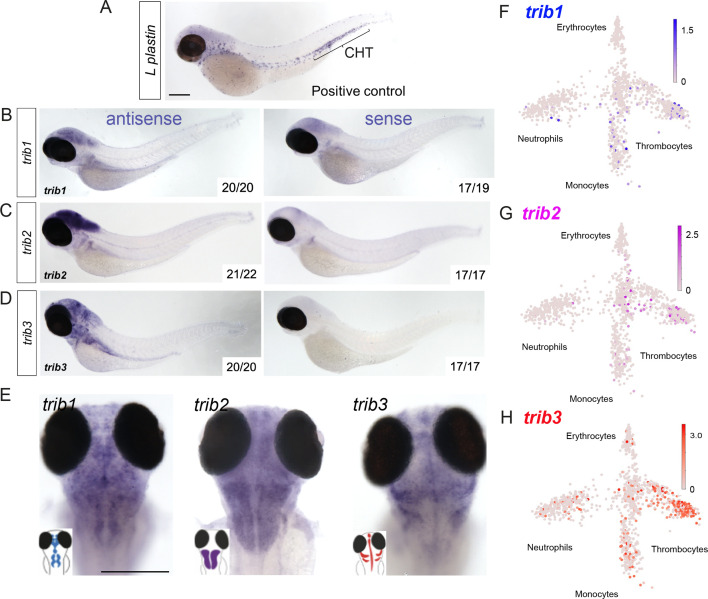
Figure 3. Expression of zebrafish tribbles are located in the brain in larvae and in immune cell subpopulations in adults. (A) Whole-mount in situ hybridisation of the pan-leukocyte marker L-plastin was used as a positive control to stain leukocytes, present predominantly in the caudal hematopoietic tissue (CHT). Scale bar = 200 µm. (B) Representative images of antisense and sense (control) whole-mount in situ hybridisation of tribbles1. Numbers correspond to number of fish with depictured pattern out of total fish imaged. N = 19–20 fish. (C) Antisense and sense (control) whole-mount in situ hybridisation of tribbles2. N = 17–22 fish. (D) Antisense and sense (control) whole-mount in situ hybridisation of tribbles3. N = 17–20 fish. (E) Magnified dorsal views (×8 magnification) showing distinct expression of each trib isoform in the brain (representative images from each group shown). Scale bar = 200 µm. (F–H) Gene expression of adult zebrafish leukocytes determined using the Zebrafish Blood Atlas (Athanasiadis et al., 2017). Each point represents a separate scRNAseq sample (cell); replicates performed across multiple zebrafish wildtype and transgenic strains. Each arm of schematic indicates a separate blood cell population (labelled). Deeper colour indicates higher expression (log10 scale bars described for each gene).
Figure 3. Expression of zebrafish tribbles are located in the brain in larvae and in immune cell subpopulations in adults. (A) Whole-mount in situ hybridisation of the pan-leukocyte marker L-plastin was used as a positive control to stain leukocytes, present predominantly in the caudal hematopoietic tissue (CHT). Scale bar = 200 µm. (B) Representative images of antisense and sense (control) whole-mount in situ hybridisation of tribbles1. Numbers correspond to number of fish with depictured pattern out of total fish imaged. N = 19–20 fish. (C) Antisense and sense (control) whole-mount in situ hybridisation of tribbles2. N = 17–22 fish. (D) Antisense and sense (control) whole-mount in situ hybridisation of tribbles3. N = 17–20 fish. (E) Magnified dorsal views (×8 magnification) showing distinct expression of each trib isoform in the brain (representative images from each group shown). Scale bar = 200 µm. (F–H) Gene expression of adult zebrafish leukocytes determined using the Zebrafish Blood Atlas (Athanasiadis et al., 2017). Each point represents a separate scRNAseq sample (cell); replicates performed across multiple zebrafish wildtype and transgenic strains. Each arm of schematic indicates a separate blood cell population (labelled). Deeper colour indicates higher expression (log10 scale bars described for each gene).CC BY · PubMed Central
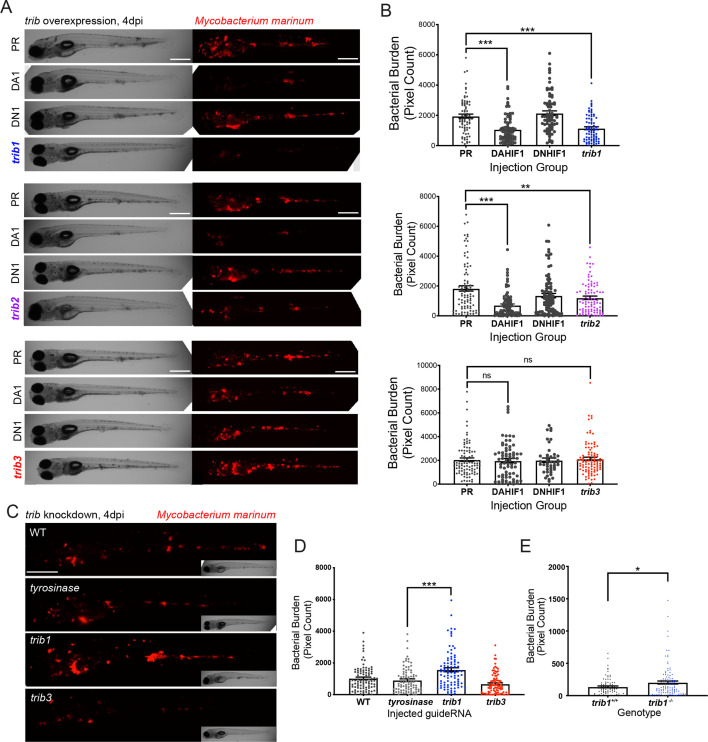
Figure 4. trib1 overexpression is host protective against Mm infection. (A) Stereo-fluorescence micrographs of Mm mCherry infected 4 dpi larvae after injection at the single-cell stage with dominant active hif-1α (DA1), dominant negative hif-1α (DN1), trib1, trib2, trib3 RNAs and phenol red (PR) as a negative vehicle control. DA1 and DN1 are RNA controls with DA1 having previously been shown to reduce infection levels (Elks et al., 2013). Scale bar = 200 µm. (B) Bacterial burden of larvae shown in (A). Data shown are mean ± standard error of the mean (SEM), n = 76–77 in trib1, n = 86–89 in trib2, and n = 43–95 in trib3, accumulated from three independent experiments for each trib gene. Statistical significance determined via one-way analysis of variance (ANOVA) with Bonferroni’s multiple comparisons. p values shown are: **p < 0.01 and ***p < 0.001. (C) Stereo-fluorescence micrographs of Mm mCherry infected 4 dpi larvae after injection with tyrosinase (control), trib1 and trib3 CRISPR guides (CRISPants). Scale bar = 200 µm. (D) Bacterial burden of larvae shown in (C). Data shown are mean ± SEM, n = 87–90 fish accumulated from three independent experiments. Statistical significance determined via one-way ANOVA with Bonferroni’s multiple comparisons. p values shown are: ***p < 0.001. (E) Bacterial burden of trib1−/− stable knockout larvae compared to wildtype (trib1+/+) siblings. Data shown are mean ± SEM, n = 82–114 fish accumulated from four independent experiments. Statistical significance determined via an unpaired t-test. p values shown are: *p < 0.05.
Figure 4. trib1 overexpression is host protective against Mm infection. (A) Stereo-fluorescence micrographs of Mm mCherry infected 4 dpi larvae after injection at the single-cell stage with dominant active hif-1α (DA1), dominant negative hif-1α (DN1), trib1, trib2, trib3 RNAs and phenol red (PR) as a negative vehicle control. DA1 and DN1 are RNA controls with DA1 having previously been shown to reduce infection levels (Elks et al., 2013). Scale bar = 200 µm. (B) Bacterial burden of larvae shown in (A). Data shown are mean ± standard error of the mean (SEM), n = 76–77 in trib1, n = 86–89 in trib2, and n = 43–95 in trib3, accumulated from three independent experiments for each trib gene. Statistical significance determined via one-way analysis of variance (ANOVA) with Bonferroni’s multiple comparisons. p values shown are: **p < 0.01 and ***p < 0.001. (C) Stereo-fluorescence micrographs of Mm mCherry infected 4 dpi larvae after injection with tyrosinase (control), trib1 and trib3 CRISPR guides (CRISPants). Scale bar = 200 µm. (D) Bacterial burden of larvae shown in (C). Data shown are mean ± SEM, n = 87–90 fish accumulated from three independent experiments. Statistical significance determined via one-way ANOVA with Bonferroni’s multiple comparisons. p values shown are: ***p < 0.001. (E) Bacterial burden of trib1−/− stable knockout larvae compared to wildtype (trib1+/+) siblings. Data shown are mean ± SEM, n = 82–114 fish accumulated from four independent experiments. Statistical significance determined via an unpaired t-test. p values shown are: *p < 0.05.CC BY · PubMed Central
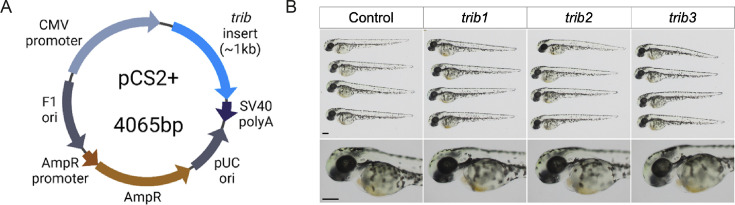
Figure 4—figure supplement 1. tribbles RNA overexpression caused no observable developmental defects. (A) cDNA sequences of zebrafish trib isoforms (trib1, trib2, and trib3) were cloned into the expression plasmid pCS2+. (B) mRNA of trib isoforms (100 ng/μl) was synthesised from pCS2+ plasmids and 1 nl was injected into one-cell stage zebrafish embryos, which resulted in healthy development. Larvae imaged at 2 dpf using stereoscope at ×4 magnification (head images at ×8 magnification). Scale bars = 100 µM.
Figure 4—figure supplement 1. tribbles RNA overexpression caused no observable developmental defects. (A) cDNA sequences of zebrafish trib isoforms (trib1, trib2, and trib3) were cloned into the expression plasmid pCS2+. (B) mRNA of trib isoforms (100 ng/μl) was synthesised from pCS2+ plasmids and 1 nl was injected into one-cell stage zebrafish embryos, which resulted in healthy development. Larvae imaged at 2 dpf using stereoscope at ×4 magnification (head images at ×8 magnification). Scale bars = 100 µM.CC BY · PubMed Central
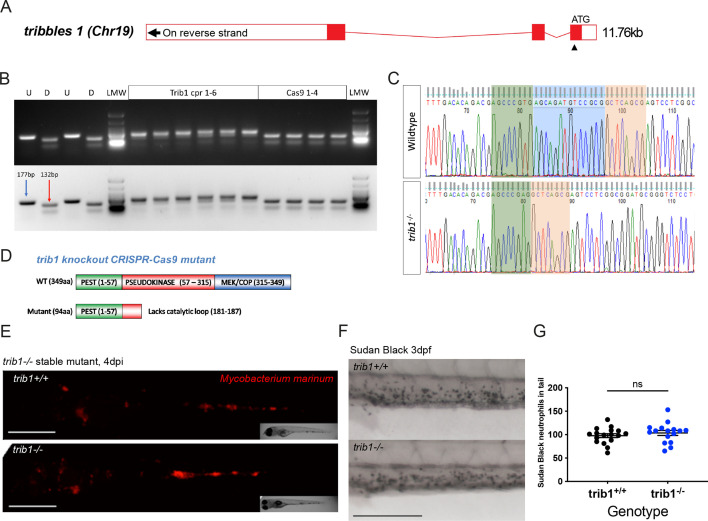
Figure 4—figure supplement 2. CRISPR guide RNAs against trib1 and trib3 efficiently disrupt a restriction digest site. (A) Electrophoresis gel of larvae injected with trib1 guide RNA with a SacII restriction digest. The undigested DNA band, obtained using the polymerase chain reaction (PCR), is 177 bp and the successfully digested band is 132 bp. Two uninjected fish were used as controls without (U) and with (D) digestion. Four tyrosinase (tyr) control guide injected larvae had conserved SacII sites while 6/6 trib1 larvae did not digest with SacII indicating a genomic disruption at the CRISPR PAM site. First and last lanes of gel images contain Low Molecular Weight DNA Ladder (New England Biolabs, N3233) for reference. (B) Electrophoresis gel of larvae injected with trib3 guide RNA with a MwoI restriction digest. The undigested PCR band is 186 bp and the successfully digested band is 103 bp. Two uninjected fish were used as controls without (U) and with (D) digestion. Four tyrosinase (tyr) guide injected larvae had conserved MwoI sites while 5/6 trib3 larvae did not digest with MwoI indicating a genomic disruption at the CRISPR PAM site. First and last lanes of gel images contain NEB Low Molecular Weight ladder for reference.
Figure 4—figure supplement 2. CRISPR guide RNAs against trib1 and trib3 efficiently disrupt a restriction digest site. (A) Electrophoresis gel of larvae injected with trib1 guide RNA with a SacII restriction digest. The undigested DNA band, obtained using the polymerase chain reaction (PCR), is 177 bp and the successfully digested band is 132 bp. Two uninjected fish were used as controls without (U) and with (D) digestion. Four tyrosinase (tyr) control guide injected larvae had conserved SacII sites while 6/6 trib1 larvae did not digest with SacII indicating a genomic disruption at the CRISPR PAM site. First and last lanes of gel images contain Low Molecular Weight DNA Ladder (New England Biolabs, N3233) for reference. (B) Electrophoresis gel of larvae injected with trib3 guide RNA with a MwoI restriction digest. The undigested PCR band is 186 bp and the successfully digested band is 103 bp. Two uninjected fish were used as controls without (U) and with (D) digestion. Four tyrosinase (tyr) guide injected larvae had conserved MwoI sites while 5/6 trib3 larvae did not digest with MwoI indicating a genomic disruption at the CRISPR PAM site. First and last lanes of gel images contain NEB Low Molecular Weight ladder for reference.CC BY · PubMed Central
Figure 4—figure supplement 3. Generation of a tribbles1 stable mutant line. (A) Schematic of zebrafish trib1 gene exons, with arrowhead showing location of CRISPR guide RNA PAM site in exon 1. (B) Electrophoresis gel of larvae injected with trib1 guide RNA with a SacII restriction digest. The undigested PCR band is 177 bp and the successfully digested band is 132 bp. Two uninjected fish were used as controls without (U) and with (D) digestion. Four cas9 only injected larvae had conserved SacII sites while 6/6 trib1 larvae did not digest with SacII indicating a genomic disruption at the CRISPR PAM site. LMW = NEB Low Molecular Weight ladder for reference. (C) Sequencing trace of a trib1−/− mutant versus a wildtype sibling, demonstrating a 14-bp deletion (loss of AGCAGATGTCCGCG). (D) Schematic showing predicted truncated protein (Δ94aa) caused by trib1−/− mutation compared to the wildtype protein. (E) Stereo-fluorescence micrographs of Mm mCherry infected 4 dpi trib1−/− mutant and wildtype (trib1+/+) sibling larvae. Scale bar = 200 µM. (F) Sudan Black staining of neutrophils in 3 dpf trib1−/− mutant and wildtype (trib1+/+) sibling larvae. Scale bar = 200 µM. (G) Number of Sudan Black-positive neutrophils in the tail of 3 dpf trib1−/− mutant and wildtype (trib1+/+) sibling larvae. Data shown are mean ± standard error of the mean (SEM), n = 16–17 fish accumulated from two independent experiments. Statistical significance (no significance, ns) determined via an unpaired t-test.
Figure 4—figure supplement 3. Generation of a tribbles1 stable mutant line. (A) Schematic of zebrafish trib1 gene exons, with arrowhead showing location of CRISPR guide RNA PAM site in exon 1. (B) Electrophoresis gel of larvae injected with trib1 guide RNA with a SacII restriction digest. The undigested PCR band is 177 bp and the successfully digested band is 132 bp. Two uninjected fish were used as controls without (U) and with (D) digestion. Four cas9 only injected larvae had conserved SacII sites while 6/6 trib1 larvae did not digest with SacII indicating a genomic disruption at the CRISPR PAM site. LMW = NEB Low Molecular Weight ladder for reference. (C) Sequencing trace of a trib1−/− mutant versus a wildtype sibling, demonstrating a 14-bp deletion (loss of AGCAGATGTCCGCG). (D) Schematic showing predicted truncated protein (Δ94aa) caused by trib1−/− mutation compared to the wildtype protein. (E) Stereo-fluorescence micrographs of Mm mCherry infected 4 dpi trib1−/− mutant and wildtype (trib1+/+) sibling larvae. Scale bar = 200 µM. (F) Sudan Black staining of neutrophils in 3 dpf trib1−/− mutant and wildtype (trib1+/+) sibling larvae. Scale bar = 200 µM. (G) Number of Sudan Black-positive neutrophils in the tail of 3 dpf trib1−/− mutant and wildtype (trib1+/+) sibling larvae. Data shown are mean ± standard error of the mean (SEM), n = 16–17 fish accumulated from two independent experiments. Statistical significance (no significance, ns) determined via an unpaired t-test.CC BY · PubMed Central
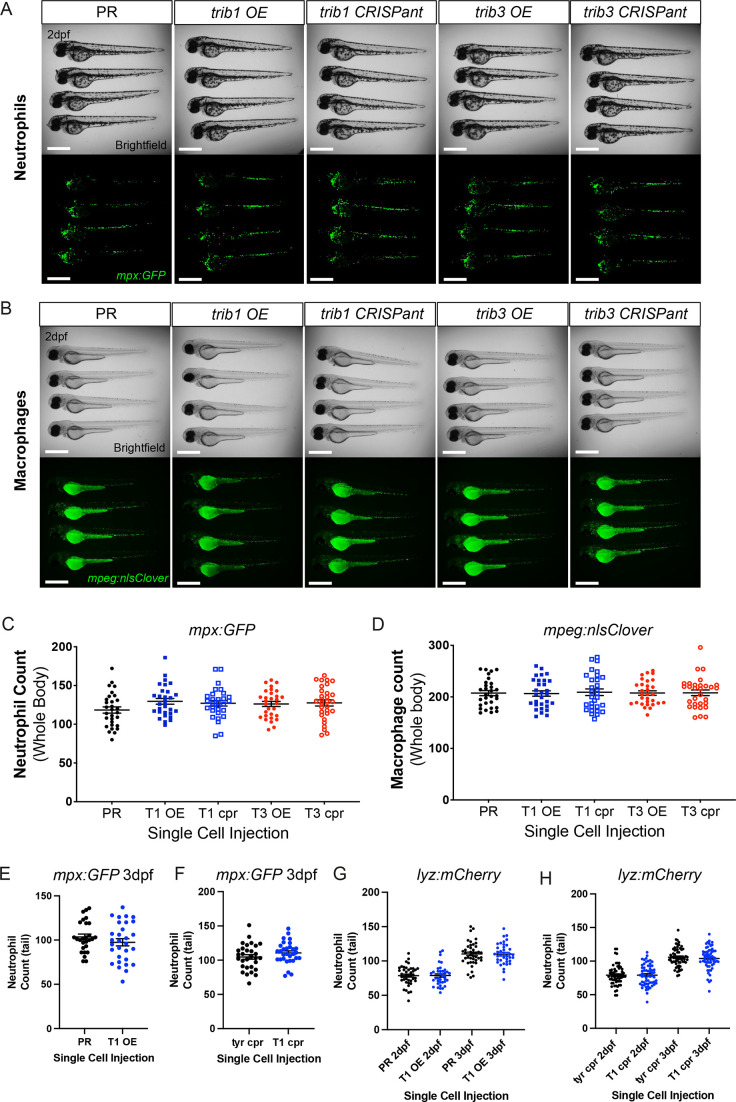
Figure 5. trib manipulation does not affect leukocyte number in zebrafish larvae. (A) Example brightfield and fluorescent micrographs of neutrophils (Tg(mpx:GFP)i114) in four 2 dpf larvae injected at the one-cell stage with either phenol red (PR), trib1 RNA overexpression (OE), trib1 CRISPant, trib3 RNA overexpression (OE), or trib3 CRISPant. Scale bars = 200 µM. (B) Example brightfield and fluorescent micrographs of macrophages (Tg(mpeg:nlsclover)sh436) in four 2 dpf larvae injected at the one-cell stage with either PR, trib1 RNA overexpression (OE), trib1 CRISPant, trib3 RNA overexpression (OE), or trib3 CRISPant. Scale bars = 200 µM. (C) Wholebody neutrophil numbers (Tg(mpx:GFP)i114) in 2 dpf larvae injected at the one-cell stage with either PR, trib1 RNA overexpression (T1 OE), trib1 CRISPant (T1 cpr), trib3 RNA overexpression (T3 OE), or trib3 CRISPant (T3 cpr). Data shown are mean ± standard error of the mean (SEM), n = 30 fish per group. (D) Wholebody macrophage numbers (Tg(mpeg:nlsclover)sh436) in 2 dpf larvae injected at the one-cell stage with either PR, trib1 RNA overexpression (T1 OE), trib1 CRISPant (T1 cpr), trib3 RNA overexpression (T3 OE), or trib3 CRISPant (T3 cpr). Data shown are mean ± SEM, n = 30 fish per group. (E) Total tail neutrophil numbers (Tg(mpx:GFP)i114) in 3 dpf larvae injected at the one-cell stage with either PR or trib1 RNA overexpression (T1 OE). Data shown are mean ± SEM, n = 30 fish per group. (F) Total tail neutrophil numbers (Tg(mpx:GFP)i114) in 3 dpf larvae injected at the one-cell stage with either tyrosinase control CRISPant (tyr cpr) or trib1 CRISPant (T1 cpr). Data shown are mean ± SEM, n = 30 fish per group. (G) Total tail neutrophil numbers (Tg(lyz: nfsB.mCherry)sh260) in 2 and 3 dpf larvae injected at the one-cell stage with either PR or trib1 RNA overexpression (T1 OE). Data shown are mean ± SEM, n = 37–42 fish per group. (H) Total tail neutrophil numbers (Tg(lyz: nfsB.mCherry)sh260) in 2 and 3 dpf larvae injected at the one-cell stage with either tyrosinase control CRISPant (tyr cpr) or trib1 CRISPant (T1 cpr). Data shown are mean ± SEM, n = 60 fish per group.
Figure 5. trib manipulation does not affect leukocyte number in zebrafish larvae. (A) Example brightfield and fluorescent micrographs of neutrophils (Tg(mpx:GFP)i114) in four 2 dpf larvae injected at the one-cell stage with either phenol red (PR), trib1 RNA overexpression (OE), trib1 CRISPant, trib3 RNA overexpression (OE), or trib3 CRISPant. Scale bars = 200 µM. (B) Example brightfield and fluorescent micrographs of macrophages (Tg(mpeg:nlsclover)sh436) in four 2 dpf larvae injected at the one-cell stage with either PR, trib1 RNA overexpression (OE), trib1 CRISPant, trib3 RNA overexpression (OE), or trib3 CRISPant. Scale bars = 200 µM. (C) Wholebody neutrophil numbers (Tg(mpx:GFP)i114) in 2 dpf larvae injected at the one-cell stage with either PR, trib1 RNA overexpression (T1 OE), trib1 CRISPant (T1 cpr), trib3 RNA overexpression (T3 OE), or trib3 CRISPant (T3 cpr). Data shown are mean ± standard error of the mean (SEM), n = 30 fish per group. (D) Wholebody macrophage numbers (Tg(mpeg:nlsclover)sh436) in 2 dpf larvae injected at the one-cell stage with either PR, trib1 RNA overexpression (T1 OE), trib1 CRISPant (T1 cpr), trib3 RNA overexpression (T3 OE), or trib3 CRISPant (T3 cpr). Data shown are mean ± SEM, n = 30 fish per group. (E) Total tail neutrophil numbers (Tg(mpx:GFP)i114) in 3 dpf larvae injected at the one-cell stage with either PR or trib1 RNA overexpression (T1 OE). Data shown are mean ± SEM, n = 30 fish per group. (F) Total tail neutrophil numbers (Tg(mpx:GFP)i114) in 3 dpf larvae injected at the one-cell stage with either tyrosinase control CRISPant (tyr cpr) or trib1 CRISPant (T1 cpr). Data shown are mean ± SEM, n = 30 fish per group. (G) Total tail neutrophil numbers (Tg(lyz: nfsB.mCherry)sh260) in 2 and 3 dpf larvae injected at the one-cell stage with either PR or trib1 RNA overexpression (T1 OE). Data shown are mean ± SEM, n = 37–42 fish per group. (H) Total tail neutrophil numbers (Tg(lyz: nfsB.mCherry)sh260) in 2 and 3 dpf larvae injected at the one-cell stage with either tyrosinase control CRISPant (tyr cpr) or trib1 CRISPant (T1 cpr). Data shown are mean ± SEM, n = 60 fish per group.CC BY · PubMed Central
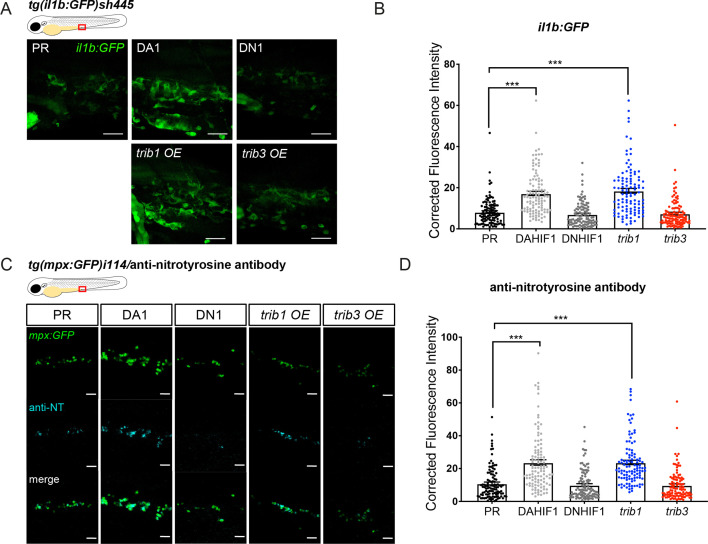
Figure 6. trib1 overexpression increases production of proinflammatory il-1β and nitrotyrosine in the absence of infection. (A) Fluorescent confocal micrographs of 2 dpf caudal vein region of TgBAC(il-1β:eGFP)sh445 transgenic larvae. il-1β:GFP expression was detected by GFP levels. Larvae were injected at the one-cell stage with dominant negative (DN) or dominant active (DA) Hif-1α or phenol red (PR) controls and trib1 and trib3 test RNAs. Scale bars = 25 μm. (B) Corrected fluorescence intensity levels of il-1β:GFP confocal z-stacks in uninfected larvae at 2 dpf of data shown in (A). Dominant active Hif-1α (DA1) controls and trib1 fish had significantly increased il-1β:GFP levels in the absence of Mm bacterial challenge compared to PR and dominant negative Hif-1α (DN1) injected controls and trib3 RNA injected embryos. Data shown are mean ± standard error of the mean (SEM), n = 108 cells from 18 embryos accumulated from 3 independent experiments. Statistical significance was determined using one-way analysis of variance (ANOVA) with Bonferroni’s multiple comparisons post hoc test. p values shown are: ***p < 0.001. (C) Fluorescence confocal z-stacks of the caudal vein region of 2 dpf mpx:GFP larvae (neutrophils) immune labelled with anti-nitrotyrosine (cyan) in the absence of Mm infection. Larvae were injected at the one-cell stage with dominant negative (DN) or dominant active (DA) Hif-1α or PR controls and trib1 and trib3 test RNAs. Scale bars = 25 μm. (D) Corrected fluorescence intensity levels of anti-nitrotyrosine antibody confocal z-stacks shown in (C). Data shown are mean ± SEM, n = 108 cells from 18 embryos accumulated from 3 independent experiments. Statistical significance was determined using one-way ANOVA with Bonferroni’s multiple comparisons post hoc test. p values shown are: ***p < 0.001.
Figure 6. trib1 overexpression increases production of proinflammatory il-1β and nitrotyrosine in the absence of infection. (A) Fluorescent confocal micrographs of 2 dpf caudal vein region of TgBAC(il-1β:eGFP)sh445 transgenic larvae. il-1β:GFP expression was detected by GFP levels. Larvae were injected at the one-cell stage with dominant negative (DN) or dominant active (DA) Hif-1α or phenol red (PR) controls and trib1 and trib3 test RNAs. Scale bars = 25 μm. (B) Corrected fluorescence intensity levels of il-1β:GFP confocal z-stacks in uninfected larvae at 2 dpf of data shown in (A). Dominant active Hif-1α (DA1) controls and trib1 fish had significantly increased il-1β:GFP levels in the absence of Mm bacterial challenge compared to PR and dominant negative Hif-1α (DN1) injected controls and trib3 RNA injected embryos. Data shown are mean ± standard error of the mean (SEM), n = 108 cells from 18 embryos accumulated from 3 independent experiments. Statistical significance was determined using one-way analysis of variance (ANOVA) with Bonferroni’s multiple comparisons post hoc test. p values shown are: ***p < 0.001. (C) Fluorescence confocal z-stacks of the caudal vein region of 2 dpf mpx:GFP larvae (neutrophils) immune labelled with anti-nitrotyrosine (cyan) in the absence of Mm infection. Larvae were injected at the one-cell stage with dominant negative (DN) or dominant active (DA) Hif-1α or PR controls and trib1 and trib3 test RNAs. Scale bars = 25 μm. (D) Corrected fluorescence intensity levels of anti-nitrotyrosine antibody confocal z-stacks shown in (C). Data shown are mean ± SEM, n = 108 cells from 18 embryos accumulated from 3 independent experiments. Statistical significance was determined using one-way ANOVA with Bonferroni’s multiple comparisons post hoc test. p values shown are: ***p < 0.001.CC BY · PubMed Central
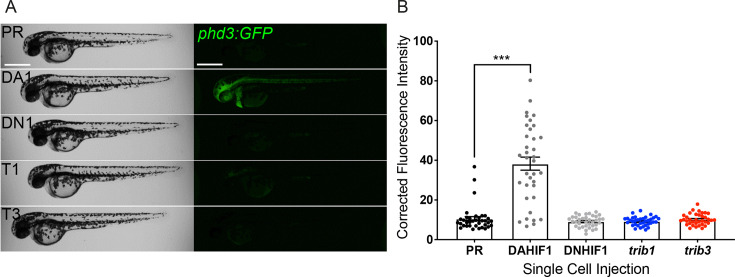
Figure 7. trib1 and trib3 overexpression do not induce expression of the Hif reporter phd3:GFP. (A) Stereo-fluorescence micrographs of 2 dpf phd3:GFP larvae injected with phenol red (PR), dominant active hif-1α (DA1) and dominant negative Hif-1α (DN1) RNA controls alongside trib1 (T1) and trib3 (T3) RNA. Scale bars = 200 µM. (B) Corrected fluorescence intensity levels of phd3:GFP (Hif reporter) larvae shown in (A). Data shown are mean ± standard error of the mean (SEM), n = 30 embryos accumulated from three independent experiments. Statistical significance determined through one-way analysis of variance (ANOVA) with multiple comparisons. p values shown are: ***p < 0.001.
Figure 7. trib1 and trib3 overexpression do not induce expression of the Hif reporter phd3:GFP. (A) Stereo-fluorescence micrographs of 2 dpf phd3:GFP larvae injected with phenol red (PR), dominant active hif-1α (DA1) and dominant negative Hif-1α (DN1) RNA controls alongside trib1 (T1) and trib3 (T3) RNA. Scale bars = 200 µM. (B) Corrected fluorescence intensity levels of phd3:GFP (Hif reporter) larvae shown in (A). Data shown are mean ± standard error of the mean (SEM), n = 30 embryos accumulated from three independent experiments. Statistical significance determined through one-way analysis of variance (ANOVA) with multiple comparisons. p values shown are: ***p < 0.001.CC BY · PubMed Central
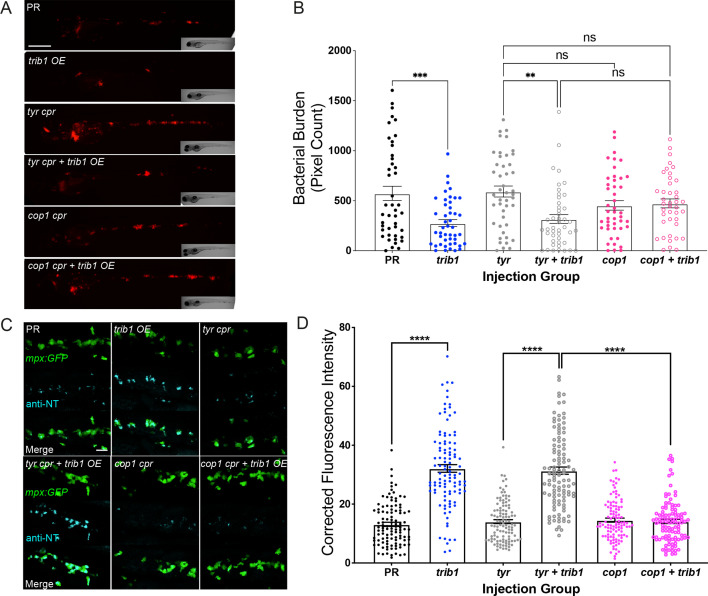
Figure 8. The host-protective effect of trib1 overexpression requires cop1. (A) Stereo-fluorescence micrographs of Mm mCherry infected 4 dpi larvae after injection with trib1 RNA (overexpression, OE) and cop1 guide RNA (CRISPants, cpr) using phenol red (PR, vehicle) and tyrosinase (tyr cpr, unrelated guide RNA) CRISPants as negative controls. Scale bar = 200 µM. (B) Bacterial burden of larvae shown in (A). Data shown are mean ± standard error of the mean (SEM), n = 71–76 accumulated from three independent experiments. Statistical significance determined via one-way analysis of variance (ANOVA) with Bonferroni’s multiple comparisons. p values shown are: **p < 0.01 and ***p < 0.001. (C) Fluorescence confocal z-stacks of the caudal vein region of 2 dpf mpx:GFP larvae (neutrophils) immune labelled with anti-nitrotyrosine (cyan) in the absence of Mm infection. Larvae were injected at the one-cell stage with trib1 RNA (overexpression, OE) and cop1 guide RNA (CRISPants, cpr) using PR (vehicle) and tyrosinase (unrelated guide RNA) CRISPants as negative controls. Scale bar = 30 μm. (D) Corrected fluorescence intensity levels of anti-nitrotyrosine antibody confocal z-stacks shown in (C). Data shown are mean ± SEM, n = 108 cells from 18 embryos accumulated from three independent experiments. Statistical significance was determined using one-way ANOVA with Bonferroni’s multiple comparisons post hoc test. p values shown are: ****p < 0.0001.
Figure 8. The host-protective effect of trib1 overexpression requires cop1. (A) Stereo-fluorescence micrographs of Mm mCherry infected 4 dpi larvae after injection with trib1 RNA (overexpression, OE) and cop1 guide RNA (CRISPants, cpr) using phenol red (PR, vehicle) and tyrosinase (tyr cpr, unrelated guide RNA) CRISPants as negative controls. Scale bar = 200 µM. (B) Bacterial burden of larvae shown in (A). Data shown are mean ± standard error of the mean (SEM), n = 71–76 accumulated from three independent experiments. Statistical significance determined via one-way analysis of variance (ANOVA) with Bonferroni’s multiple comparisons. p values shown are: **p < 0.01 and ***p < 0.001. (C) Fluorescence confocal z-stacks of the caudal vein region of 2 dpf mpx:GFP larvae (neutrophils) immune labelled with anti-nitrotyrosine (cyan) in the absence of Mm infection. Larvae were injected at the one-cell stage with trib1 RNA (overexpression, OE) and cop1 guide RNA (CRISPants, cpr) using PR (vehicle) and tyrosinase (unrelated guide RNA) CRISPants as negative controls. Scale bar = 30 μm. (D) Corrected fluorescence intensity levels of anti-nitrotyrosine antibody confocal z-stacks shown in (C). Data shown are mean ± SEM, n = 108 cells from 18 embryos accumulated from three independent experiments. Statistical significance was determined using one-way ANOVA with Bonferroni’s multiple comparisons post hoc test. p values shown are: ****p < 0.0001.CC BY · PubMed Central
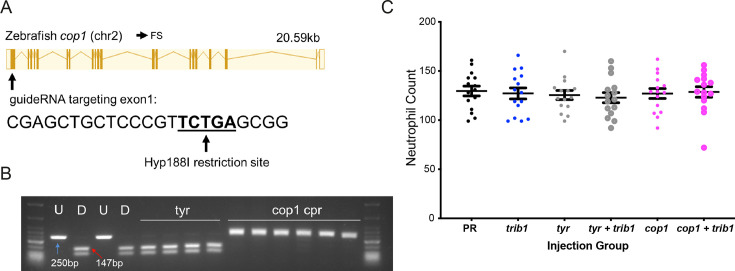
Figure 8—figure supplement 1. An efficient CRISPR–Cas9 guide RNA was generated for the zebrafish cop1 gene. (A) The zebrafish cop1 gene (ENSDARG00000079329) has one coding transcript which was used as a basis for CRISPR–Cas9 guide design. Exon map and gene information obtained from Ensembl database. The web tool ChopChop was used to design a cop1 guide RNA with suitable restriction enzyme bind site (black line). PAM cut site (NGG) denoted with blue line. (B) Electrophoresis gel of larvae injected with cop1 guide RNA (cpr) with a Hyp188I restriction digest. The undigested PCR band is 250 bp and the successfully digested band is 147 bp. Two uninjected fish were used as controls without (U) and with (D) digestion. Four tyrosinase (tyr) guide injected larvae had conserved SacII sites while 6/6 cop1 larvae did not digest with Hyp188I indicating a genomic disruption at the CRISPR PAM site. First and last lanes of gel images contain NEB Low Molecular Weight ladder for reference. (C) Wholebody Tg(mpx:GFP)i114 neutrophil numbers in 2 dpf larvae injected at the one-cell stage with either phenol red (PR), trib1 RNA overexpression (trib1), tyrosinase CRISPant (tyr), trib1 and tyrosinase CRISPant (tyr + trib1), cop1 CRISPant (cop1), or cop1 and trib1 CRISPant (cop1 + trib1). Data shown are mean ± standard error of the mean (SEM), n = 15 fish per group.
Figure 8—figure supplement 1. An efficient CRISPR–Cas9 guide RNA was generated for the zebrafish cop1 gene. (A) The zebrafish cop1 gene (ENSDARG00000079329) has one coding transcript which was used as a basis for CRISPR–Cas9 guide design. Exon map and gene information obtained from Ensembl database. The web tool ChopChop was used to design a cop1 guide RNA with suitable restriction enzyme bind site (black line). PAM cut site (NGG) denoted with blue line. (B) Electrophoresis gel of larvae injected with cop1 guide RNA (cpr) with a Hyp188I restriction digest. The undigested PCR band is 250 bp and the successfully digested band is 147 bp. Two uninjected fish were used as controls without (U) and with (D) digestion. Four tyrosinase (tyr) guide injected larvae had conserved SacII sites while 6/6 cop1 larvae did not digest with Hyp188I indicating a genomic disruption at the CRISPR PAM site. First and last lanes of gel images contain NEB Low Molecular Weight ladder for reference. (C) Wholebody Tg(mpx:GFP)i114 neutrophil numbers in 2 dpf larvae injected at the one-cell stage with either phenol red (PR), trib1 RNA overexpression (trib1), tyrosinase CRISPant (tyr), trib1 and tyrosinase CRISPant (tyr + trib1), cop1 CRISPant (cop1), or cop1 and trib1 CRISPant (cop1 + trib1). Data shown are mean ± standard error of the mean (SEM), n = 15 fish per group.CC BY · PubMed Central

Verification

Claims the paper makes

The claims and statistics of this paper haven’t been checked yet.

Run the check — free, no account needed. It reads the open-access text and checks the sources it cites.

A few free checks a day · papers already verified open instantly · results are public

Self-check

Percentages, sums and reported differences re-computed from the paper’s own numbers.

The self-check needs the paper’s full text.

Citations

Cites

Show all 2 references

Research works printed but not linked: 84

  1. Ahmad, 2022, Macrophage: a cell with many faces and functions in tuberculosis, Frontiers in Immunology, 13, 10.3389/fimmu.2022.747799 · DOI
  2. Allué-Guardia, 2021, Mycobacteriophages as potential therapeutic agents against drug-resistant tuberculosis, International Journal of Molecular Sciences, 22, 10.3390/ijms22020735 · DOI
  3. Angyal, 2012, The tribbles gene family and lipoprotein metabolism, Current Opinion in Lipidology, 23, 122, 10.1097/MOL.0b013e3283508c3b · DOI
  4. Arndt, 2018, Tribbles homolog 1 deficiency modulates function and polarization of murine bone marrow-derived macrophages, The Journal of Biological Chemistry, 293, 11527, 10.1074/jbc.RA117.000703 · DOI
  5. Athanasiadis, 2017, Single-cell RNA-sequencing uncovers transcriptional states and fate decisions in haematopoiesis, Nature Communications, 8, 10.1038/s41467-017-02305-6 · DOI
  6. Balla, 2010, Eosinophils in the zebrafish: prospective isolation, characterization, and eosinophilia induction by helminth determinants, Blood, 116, 3944, 10.1182/blood-2010-03-267419 · DOI
  7. Bell, 2016, In vivo molecular dissection of the effects of HIV-1 in Active Tuberculosis, PLOS Pathogens, 12, 10.1371/journal.ppat.1005469 · DOI
  8. Benard, 2012, Infection of zebrafish embryos with intracellular bacterial pathogens, Journal of Visualized Experiments, 01, 10.3791/3781 · DOI
  9. Bernut, 2019, CFTR protects against mycobacterium abscessus infection by fine-tuning host oxidative defenses, Cell Reports, 26, 1828, 10.1016/j.celrep.2019.01.071 · DOI
  10. Buchan, 2019, A transgenic zebrafish line for in vivo visualisation of neutrophil myeloperoxidase, PLOS ONE, 14, 10.1371/journal.pone.0215592 · DOI
  11. Dai, 2016, Phosphorylation of CHOP (C/EBP Homologous Protein) by the AMP-activated protein Kinase Alpha 1 in macrophages promotes chop degradation and reduces injury-induced neointimal disruption in vivo, Circulation Research, 119, 1089, 10.1161/CIRCRESAHA.116.309463 · DOI
  12. Dal, 2020, Zebrafish embryos allow prediction of nanoparticle circulation times in mice and facilitate quantification of nanoparticle-cell interactions, Small, 16, 10.1002/smll.201906719 · DOI
  13. Daniel, 2011, Mycobacterium tuberculosis uses host triacylglycerol to accumulate lipid droplets and acquires a dormancy-like phenotype in lipid-loaded macrophages, PLOS Pathogens, 7, 10.1371/journal.ppat.1002093 · DOI
  14. Das, 2014, Drosophila tribbles antagonizes insulin signaling-mediated growth and metabolism via interactions with Akt kinase, PLOS ONE, 9, 10.1371/journal.pone.0109530 · DOI
  15. Davis, 2002, Real-time visualization of mycobacterium-macrophage interactions leading to initiation of granuloma formation in zebrafish embryos, Immunity, 17, 693, 10.1016/s1074-7613(02)00475-2 · DOI · Paper page
  16. Durzynska, 2017, STK40 Is a Pseudokinase that binds the E3 ubiquitin ligase COP1, Structure, 25, 287, 10.1016/j.str.2016.12.008 · DOI
  17. Elks, 2011, Measuring inflammatory cell migration in the zebrafish, Methods in Molecular Biology, 769, 261, 10.1007/978-1-61779-207-6_18 · DOI
  18. Elks, 2013, Hypoxia inducible factor signaling modulates susceptibility to mycobacterial infection via a nitric oxide dependent mechanism, PLOS Pathogens, 9, 10.1371/journal.ppat.1003789 · DOI
  19. Elks, 2014, Mycobacteria counteract a TLR-mediated nitrosative defense mechanism in a zebrafish infection model, PLOS ONE, 9, 10.1371/journal.pone.0100928 · DOI
  20. Forlenza, 2008, Differential contribution of neutrophilic granulocytes and macrophages to nitrosative stress in a host-parasite animal model, Mol Immunol, 45, 3178, 10.1016/j.molimm.2008.02.025 · DOI
  21. Grosshans, 2000, A genetic link between morphogenesis and cell division during formation of the ventral furrow in Drosophila, Cell, 101, 523, 10.1016/s0092-8674(00)80862-4 · DOI
  22. Hackett, 2020, Mycobacterium tuberculosis limits host glycolysis and IL-1β by restriction of PFK-M via MicroRNA-21, Cell Reports, 30, 124, 10.1016/j.celrep.2019.12.015 · DOI
  23. Hameed, 2018, Molecular detection of mutations in isolates of multidrug resistant tuberculosis and tuberculosis suspects by multiplex allele specific PCR, Pakistan Journal of Pharmaceutical Sciences, 31, 2661
  24. Hammond, 2023, An arginase 2 promoter transgenic line illuminates immune cell polarisation in zebrafish, Disease Models & Mechanisms, 16, 10.1242/dmm.049966 · DOI
  25. Hegedus, 2006, Tribbles: novel regulators of cell function; evolutionary aspects, Cellular and Molecular Life Sciences, 63, 1632, 10.1007/s00018-006-6007-9 · DOI
  26. Hegedus, 2007, Tribbles: a family of kinase-like proteins with potent signalling regulatory function, Cellular Signalling, 19, 238, 10.1016/j.cellsig.2006.06.010 · DOI
  27. Holla, 2014, Mycobacterium bovis BCG promotes tumor cell survival from tumor necrosis factor-α-induced apoptosis, Molecular Cancer, 13, 10.1186/1476-4598-13-210 · DOI
  28. Hong, 2019, TRIB3 promotes the proliferation and invasion of renal cell carcinoma cells via activating MAPK signaling pathway, International Journal of Biological Sciences, 15, 587, 10.7150/ijbs.29737 · DOI
  29. Hruscha, 2013, Efficient CRISPR/Cas9 genome editing with low off-target effects in zebrafish, Developmen, 140, 4982, 10.1242/dev.099085 · DOI
  30. Isles, 2019, The CXCL12/CXCR4 signaling axis retains neutrophils at inflammatory sites in Zebrafish, Frontiers in Immunology, 10, 10.3389/fimmu.2019.01784 · DOI
  31. Jamieson, 2018, Substrate binding allosterically relieves autoinhibition of the pseudokinase TRIB1, Science Signaling, 11, 10.1126/scisignal.aau0597 · DOI
  32. Johnston, 2015, Tribbles in inflammation, Biochemical Society Transactions, 43, 1069, 10.1042/BST20150095 · DOI
  33. Johnston, 2019, Myeloid Tribbles 1 induces early atherosclerosis via enhanced foam cell expansion, Science Advances, 5, 10.1126/sciadv.aax9183 · DOI
  34. Kaufmann, 2018, BCG educates hematopoietic stem cells to generate protective innate immunity against tuberculosis, Cell, 172, 176, 10.1016/j.cell.2017.12.031 · DOI · Paper page
  35. Kilinç, 2021, Host-directed therapy to combat mycobacterial infections, Immunological Reviews, 301, 62, 10.1111/imr.12951 · DOI
  36. Kim, 2016, Coordinated inhibition of C/EBP by Tribbles in multiple tissues is essential for Caenorhabditis elegans development, BMC Biology, 14, 10.1186/s12915-016-0320-z · DOI
  37. Kiss-Toth, 2004, Human tribbles, a protein family controlling mitogen-activated protein kinase cascades, The Journal of Biological Chemistry, 279, 42703, 10.1074/jbc.M407732200 · DOI
  38. Knight, 2018, Lipid droplet formation in Mycobacterium tuberculosis infected macrophages requires IFN-γ/HIF-1α signaling and supports host defense, PLOS Pathogens, 14, 10.1371/journal.ppat.1006874 · DOI
  39. Kung, 2019, The pseudokinase TRIB1 toggles an intramolecular switch to regulate COP1 nuclear export, The EMBO Journal, 38, 10.15252/embj.201899708 · DOI
  40. Lai, 2015, HIV-tuberculosis-associated immune reconstitution inflammatory syndrome is characterized by Toll-like receptor and inflammasome signalling, Nature Communications, 6, 10.1038/ncomms9451 · DOI
  41. Lewis, 2019, Hypoxia induces macrophage tnfa expression via cyclooxygenase and prostaglandin E2 in vivo, Frontiers in Immunology, 10, 10.3389/fimmu.2019.02321 · DOI
  42. Li, 2024, Cebp1 and Cebpβ transcriptional axis controls eosinophilopoiesis in zebrafish, Nature Communications, 15, 10.1038/s41467-024-45029-0 · DOI
  43. Liu, 2013, Macrophage migration is controlled by Tribbles 1 through the interaction between C/EBPβ and TNF-α, Veterinary Immunology and Immunopathology, 155, 67, 10.1016/j.vetimm.2013.06.001 · DOI
  44. Lyons, 2001, A novel myeloid-restricted zebrafish CCAAT/enhancer-binding protein with A potent transcriptional activation domain, Blood, 97, 2611, 10.1182/blood.v97.9.2611 · DOI
  45. Mack, 2019, Trib1 regulates eosinophil lineage commitment and identity by restraining the neutrophil program, Blood, 133, 2413, 10.1182/blood.2018872218 · DOI
  46. Mata, 2000, Tribbles coordinates mitosis and morphogenesis in Drosophila by regulating string/CDC25 proteolysis, Cell, 101, 511, 10.1016/s0092-8674(00)80861-2 · DOI
  47. Menon, 2019, Quantitative lipid droplet proteomics reveals mycobacterium tuberculosis induced alterations in macrophage response to infection, ACS Infectious Diseases, 5, 559, 10.1021/acsinfecdis.8b00301 · DOI
  48. Migliori, 2013, A case of resistance beyond extensively drug-resistant tuberculosis in Japan, The European Respiratory Journal, 42, 872, 10.1183/09031936.00061113 · DOI
  49. Murphy, 2015, Molecular mechanism of CCAAT-Enhancer binding protein recruitment by the TRIB1 Pseudokinase, Structure, 23, 2111, 10.1016/j.str.2015.08.017 · DOI
  50. Niespolo, 2020, Tribbles-1 expression and its function to control inflammatory cytokines, including interleukin-8 levels are regulated by miRNAs in macrophages and prostate cancer cells, Frontiers in Immunology, 11, 10.3389/fimmu.2020.574046 · DOI
  51. Noguchi, 2022, Sima, a Drosophila homolog of HIF-1α, in fat body tissue inhibits larval body growth by inducing Tribbles gene expression, Genes Cells, 27, 145, 10.1111/gtc.12913 · DOI
  52. Ogryzko, 2019, Hif-1α-induced expression of Il-1β protects against mycobacterial infection in Zebrafish, Journal of Immunology, 202, 494, 10.4049/jimmunol.1801139 · DOI
  53. Örd, 2018, TRIB3 limits FGF21 induction during in vitro and in vivo nutrient deficiencies by inhibiting C/EBP–ATF response elements in the FGF21 promoter, Biochimica et Biophysica Acta, 1861, 271, 10.1016/j.bbagrm.2018.01.014 · DOI
  54. Örd, 2020, A human-specific VNTR in the TRIB3 promoter causes gene expression variation between individuals, PLOS Genetics, 16, 10.1371/journal.pgen.1008981 · DOI
  55. Ostertag, 2010, Control of adipose tissue inflammation through TRB1, Diabetes, 59, 1991, 10.2337/db09-1537 · DOI
  56. Pettersen, 2021, UCSF ChimeraX: Structure visualization for researchers, educators, and developers, Protein Science, 30, 70, 10.1002/pro.3943 · DOI
  57. Pollara, 2021, Exaggerated IL-17A activity in human in vivo recall responses discriminates active tuberculosis from latent infection and cured disease, Science Translational Medicine, 13, 10.1126/scitranslmed.abg7673 · DOI
  58. Prudente, 2012, The mammalian tribbles homolog TRIB3, glucose homeostasis, and cardiovascular diseases, Endocrine Reviews, 33, 526, 10.1210/er.2011-1042 · DOI
  59. Qi, 2006, TRB3 links the E3 ubiquitin ligase COP1 to lipid metabolism, Science, 312, 1763, 10.1126/science.1123374 · DOI · Paper page
  60. Renshaw, 2006, A transgenic zebrafish model of neutrophilic inflammation, Blood, 108, 3976, 10.1182/blood-2006-05-024075 · DOI
  61. Santhakumar, 2012, A zebrafish model to study and therapeutically manipulate hypoxia signaling in tumorigenesis, Cancer Research, 72, 4017, 10.1158/0008-5472.CAN-11-3148 · DOI
  62. Satoh, 2013, Critical role of Trib1 in differentiation of tissue-resident M2-like macrophages, Nature, 495, 524, 10.1038/nature11930 · DOI
  63. Schild, 2020, Hif-1alpha stabilisation is protective against infection in zebrafish comorbid models, The FEBS Journal, 287, 3925, 10.1111/febs.15433 · DOI
  64. Schindelin, 2012, Fiji: an open-source platform for biological-image analysis, Nature Methods, 9, 676, 10.1038/nmeth.2019 · DOI · Paper page
  65. Schoolmeesters, 2012, Kinome-wide functional genomics screen reveals a novel mechanism of TNFα-induced nuclear accumulation of the HIF-1α transcription factor in cancer cells, PLOS ONE, 7, 10.1371/journal.pone.0031270 · DOI
  66. Seher, 2000, Tribbles, a cell-cycle brake that coordinates proliferation and morphogenesis during Drosophila gastrulation, Current Biology, 10, 623, 10.1016/S0960-9822(00)00502-9 · DOI
  67. Sheedy, 2021, Targeting immunometabolism in host defence against Mycobacterium tuberculosis, Immunology, 162, 145, 10.1111/imm.13276 · DOI
  68. Steverson, 2016, Tribbles homolog 3 promotes foam cell formation associated with decreased proinflammatory cytokine production in macrophages: Evidence for reciprocal regulation of cholesterol uptake and inflammation, Metabolic Syndrome and Related Disorders, 14, 7, 10.1089/met.2015.0037 · DOI
  69. Stoop, 2011, Zebrafish embryo screen for mycobacterial genes involved in the initiation of granuloma formation reveals a newly identified ESX-1 component, Disease Models & Mechanisms, 4, 526, 10.1242/dmm.006676 · DOI
  70. Takahashi, 2008, TRB3 suppresses adipocyte differentiation by negatively regulating PPARgamma transcriptional activity, Journal of Lipid Research, 49, 880, 10.1194/jlr.M700545-JLR200 · DOI
  71. Thisse, 2008, High-resolution in situ hybridization to whole-mount zebrafish embryos, Nature Protocols, 3, 59, 10.1038/nprot.2007.514 · DOI
  72. van der Sar, 2009, Specificity of the zebrafish host transcriptome response to acute and chronic mycobacterial infection and the role of innate and adaptive immune components, Molecular Immunology, 46, 2317, 10.1016/j.molimm.2009.03.024 · DOI
  73. Varadi, 2022, AlphaFold Protein Structure Database: massively expanding the structural coverage of protein-sequence space with high-accuracy models, Nucleic Acids Research, 50, D439, 10.1093/nar/gkab1061 · DOI · Paper page
  74. Wang, 2012, Silence of TRIB3 suppresses atherosclerosis and stabilizes plaques in diabetic ApoE-/-/LDL receptor-/- mice, Diabetes, 61, 463, 10.2337/db11-0518 · DOI
  75. Wei, 2020, Adiponectin protects obese rats from aggravated acute lung injury via suppression of endoplasmic reticulum stress, Diabetes, Metabolic Syndrome and Obesity, 13, 4179, 10.2147/DMSO.S278684 · DOI
  76. Wennemers, 2011, Tribbles homolog 3 denotes a poor prognosis in breast cancer and is involved in hypoxia response, Breast Cancer Research, 13, 10.1186/bcr2934 · DOI
  77. Wu, 2014, Systematic expression profiling analysis identifies specific microRNA-gene interactions that may differentiate between active and latent tuberculosis infection, BioMed Research International, 2014, 10.1155/2014/895179 · DOI
  78. Xing, 2020, TRIB3 promotes lung adenocarcinoma progression via an enhanced warburg effect, Cancer Management and Research, 12, 13195, 10.2147/CMAR.S287956 · DOI
  79. Yokoyama, 2010, Trib1 links the MEK1/ERK pathway in myeloid leukemogenesis, Blood, 116, 2768, 10.1182/blood-2009-10-246264 · DOI
  80. Yoshida, 2013, COP1 targets C/EBPα for degradation and induces acute myeloid leukemia via Trib1, Blood, 122, 1750, 10.1182/blood-2012-12-476101 · DOI
  81. Yuan, 2011, Sumoylation of CCAAT/enhancer-binding protein α promotes the biased primitive hematopoiesis of zebrafish, Blood, 117, 7014, 10.1182/blood-2010-12-325712 · DOI
  82. Zahid, 2022, Molecular dynamics and structural analysis of the binding of COP1 E3 ubiquitin ligase to β-catenin and TRIB pseudokinases, Proteins, 90, 993, 10.1002/prot.26292 · DOI
  83. Zhang, 2013, TRIB3 mediates glucose-induced insulin resistance via a mechanism that requires the hexosamine biosynthetic pathway, Diabetes, 62, 4192, 10.2337/db13-0312 · DOI
  84. Zhu, 2015, Cellular metabolism and macrophage functional polarization, International Reviews of Immunology, 34, 82, 10.3109/08830185.2014.969421 · DOI

Metadata

Authors
Hammond, F. R., Lewis, A., Pollara, G., Tomlinson, G. S., Noursadeghi, M., Kiss-Toth, E., & Elks, P. M.
Affiliations
  • University of Sheffield (GB)
  • University College London (GB)
  • The Bateson Centre, School of Medicine and Population Health, Faculty of Health, University of Sheffield
Corresponding author
Elks, Philip M
Venue
eLife
Published
2024-06-18
Volume
13
ISSN
2050-084X (ISSN-L)
OpenAlex
W4399804474
Cited by
2
References
2
Citations by year
2025: 2
FWCI
0.69
Type
journal article
Language
en
Open access
Locations
  • eLife (publishedVersion, cc-by)
  • bioRxiv (Cold Spring Harbor Laboratory) (acceptedVersion, cc-by)
  • PubMed Central (publishedVersion, cc-by)
  • PubMed (publishedVersion)
  • White Rose Research Online (University of Leeds, The University of Sheffield, University of York) (acceptedVersion, cc-by)
  • DOAJ (DOAJ: Directory of Open Access Journals) (submittedVersion, cc-by-sa)
Funders
  • Wellcome Trust (10.35802/105570, 10.35802/101766, 10.35802/207511)
  • Medical Research Foundation (MR_N007727_1)
  • Academy of Medical Sciences (SGL021\1045)
  • Wolfson Foundation (WLR\R1\170024)
Topics
  • Health Sciences › Medicine › Infectious Diseases › Tuberculosis Research and Epidemiology
  • Life Sciences › Immunology and Microbiology › Immunology › Immune responses and vaccinations
  • Life Sciences › Immunology and Microbiology › Immunology › Immune Response and Inflammation
Keywords
tuberculosis, Mycobacterium tuberculosis, Mycobacterium marinum, host-directed therapy, macrophage polarization, monocytes, inflammatory cytokines, IL-1β, nitric oxide, E3 ubiquitin ligase, COP1, zebrafish infection model, innate immunity
MeSH terms
Animals, Disease Models, Animal, Female, Humans, Macrophages, Male, Monocytes, Mycobacterium Infections, Nontuberculous, Zebrafish, Protein Serine-Threonine Kinases, Mycobacterium marinum, Intracellular Signaling Peptides and Proteins, Host-Pathogen Interactions

About these checks

Registry, retraction, Cites and statistics results are computed, not judged, with one exception: a printed reference that no index lists is read once by a model before it counts as a citation error. Claims are extracted by a model and kept only when their quote appears verbatim in the text; each cited source is then checked, with a model’s help, for whether it says what the claim relies on. Those verdicts can be wrong — read the claim’s quote and the cited source before relying on one.

Statistics and arithmetic are recomputed, not judged.

Confidence bands are shown only for fields calibrated on our annotated test set. None is calibrated yet, so no band is shown.

What counts as a claim ›How we measure confidence ›How we check this ›

Are you an author, or do you see a problem with this page? Request a review

How to cite

Cite CoChat for the checks on this page, and the paper for its own findings.

This page
CoChat. (2026). Citation check: Tribbles1 is host protective during in vivo mycobacterial infection. https://app.cochat.ai/papers/10.7554/elife.95980
The paper
Hammond, F. R., Lewis, A., Pollara, G., Tomlinson, G. S., Noursadeghi, M., Kiss-Toth, E., & Elks, P. M. (2024). Tribbles1 is host protective during in vivo mycobacterial infection. eLife. https://doi.org/10.7554/elife.95980