

The DOI matches its Crossref record; 3 of the 3 references it cites were found in a registry or an index.
Isobaric crosslinking mass spectrometry technology for studying conformational and structural changes in proteins and complexes
Open accessPublished version of a preprint
Abstract
Dynamic conformational and structural changes in proteins and protein complexes play a central and ubiquitous role in the regulation of protein function, yet it is very challenging to study these changes, especially for large protein complexes, under physiological conditions. Here, we introduce a novel isobaric crosslinker, Qlinker, for studying conformational and structural changes in proteins and protein complexes using quantitative crosslinking mass spectrometry. Qlinkers are small and simple, amine-reactive molecules with an optimal extended distance of ~10 Å, which use MS2 reporter ions for relative quantification of Qlinker-modified peptides derived from different samples. We synthesized the 2-plex Q2linker and showed that the Q2linker can provide quantitative crosslinking data that pinpoints key conformational and structural changes in biosensors, binary and ternary complexes composed of the general transcription factors TBP, TFIIA, and TFIIB, and RNA polymerase II complexes.
Overview
The claims and statistics of this paper haven’t been checked yet.
Run the check — free, no account needed. It reads the open-access text and checks the sources it cites.
Integrity signals
Registry
Cites
Statistics
Figures
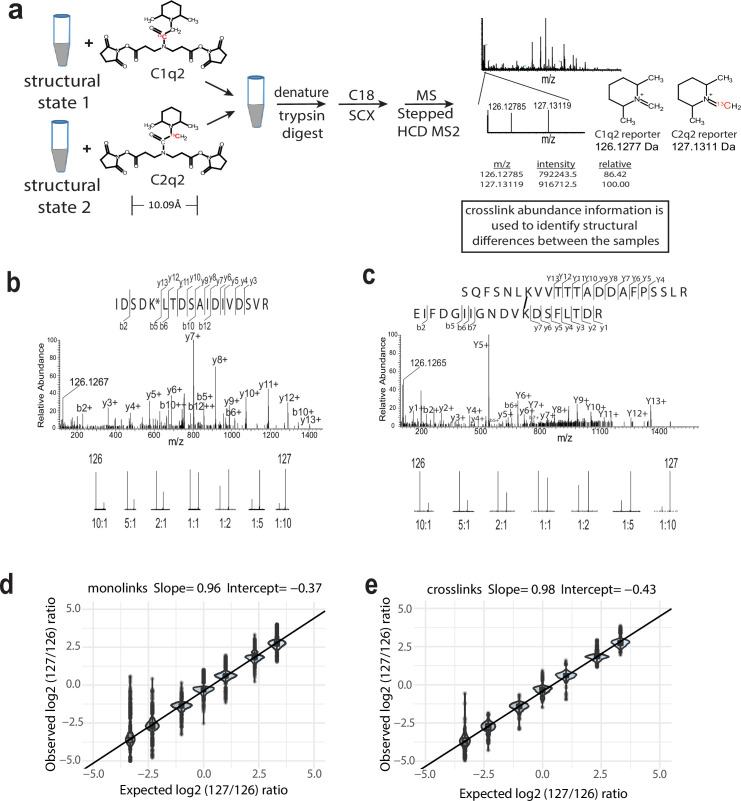
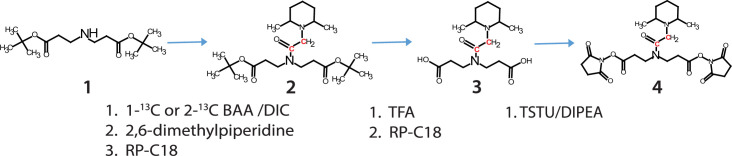
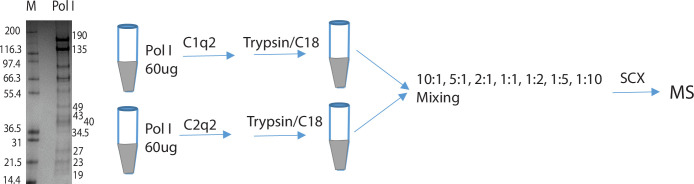
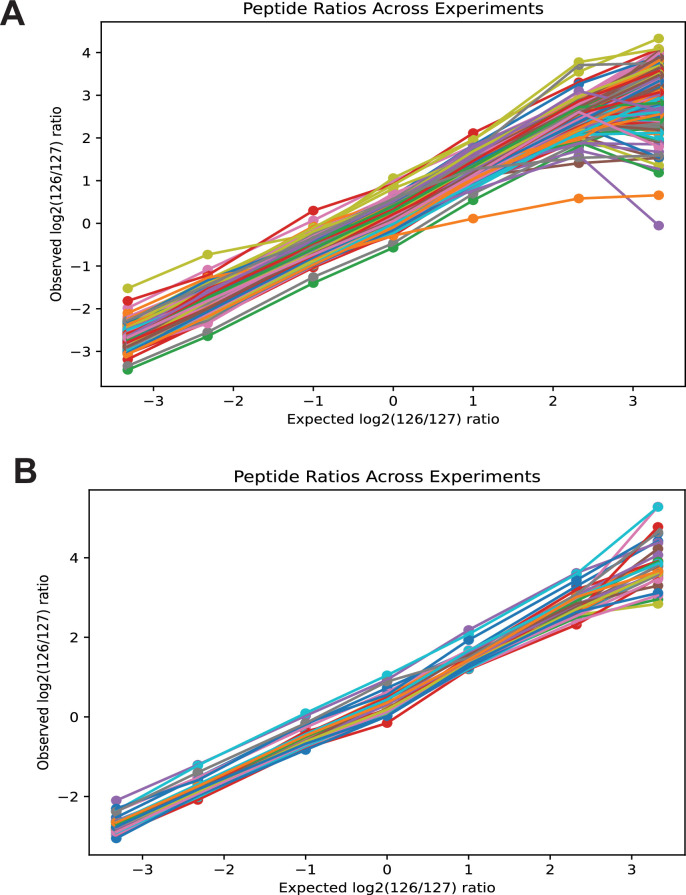
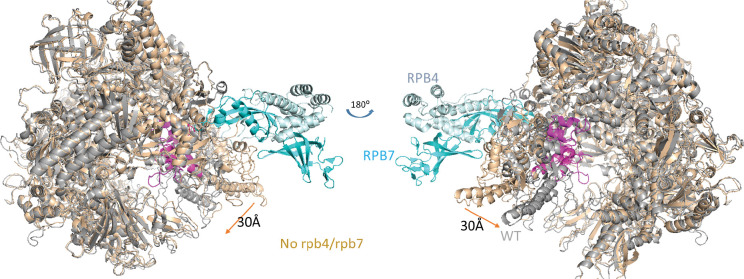
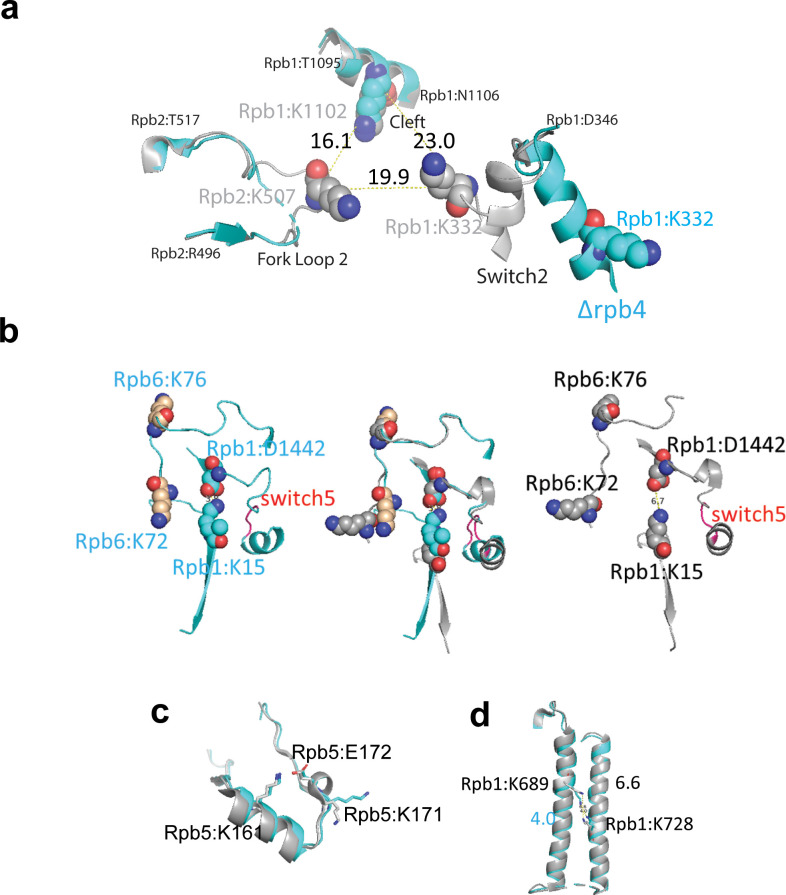
Verification
Claims the paper makes
The claims and statistics of this paper haven’t been checked yet.
Run the check — free, no account needed. It reads the open-access text and checks the sources it cites.
Self-check
Percentages, sums and reported differences re-computed from the paper’s own numbers.
The self-check needs the paper’s full text.
Citations
Cites
Highly accurate protein structure prediction with AlphaFold
Jumper, J., Evans, R., Pritzel, A., Green, T., Figurnov, M., Ronneberger, O., Tunyasuvunakool, K., Bates, R., Žídek, A., Potapenko, A., et al. (2021) · Nature · doi:10.1038/s41586-021-03819-2 · Cited by 43,764
Structural Basis of Transcription: RNA Polymerase II at 2.8 Ångstrom Resolution
Cramer, P., Bushnell, D. A., & Kornberg, R. D. (2001) · Science · doi:10.1126/science.1059493 · Cited by 1,247
Bamberger, C., Pankow, S., Martínez-Bartolomé, S., Ma, M., Diedrich, J., Rissman, R. A., & Yates, J. R. (2021) · Journal of Proteome Research · doi:10.1021/acs.jproteome.0c00912 · Cited by 70
Research works printed but not linked: 77
- Abdella, 2021, Structure of the human Mediator-bound transcription preinitiation complex, Science, 372, 52, 10.1126/science.abg3074 · DOI
- Akey, 2022, Comprehensive structure and functional adaptations of the yeast nuclear pore complex, Cell, 185, 361, 10.1016/j.cell.2021.12.015 · DOI · Paper page
- Andel, 1999, Three-dimensional structure of the human TFIID-IIA-IIB complex, Science, 286, 2153, 10.1126/science.286.5447.2153 · DOI
- Bangur, 1999, An interaction between the N-terminal region and the core domain of yeast TFIIB promotes the formation of TATA-binding protein-TFIIB-DNA complexes, The Journal of Biological Chemistry, 274, 23203, 10.1074/jbc.274.33.23203 · DOI
- Bleichenbacher, 2003, Novel interactions between the components of human and yeast TFIIA/TBP/DNA complexes, Journal of Molecular Biology, 332, 783, 10.1016/s0022-2836(03)00887-8 · DOI
- Burger, 2016, A structure-free method for quantifying conformational flexibility in proteins, Scientific Reports, 6, 10.1038/srep29040 · DOI
- Bushnell, 2003, Complete, 12-subunit RNA polymerase II at 4.1-A resolution: implications for the initiation of transcription, PNAS, 100, 6969, 10.1073/pnas.1130601100 · DOI
- Carrell, 1998, Conformational changes and disease--serpins, prions and Alzheimer’s, Current Opinion in Structural Biology, 8, 799, 10.1016/s0959-440x(98)80101-2 · DOI
- Catterall, 2020, The conformational cycle of a prototypical voltage-gated sodium channel, Nature Chemical Biology, 16, 1314, 10.1038/s41589-020-0644-4 · DOI
- Chavez, 2015, Quantitative interactome analysis reveals a chemoresistant edgotype, Nature Communications, 6, 10.1038/ncomms8928 · DOI
- Chavez, 2020, Isobaric quantitative protein interaction reporter technology for comparative interactome studies, Analytical Chemistry, 92, 14094, 10.1021/acs.analchem.0c03128 · DOI
- Chavez, 2021, Multiplexed cross-linking with isobaric quantitative protein interaction reporter technology, Analytical Chemistry, 93, 16759, 10.1021/acs.analchem.1c02209 · DOI
- Chen, 2004, Mapping the location of TFIIB within the RNA polymerase II transcription preinitiation complex: a model for the structure of the PIC, Cell, 119, 169, 10.1016/j.cell.2004.09.028 · DOI
- Chen, 2010, Architecture of the RNA polymerase II-TFIIF complex revealed by cross-linking and mass spectrometry, The EMBO Journal, 29, 717, 10.1038/emboj.2009.401 · DOI
- Chen, 2019, A high-speed search engine pLink 2 with systematic evaluation for proteome-scale identification of cross-linked peptides, Nature Communications, 10, 10.1038/s41467-019-11337-z · DOI
- Chen, 2019, Quantitative cross-linking/mass spectrometry to elucidate structural changes in proteins and their complexes, Nature Protocols, 14, 171, 10.1038/s41596-018-0089-3 · DOI
- Chen, 2022, Ensemble cryo-EM reveals conformational states of the nsp13 helicase in the SARS-CoV-2 helicase replication-transcription complex, Nature Structural & Molecular Biology, 29, 250, 10.1038/s41594-022-00734-6 · DOI
- Darling, 2018, Intrinsic disorder and posttranslational modifications: the darker side of the biological dark matter, Frontiers in Genetics, 9, 10.3389/fgene.2018.00158 · DOI
- Diedrich, 2013, Energy dependence of HCD on peptide fragmentation: stepped collisional energy finds the sweet spot, Journal of the American Society for Mass Spectrometry, 24, 1690, 10.1007/s13361-013-0709-7 · DOI
- Dion, 2003, Interactions of a DNA-bound transcriptional activator with the TBP-TFIIA-TFIIB-promoter quaternary complex, The Journal of Biological Chemistry, 278, 11495, 10.1074/jbc.M211938200 · DOI
- Espino, 2015, In cell footprinting coupled with mass spectrometry for the structural analysis of proteins in live cells, Analytical Chemistry, 87, 7971, 10.1021/acs.analchem.5b01888 · DOI
- Glossop, 2004, A conformational change in TFIIB is required for activator-mediated assembly of the preinitiation complex, Nucleic Acids Research, 32, 1829, 10.1093/nar/gkh504 · DOI
- Gnatt, 2001, Structural basis of transcription: an RNA polymerase II elongation complex at 3.3 A resolution, Science, 292, 1876, 10.1126/science.1059495 · DOI
- Hada, 2019, Histone octamer structure is altered early in ISW2 ATP-dependent nucleosome remodeling, Cell Reports, 28, 282, 10.1016/j.celrep.2019.05.106 · DOI
- Hambly, 2005, Laser flash photolysis of hydrogen peroxide to oxidize protein solvent-accessible residues on the microsecond timescale, Journal of the American Society for Mass Spectrometry, 16, 2057, 10.1016/j.jasms.2005.09.008 · DOI
- Haymond, 2019, Protein painting, an optimized MS-based technique, reveals functionally relevant interfaces of the PD-1/PD-L1 complex and the YAP2/ZO-1 complex, The Journal of Biological Chemistry, 294, 11180, 10.1074/jbc.RA118.007310 · DOI
- He, 2015, Extracting accurate precursor information for tandem mass spectra by rawconverter, Analytical Chemistry, 87, 11361, 10.1021/acs.analchem.5b02721 · DOI
- Huang, 2015, Quantitative mapping of protein structure by hydroxyl radical footprinting-mediated structural mass spectrometry: a protection factor analysis, Biophysical Journal, 108, 107, 10.1016/j.bpj.2014.11.013 · DOI
- Ihling, 2020, The isotope-labeled, MS-cleavable cross-linker disuccinimidyl dibutyric urea for improved cross-linking/mass spectrometry studies, Journal of the American Society for Mass Spectrometry, 31, 183, 10.1021/jasms.9b00008 · DOI
- Kahsai, 2011, Multiple ligand-specific conformations of the β2-adrenergic receptor, Nature Chemical Biology, 7, 692, 10.1038/nchembio.634 · DOI
- Kays, 2000, Virtually unidirectional binding of TBP to the AdMLP TATA box within the quaternary complex with TFIIA and TFIIB, Chemistry & Biology, 7, 601, 10.1016/s1074-5521(00)00009-0 · DOI
- Khan, 2009, An overview of the importance of conformational flexibility in gene regulation by the transcription factors, Journal of Biophysics, 2009, 10.1155/2009/210485 · DOI
- Lee, 1992, TFIIA induces conformational changes in TFIID via interactions with the basic repeat, Molecular and Cellular Biology, 12, 5189, 10.1128/mcb.12.11.5189-5196.1992 · DOI
- Leitner, 2014, Chemical cross-linking/mass spectrometry targeting acidic residues in proteins and protein complexes, PNAS, 111, 9455, 10.1073/pnas.1320298111 · DOI
- Liu, 2014, Mass spectrometry footprinting reveals the structural rearrangements of cyanobacterial orange carotenoid protein upon light activation, Biochimica et Biophysica Acta - Bioenergetics, 1837, 1955, 10.1016/j.bbabio.2014.09.004 · DOI
- Liu, 2020, Mass spectrometry-based protein footprinting for higher-order structure analysis: fundamentals and applications, Chemical Reviews, 120, 4355, 10.1021/acs.chemrev.9b00815 · DOI
- Luchini, 2014, Protein painting reveals solvent-excluded drug targets hidden within native protein-protein interfaces, Nature Communications, 5, 10.1038/ncomms5413 · DOI
- MacLean, 2010, Skyline: an open source document editor for creating and analyzing targeted proteomics experiments, Bioinformatics, 26, 966, 10.1093/bioinformatics/btq054 · DOI · Paper page
- Makepeace, 2020, Improving identification of In-organello protein-protein interactions using an affinity-enrichable, isotopically coded, and mass spectrometry-cleavable chemical crosslinker, Molecular & Cellular Proteomics, 19, 624, 10.1074/mcp.RA119.001839 · DOI
- Mashtalir, 2018, Modular organization and assembly of SWI/SNF family chromatin remodeling complexes, Cell, 175, 1272, 10.1016/j.cell.2018.09.032 · DOI
- Mashtalir, 2020, A structural model of the endogenous human BAF complex informs disease mechanisms, Cell, 183, 802, 10.1016/j.cell.2020.09.051 · DOI
- McAlister, 2014, MultiNotch MS3 enables accurate, sensitive, and multiplexed detection of differential expression across cancer cell line proteomes, Analytical Chemistry, 86, 7150, 10.1021/ac502040v · DOI · Paper page
- McKenzie-Coe, 2022, Hydroxyl radical protein footprinting: a mass spectrometry-based structural method for studying the higher order structure of proteins, Chemical Reviews, 122, 7532, 10.1021/acs.chemrev.1c00432 · DOI
- Meister, 2013, An engineered calmodulin-based allosteric switch for Peptide biosensing, Chembiochem, 14, 1460, 10.1002/cbic.201300168 · DOI
- Mendes, 2019, An integrated workflow for crosslinking mass spectrometry, Molecular Systems Biology, 15, 10.15252/msb.20198994 · DOI
- Merkley, 2014, Distance restraints from crosslinking mass spectrometry: mining a molecular dynamics simulation database to evaluate lysine-lysine distances, Protein Science, 23, 747, 10.1002/pro.2458 · DOI
- Müller, 2001, Isotope-tagged cross-linking reagents: a new tool in mass spectrometric protein interaction analysis, Analytical Chemistry, 73, 1927, 10.1021/ac001379a · DOI
- Murakami, 2015, Structure of an RNA polymerase II preinitiation complex, PNAS, 112, 13543, 10.1073/pnas.1518255112 · DOI
- Nadeau, 2012, A review of methods used for identifying structural changes in A large protein complex, Methods in Molecular Biology, 796, 117, 10.1007/978-1-61779-334-9_7 · DOI
- Nikolov, 1995, Crystal structure of a TFIIB-TBP-TATA-element ternary complex, Nature, 377, 119, 10.1038/377119a0 · DOI
- Oberthuer, 2017, Double-flow focused liquid injector for efficient serial femtosecond crystallography, Scientific Reports, 7, 10.1038/srep44628 · DOI
- Patel, 2018, Structure of human TFIID and mechanism of TBP loading onto promoter DNA, Science, 362, 10.1126/science.aau8872 · DOI
- Patel, 2019, Architecture of the chromatin remodeler RSC and insights into its nucleosome engagement, eLife, 8, 10.7554/eLife.54449 · DOI
- Petrotchenko, 2005, Isotopically coded cleavable cross-linker for studying protein-protein interaction and protein complexes, Molecular & Cellular Proteomics, 4, 1167, 10.1074/mcp.T400016-MCP200 · DOI
- Pilla, 2015, Capturing conformational States in proteins using sparse paramagnetic NMR data, PLOS ONE, 10, 10.1371/journal.pone.0127053 · DOI
- Prabantu, 2020, Influence of disease-causing mutations on protein structural networks, Frontiers in Molecular Biosciences, 7, 10.3389/fmolb.2020.620554 · DOI
- Ranish, 1991, The yeast general transcription factor TFIIA is composed of two polypeptide subunits, The Journal of Biological Chemistry, 266, 19320, 10.1016/S0021-9258(18)55000-6 · DOI
- Riffle, 2016, ProXL (protein cross-linking database): a platform for analysis, visualization, and sharing of protein cross-linking mass spectrometry data, Journal of Proteome Research, 15, 2863, 10.1021/acs.jproteome.6b00274 · DOI
- Rinas, 2016, Development of a microflow system for in-cell footprinting coupled with mass spectrometry, Analytical Chemistry, 88, 10052, 10.1021/acs.analchem.6b02357 · DOI
- Ruwolt, 2022, Optimized TMT-based quantitative cross-linking mass spectrometry strategy for large-scale interactomic studies, Analytical Chemistry, 94, 5265, 10.1021/acs.analchem.1c04812 · DOI
- Sala, 2022, Modeling of protein conformational changes with Rosetta guided by limited experimental data, Structure, 30, 1157, 10.1016/j.str.2022.04.013 · DOI · Paper page
- Sannigrahi, 2020, The bright and dark sides of protein conformational switches and the unifying forces of infections, Communications Biology, 3, 10.1038/s42003-020-1115-x · DOI
- Sengupta, 2019, Monitoring site-specific conformational changes in real-time reveals a misfolding mechanism of the prion protein, eLife, 8, 10.7554/eLife.44698 · DOI
- Sicoli, 2019, Conformational tuning of a DNA-bound transcription factor, Nucleic Acids Research, 47, 5429, 10.1093/nar/gkz291 · DOI
- Tan, 1996, Crystal structure of a yeast TFIIA/TBP/DNA complex, Nature, 381, 127, 10.1038/381127a0 · DOI
- Telmer, 2003, Insights into the conformational equilibria of maltose-binding protein by analysis of high affinity mutants, The Journal of Biological Chemistry, 278, 34555, 10.1074/jbc.M301004200 · DOI
- Thompson, 2003, Tandem mass tags: A novel quantification strategy for comparative analysis of complex protein mixtures by MS/MS, Analytical Chemistry, 75, 1895, 10.1021/ac0262560 · DOI
- Tsai, 2000, Structural basis of preinitiation complex assembly on human pol II promoters, The EMBO Journal, 19, 25, 10.1093/emboj/19.1.25 · DOI
- Tsirigotaki, 2017, Dynamics and ligand-induced conformational changes in human prolyl oligopeptidase analyzed by hydrogen/deuterium exchange mass spectrometry, Scientific Reports, 7, 10.1038/s41598-017-02550-1 · DOI
- Valot, 2011, MassChroQ: a versatile tool for mass spectrometry quantification, Proteomics, 11, 3572, 10.1002/pmic.201100120 · DOI
- Vos, 2018, Structure of activated transcription complex Pol II-DSIF-PAF-SPT6, Nature, 560, 607, 10.1038/s41586-018-0440-4 · DOI · Paper page
- Walzthoeni, 2015, xTract: software for characterizing conformational changes of protein complexes by quantitative cross-linking mass spectrometry, Nature Methods, 12, 1185, 10.1038/nmeth.3631 · DOI
- Wang, 2017, Protein footprinting comes of age: mass spectrometry for biophysical structure assessment, Molecular & Cellular Proteomics, 16, 706, 10.1074/mcp.O116.064386 · DOI
- Wippel, 2022, Quantitative interactome analysis with chemical cross-linking and mass spectrometry, Current Opinion in Chemical Biology, 66, 10.1016/j.cbpa.2021.06.011 · DOI
- Yu, 2016, Developing a multiplexed quantitative cross-linking mass spectrometry platform for comparative structural analysis of protein complexes, Analytical Chemistry, 88, 10301, 10.1021/acs.analchem.6b03148 · DOI
- Zheng, 2019, Protein dynamics and conformational changes explored by hydrogen/deuterium exchange mass spectrometry, Current Opinion in Structural Biology, 58, 305, 10.1016/j.sbi.2019.06.007 · DOI
- Zhou, 2013, Covalent labeling with isotopically encoded reagents for faster structural analysis of proteins by mass spectrometry, Analytical Chemistry, 85, 9664, 10.1021/ac401978w · DOI
Metadata
- Authors
- Luo, J., & Ranish, J.
- Affiliations
- Institute for Systems Biology (US)
- Institute for Systems Biology
- ORCID
- Venue
- eLife
- Publisher
- eLife Sciences Publications, Ltd
- Published
- 2024-11-14
- Volume
- 13
- ISSN
- 2050-084X (ISSN-L)
- PMC
- PMC11563578
- OpenAlex
- W4402596750
- Cited by
- 2
- References
- 3
- Citations by year
- 2026: 1 · 2025: 1
- Type
- posted content
- Language
- en
- Open access
- gold
- doi.org
- Licence
- Locations
- eLife (publishedVersion, cc-by)
- PubMed Central (publishedVersion, cc-by)
- PubMed (publishedVersion)
- DOAJ (DOAJ: Directory of Open Access Journals) (submittedVersion, cc-by-sa)
- Funders
- National Institutes of Health (RO1GM136974, RO1GM108908, R01GM144559)
- Topics
- Physical Sciences › Chemistry › Spectroscopy › Mass Spectrometry Techniques and Applications
- Physical Sciences › Chemistry › Spectroscopy › Advanced Proteomics Techniques and Applications
- Life Sciences › Biochemistry, Genetics and Molecular Biology › Molecular Biology › Protein Structure and Dynamics
- Keywords
- protein conformational change, protein complexes, general transcription factors, TATA-binding protein, TFIIA, TFIIB, RNA polymerase II, biosensors, ternary complex
- MeSH terms
- Cross-Linking Reagents, Humans, Protein Conformation, Proteins, RNA Polymerase II, Mass Spectrometry, Multiprotein Complexes
About these checks
Registry, retraction, Cites and statistics results are computed, not judged, with one exception: a printed reference that no index lists is read once by a model before it counts as a citation error. Claims are extracted by a model and kept only when their quote appears verbatim in the text; each cited source is then checked, with a model’s help, for whether it says what the claim relies on. Those verdicts can be wrong — read the claim’s quote and the cited source before relying on one.
Statistics and arithmetic are recomputed, not judged.
Confidence bands are shown only for fields calibrated on our annotated test set. None is calibrated yet, so no band is shown.
What counts as a claim ›How we measure confidence ›How we check this ›
Are you an author, or do you see a problem with this page? Request a review
