

The DOI matches its Crossref record; 1 of the 1 references it cites were found in a registry or an index.
Public awareness of seafood mislabeling
Abstract
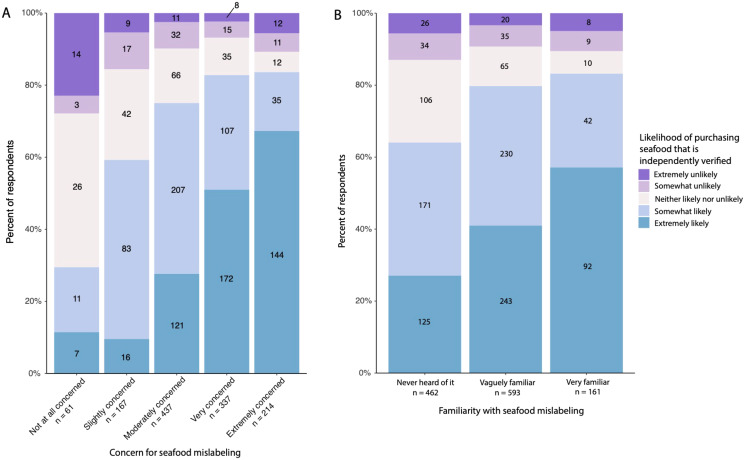
A substantial portion of seafood is mislabeled, causing significant impacts to human health, the environment, the economy, and society. Despite the large scientific literature documenting seafood mislabeling the public’s awareness of seafood mislabeling is unknown. We conducted an online survey to assess the public’s awareness and perceptions of seafood mislabeling. Of the 1,216 respondents, 38% had never heard of seafood mislabeling and 49% were only ‘vaguely familiar’ with it. After being provided the definition of seafood mislabeling 95% had some degree of concern. Respondents were the most concerned about environmental impacts caused by seafood mislabeling and the least concerned about the social justice implications. Respondents who were also more concerned and familiar with seafood mislabeling stated that they would be more likely to purchase seafood from a vendor where the labeling was independently verified.
Overview
The claims and statistics of this paper haven’t been checked yet.
Run the check — free, no account needed. It reads the open-access text and checks the sources it cites.
Integrity signals
Registry
Cites
Statistics
Figures
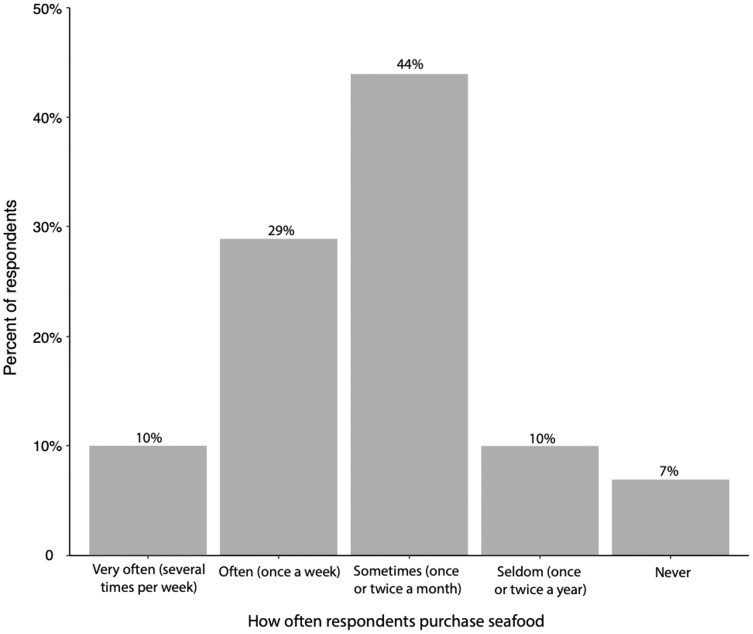
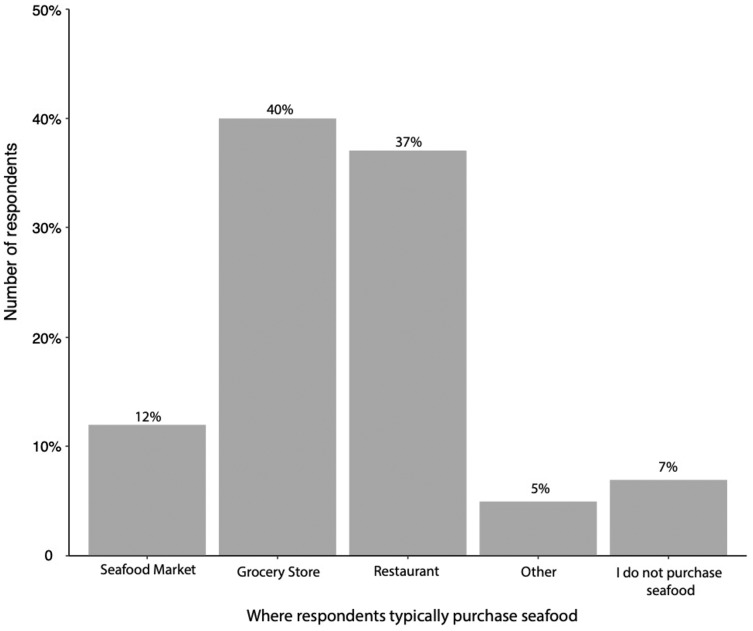
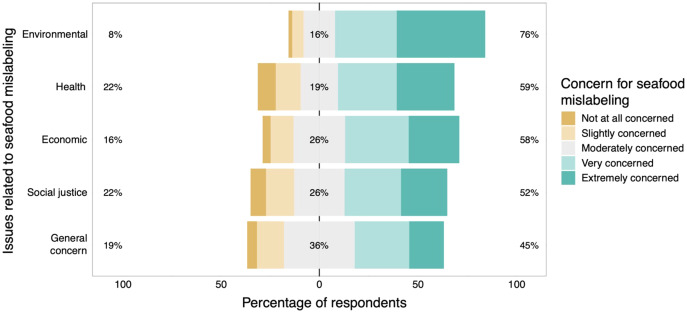
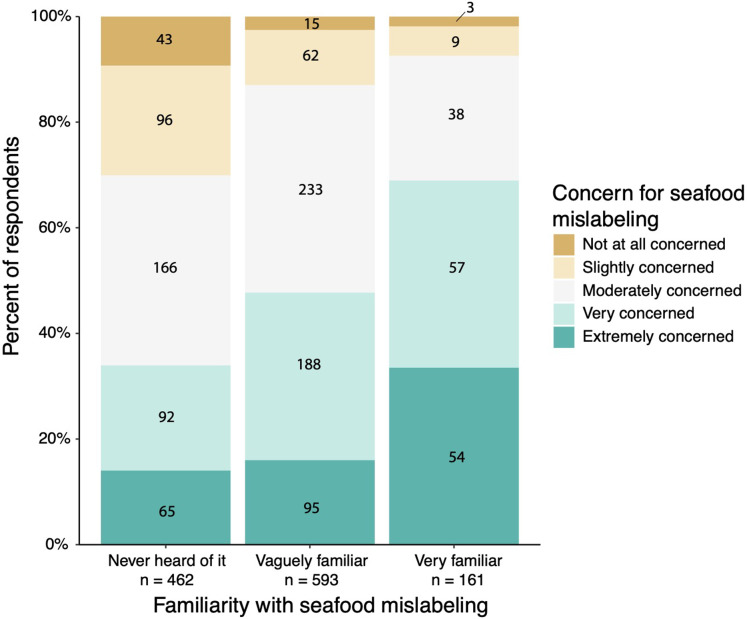
Verification
Claims the paper makes
The claims and statistics of this paper haven’t been checked yet.
Run the check — free, no account needed. It reads the open-access text and checks the sources it cites.
Claims other papers make about this one
Each is checked against this paper’s own text: does it say what the citing paper says it does?
In the citing paper
“Globally, consumer knowledge on seafood sourcing and traceability is limited, and many people may presume they are eating local seafood without checking (Zisser et al. 2012, Ryburn et al. 2022, Hirokawa and Thompson 2023).”
From Collapse of the oyster population in Apalachicola Bay: cascading social impacts from an ecologically and culturally significant species (2025) · cites this paper as Ryburn et al. 2022
Self-check
Percentages, sums and reported differences re-computed from the paper’s own numbers.
The self-check needs the paper’s full text.
Citations
Cites
Estimating the Worldwide Extent of Illegal Fishing
Agnew, D. J., Pearce, J., Pramod, G., Peatman, T., Watson, R., Beddington, J. R., & Pitcher, T. J. (2009) · PLoS ONE · doi:10.1371/journal.pone.0004570 · Cited by 1,009
Research works printed but not linked: 22
- Barendse, 2019, DNA barcoding validates species labelling of certified seafood, Current Biology, 29, R198, 10.1016/j.cub.2019.02.014 · DOI
- Béné, 2015, Feeding 9 billion by 2050–putting fish back on the menu, Food Security, 7, 261, 10.1007/s12571-015-0427-z · DOI
- Cline, 2012, Marketplace substitution of Atlantic salmon for Pacific salmon in Washington State detected by DNA barcoding, Food Research International, 45, 388, 10.1016/j.foodres.2011.10.043 · DOI
- FAO, 2016, Contributing to food security and nutrition for all, the state of world fisheries and aquaculture
- FAO, 2018, Meeting the sustainable development goals, the state of world fisheries and aquaculture
- Figgener, 2018, What I learnt pulling a straw out of a turtle’s nose, Nature, 563, 157, 10.1038/d41586-018-07287-z · DOI
- Golden, 2014, The global reach of seafood fraud: a current review of the literature 11
- Gutiérrez, 2012, Eco-label conveys reliable information on fish stock health to seafood consumers, PLOS ONE, 7, e43765, 10.1371/journal.pone.0043765 · DOI
- Jacquet, 2007, The rise of seafood awareness campaigns in an era of collapsing fisheries, Marine Policy, 31, 308, 10.1016/j.marpol.2006.09.003 · DOI
- Luque, 2019, The characterization of seafood mislabeling: a global meta-analysis, Biological Conservation, 236, 556, 10.1016/j.biocon.2019.04.006 · DOI
- Mariani, 2015, Low mislabeling rates indicate marked improvements in European seafood market operations, Frontiers in Ecology and the Environment, 13, 536, 10.1890/150119 · DOI
- Marko, 2014, Seafood substitutions obscure patterns of mercury contamination in patagonian toothfish (Dissostichus eleginoides) or chilean sea bass, PLOS ONE, 9, e104140, 10.1371/journal.pone.0104140 · DOI
- Matta, 1999, Heavy metals, lipid peroxidation, and ciguatera toxicity in the liver of the caribbean barracuda (Sphyraena barracuda), Biological Trace Element Research, 70, 69, 10.1007/BF02783850 · DOI
- Melo Palmeira, 2013, Commercialization of a critically endangered species (largetooth sawfish, Pristis perotteti) in fish markets of northern Brazil: authenticity by DNA analysis, Food Control, 34, 249, 10.1016/j.foodcont.2013.04.017 · DOI
- Naaum, 2016, Chapter 1 - seafood mislabeling incidence and impacts, 3, 10.1016/B978-0-12-801592-6.00001-2 · DOI
- Nakamura, 2018, Seeing slavery in seafood supply chains, Science Advances, 4, e1701833, 10.1126/sciadv.1701833 · DOI
- Sicherer, 2004, Prevalence of seafood allergy in the United States determined by a random telephone survey, Journal of Allergy and Clinical Immunology, 114, 159, 10.1016/j.jaci.2004.04.018 · DOI
- Spencer, 2019, Fishy business: red snapper mislabeling along the coastline of the Southeastern United States, Frontiers in Marine Science, 6, 97, 10.3389/fmars.2019.00513 · DOI
- Spencer, 2020, A high proportion of red snapper sold in North Carolina is mislabeled, PeerJ, 8, e9218, 10.7717/peerj.9218 · DOI
- Teh, 2013, Contribution of marine fisheries to worldwide employment: global marine fisheries employment, Fish and Fisheries, 14, 77, 10.1111/j.1467-2979.2011.00450.x · DOI
- Tveterås, 2012, Fish is food-the FAO’s fish price index, PLOS ONE, 7, e36731, 10.1371/journal.pone.0036731 · DOI
- Zabkar, 2013, Willingness to act and environmentally conscious consumer behaviour: can prosocial status perceptions help overcome the gap?, International Journal of Consumer Studies, 37, 257, 10.1111/j.1470-6431.2012.01134.x · DOI
Cited by
Sorted by citations
Mansfield, E., Lester, S., Rassweiler, A., & Brooke, S. (2025) · Ecology and Society · doi:10.5751/es-15989-300137 · Cited by 3
Metadata
- Authors
- Ryburn, S. J., Ballantine, W. M., Loncan, F. M., Manning, O. G., Alston, M. A., Steinwand, B., & Bruno, J. F.
- Affiliations
- Environment, Ecology and Energy Program, The University of North Carolina at Chapel Hill, Chapel Hill, North Carolina, United States
- The Department of Biology, The University of North Carolina at Chapel Hill, Chapel Hill, North Carolina, United States
- ORCID
- Alston, Meggan A.
- Venue
- PeerJ
- Publisher
- PeerJ
- Published
- 2022-06-28
- Volume
- 10
- Pages
- e13486
- ISSN
- 2167-8359
- PMC
- PMC9248779
- Cited by
- 24
- References
- 1
- Language
- en
- Funders
- Department of Biology at UNC-CH
- QEP (Quality Enhancement Plan) CURE (Course-based Undergraduate Research Experience) initiative
- National Science Foundation (OCE #1737071)
About these checks
Registry, retraction, Cites and statistics results are computed, not judged, with one exception: a printed reference that no index lists is read once by a model before it counts as a citation error. Claims are extracted by a model and kept only when their quote appears verbatim in the text; each cited source is then checked, with a model’s help, for whether it says what the claim relies on. Those verdicts can be wrong — read the claim’s quote and the cited source before relying on one.
Statistics and arithmetic are recomputed, not judged.
Confidence bands are shown only for fields calibrated on our annotated test set. None is calibrated yet, so no band is shown.
What counts as a claim ›How we measure confidence ›How we check this ›
Are you an author, or do you see a problem with this page? Request a review
