

The DOI matches its Crossref record.
Fluoride resistance capacity in mammalian cells involves complex global gene expression changes
Abstract
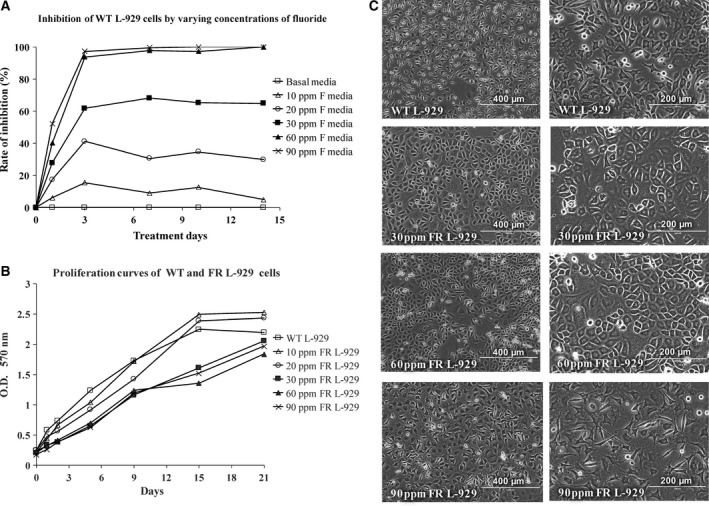
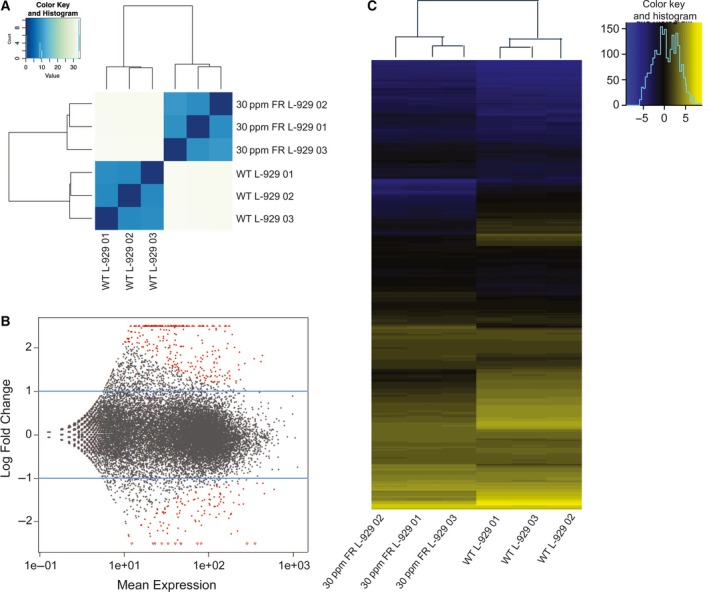
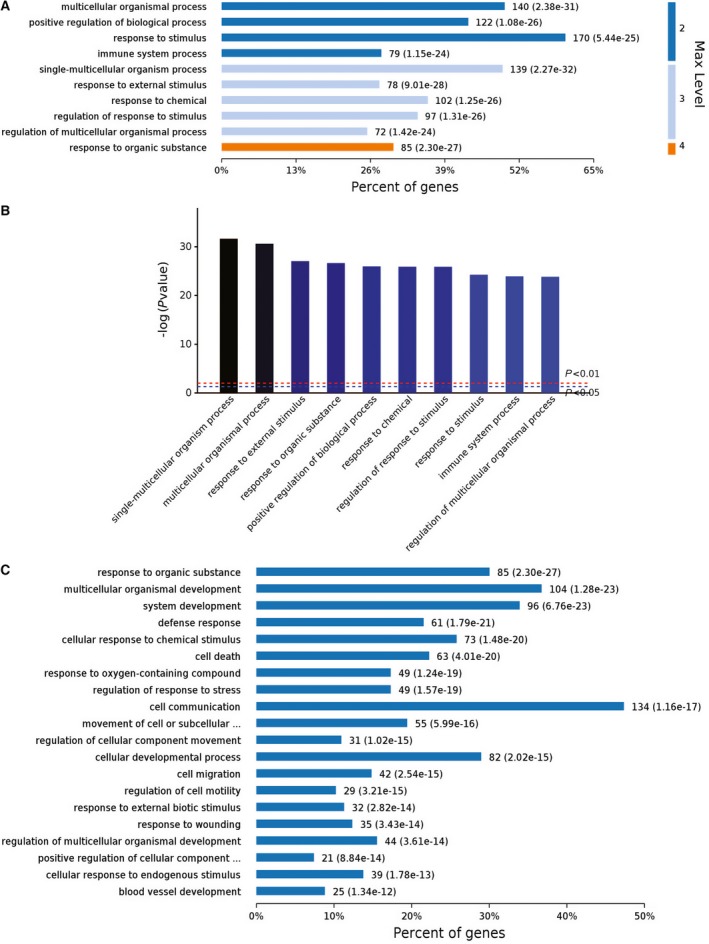
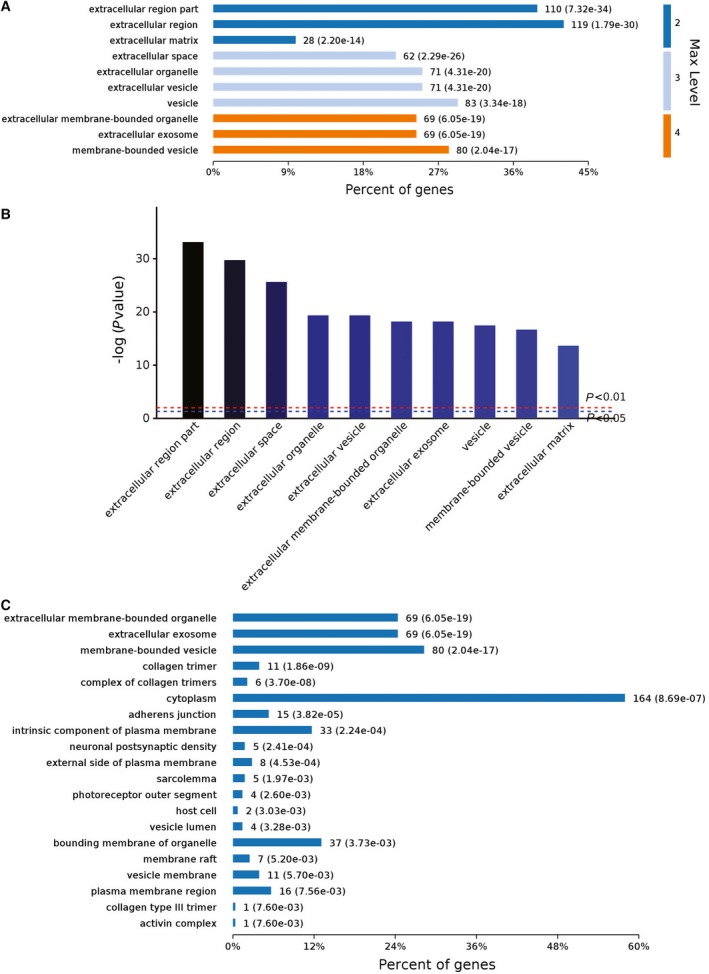
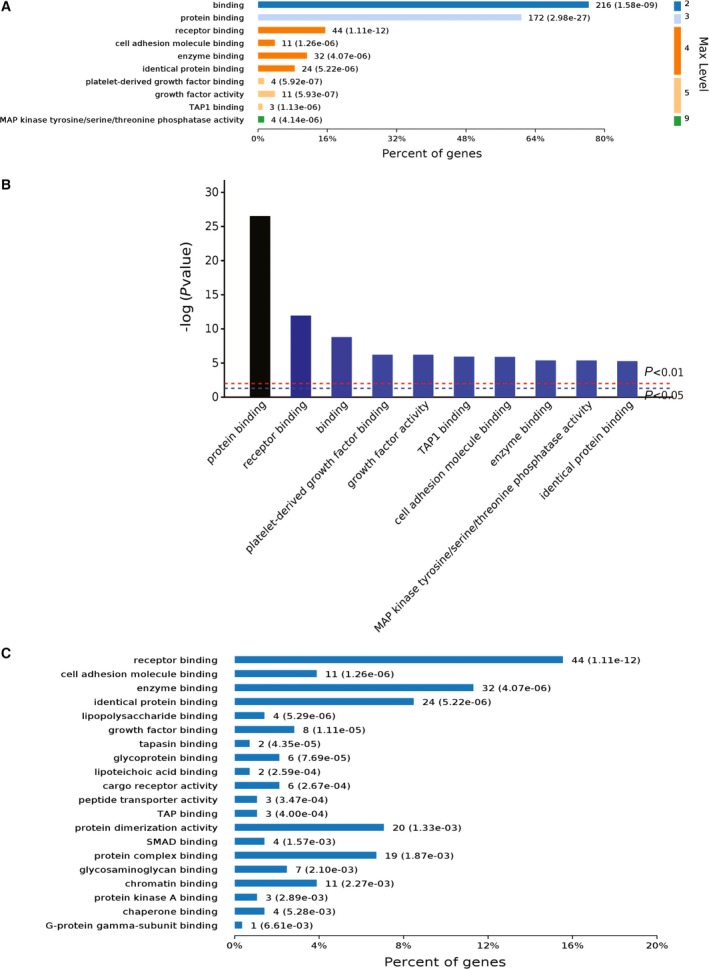
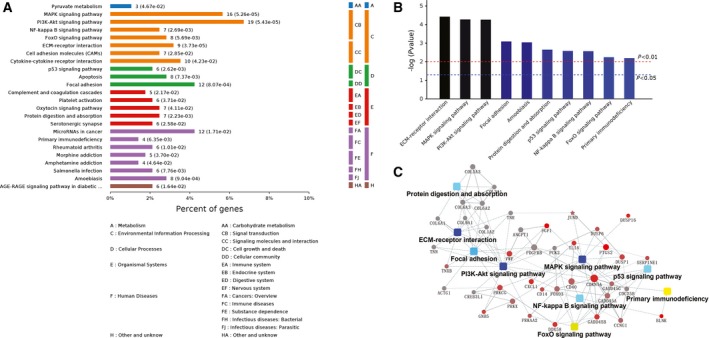
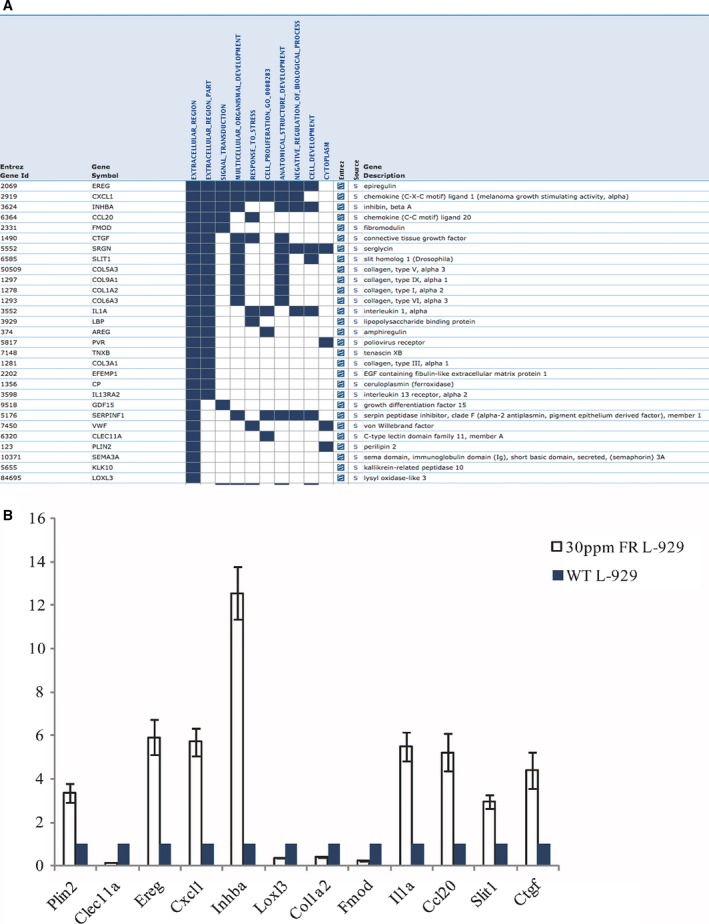
Fluorine is a bone‐seeking element ubiquitously present in the environment and widely used in many oral hygiene products. In humans, excessive intake of fluoride may cause dental and skeletal fluorosis. However, endemic fluorosis does not appear to develop in a proportion of individuals exposed to the same levels of fluoride. The mechanisms by which mammalian cells resist fluoride are still unclear. In this study, we developed strains of mouse L‐929 cells resistant to different levels of fluoride. High‐throughput RNA‐sequencing analyses of the fluoride‐resistant L‐929 cells indicated that massive changes in global gene expression occurred, compared with the wild‐type L‐929 cells. The main biological processes and functions changed were associated with the extracellular region and matrix, response to stress, receptor binding, and signal transduction. This indicated that high doses of fluoride not only exerted stress on L‐929 cells but also induced functional pathways that helped them adapt to the presence of fluoride or to expel it. These data should prove useful in identifying cellular processes or transporters/channels that play central roles in adaptation to or expulsion of fluoride in humans.
Overview
The claims and statistics of this paper haven’t been checked yet.
Run the check — free, no account needed. It reads the open-access text and checks the sources it cites.
Integrity signals
Registry
Cites
Statistics
Figures
Verification
Claims the paper makes
The claims and statistics of this paper haven’t been checked yet.
Run the check — free, no account needed. It reads the open-access text and checks the sources it cites.
Claims other papers make about this one
Each is checked against this paper’s own text: does it say what the citing paper says it does?
In the citing paper
“Bacterial metabolic pathways play a crucial role in maintaining oral health by supporting microbial balance and host [54].”
From Severity-dependent alterations in oral microbiota and antibiotic resistance in children with dental fluorosis (2026) · cites this paper as [54]
Self-check
Percentages, sums and reported differences re-computed from the paper’s own numbers.
The self-check needs the paper’s full text.
Citations
Cites
No references could be resolved yet.
Research works printed but not linked: 37
- 10.1002/cphy.c110038 · DOI
- 10.1080/10409230701829110 · DOI
- 10.1016/S0140-6736(08)61005-3 · DOI
- 10.1080/000163599428562 · DOI · Paper page
- 10.1177/00220345900690S128 · DOI · Paper page
- 10.1016/j.bmcl.2012.03.006 · DOI · Paper page
- 10.1016/j.cbi.2010.07.011 · DOI · Paper page
- 10.1021/cr2002855 · DOI
- 10.1177/00220345000790040301 · DOI
- 10.1152/ajplegacy.1972.223.3.596 · DOI
- 10.1111/j.1600-0773.1978.tb02260.x · DOI
- 10.1152/ajprenal.2001.280.5.F748 · DOI
- 10.1038/nature04713 · DOI
- 10.1073/pnas.1210896109 · DOI · Paper page
- 10.1073/pnas.1310439110 · DOI · Paper page
- 10.1126/science.1215063 · DOI · Paper page
- Stockbridge RB, 2013, A family of fluoride‐specific ion channels with dual‐topology architecture, Elife, 2, e01084, 10.7554/eLife.01084 · DOI · Paper page
- 10.1016/j.toxlet.2013.09.005 · DOI
- 10.1080/10643380600678112 · DOI
- Fawell JK, 2006, Fluoride in Drinking‐Water
- 10.1038/nature11152 · DOI · Paper page
- 10.2217/fmb.09.46 · DOI
- 10.1146/annurev.biochem.78.070507.135656 · DOI
- 10.1016/j.molcel.2011.08.024 · DOI · Paper page
- 10.1101/cshperspect.a003566 · DOI
- 10.1038/203976a0 · DOI
- Albright JA, 1966, Effect of fluoride on mammalian cells: partial reversal by pyruvate, J Oral Ther Pharmacol, 2, 436
- 10.1016/0014-4827(67)90190-5 · DOI
- 10.1139/g78-009 · DOI
- 10.1177/00220345740530023801 · DOI
- Helgeland K, 1976, pH and the cytotoxicity of fluoride in an animal cell culture system, Scand J Dent Res, 84, 37
- 10.1136/bmj.1.5433.486 · DOI
- 10.1136/bmj.1.5447.1435 · DOI
- Le Coultre‐Mulder GW, 1969, Influence of the fluorine ion on the growth in vitro of human amnion cells, T‐(kidney) cells, and HeLa cells, Acta Physiol Pharmacol Neerl, 15, 1
- 10.3109/00016358009003481 · DOI
- 10.1016/0309-1651(78)90063-2 · DOI
- 10.1016/0014-4827(67)90191-7 · DOI
Cited by
Sorted by citations
Xia, Y., Peng, S., Yu, J., Wang, Y., Ye, Y., Liu, M., Shang, L., Cui, X., Wang, P., & Ding, Z. (2026) · Journal of Oral Microbiology · doi:10.1080/20002297.2026.2714622
Metadata
- Authors
- Ran, S., Sun, N., Liu, Y., Zhang, W., Li, Y., Wei, L., Wang, J., & Liu, B.
- Affiliations
- Department of Endodontics and Operative Dentistry Ninth People's Hospital Shanghai Jiao Tong University School of Medicine Shanghai Key Laboratory of Stomatology Shanghai China
- Department of Physiology and Pathophysiology Fudan University Shanghai China
- The Ministry of Education Key Laboratory of Metabolism and Molecular Medicine Department of Biochemistry and Molecular Biology School of Basic Medical Sciences Fudan University Shanghai China
- Center for Dental Research Loma Linda University School of Dentistry CA USA
- Venue
- FEBS Open Bio
- Publisher
- Wiley
- Published
- 2017-06-05
- Volume
- 7
- Issue
- 7
- Pages
- 968-980
- ISSN
- 2211-5463
- PMC
- PMC5494298
- Cited by
- 10
- References
- 0
- Language
- en
- Funders
- National Natural Science Foundation of China (81100753)
About these checks
Registry, retraction, Cites and statistics results are computed, not judged, with one exception: a printed reference that no index lists is read once by a model before it counts as a citation error. Claims are extracted by a model and kept only when their quote appears verbatim in the text; each cited source is then checked, with a model’s help, for whether it says what the claim relies on. Those verdicts can be wrong — read the claim’s quote and the cited source before relying on one.
Statistics and arithmetic are recomputed, not judged.
Confidence bands are shown only for fields calibrated on our annotated test set. None is calibrated yet, so no band is shown.
What counts as a claim ›How we measure confidence ›How we check this ›
Are you an author, or do you see a problem with this page? Request a review
