

The DOI matches its Crossref record; 46 of the 47 references it cites were found in a registry or an index.
Metal–Organic Framework‐Surface‐Enhanced Infrared Absorption Platform Enables Simultaneous On‐Chip Sensing of Greenhouse Gases
Open accessAbstract
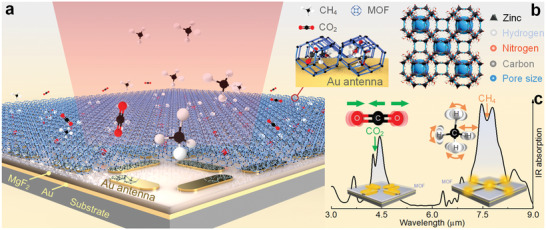
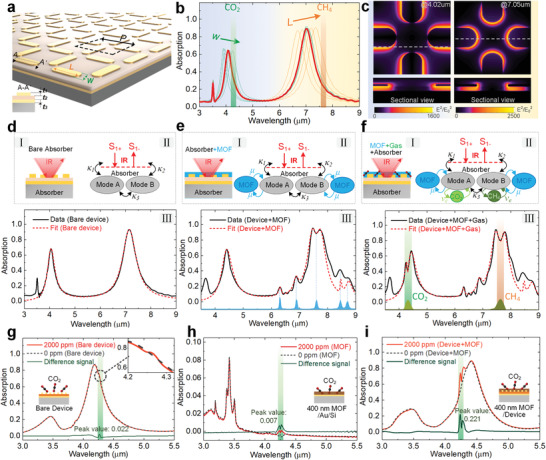
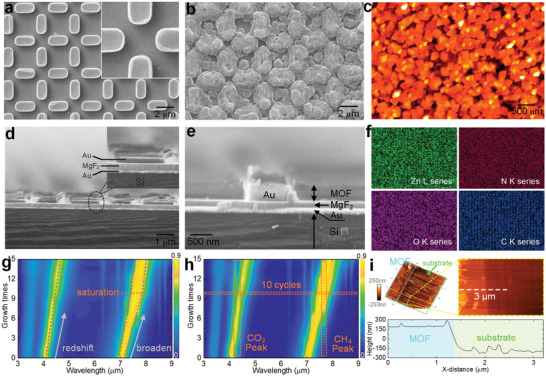
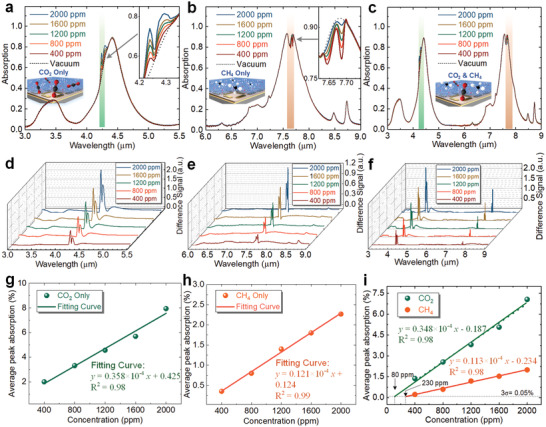
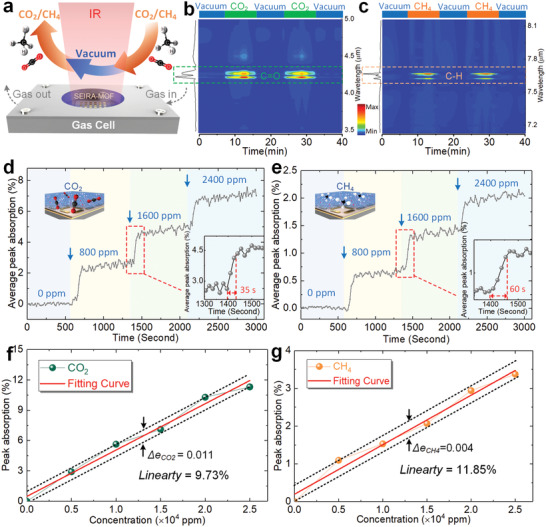
Simultaneous on‐chip sensing of multiple greenhouse gases in a complex gas environment is highly desirable in industry, agriculture, and meteorology, but remains challenging due to their ultralow concentrations and mutual interference. Porous microstructure and extremely high surface areas in metal–organic frameworks (MOFs) provide both excellent adsorption selectivity and high gases affinity for multigas sensing. Herein, it is described that integrating MOFs into a multiresonant surface‐enhanced infrared absorption (SEIRA) platform can overcome the shortcomings of poor selectivity in multigas sensing and enable simultaneous on‐chip sensing of greenhouse gases with ultralow concentrations. The strategy leverages the near‐field intensity enhancement (over 1500‐fold) of multiresonant SEIRA technique and the outstanding gas selectivity and affinity of MOFs. It is experimentally demonstrated that the MOF–SEIRA platform achieves simultaneous on‐chip sensing of CO 2 and CH 4 with fast response time (<60 s), high accuracy (CO 2: 1.1%, CH 4: 0.4%), small footprint (100 × 100 µm 2), and excellent linearity in wide concentration range (0–2.5 × 10 4 ppm). Additionally, the excellent scalability to detect more gases is explored. This work opens up exciting possibilities for the implementation of all‐in‐one, real‐time, and on‐chip multigas detection as well as provides a valuable toolkit for greenhouse gas sensing applications.
Overview
The claims and statistics of this paper haven’t been checked yet.
Run the check — free, no account needed. It reads the open-access text and checks the sources it cites.
Integrity signals
Registry
Cites
Statistics
Figures
Verification
Claims the paper makes
The claims and statistics of this paper haven’t been checked yet.
Run the check — free, no account needed. It reads the open-access text and checks the sources it cites.
Claims other papers make about this one
Each is checked against this paper’s own text: does it say what the citing paper says it does?
The cited source says what the claim attributes to it.
In the citing paper
“Previous works show many solutions using multiple resonances of nanoantenna structures to capture the plasmonic enhanced molecular fingerprints in separate wavelength ranges for sensing different molecule species22,39,41,50,54–56.”
From Wavelength-multiplexed hook nanoantennas for machine learning enabled mid-infrared spectroscopy (2022) · cites this paper as [22]
In the citing paper
“The molecular enrichment strategies, including functionalized chemical bonding17,18, chemical reaction19,20, physical adsorption21–23, optical trapping24 as well as passive trapping by undercut structure25–28 bring in the additional working requirements (e.g., chemical stimuli, temperature, pressure, pump power, etc.) for specific molecules, impeding the system for global molecular recognition.”
From Wavelength-multiplexed hook nanoantennas for machine learning enabled mid-infrared spectroscopy (2022) · cites this paper as [22]
In the citing paper
“Figure 2b summarizes three approaches to optimize nanoantenna sensing by increasing μ. Hotspots release is proposed to increase accessible sensing areas for analytes, which are usually blocked by the substrate, to further enhance the coupling efficiency25–28.”
From Wavelength-multiplexed hook nanoantennas for machine learning enabled mid-infrared spectroscopy (2022) · cites this paper as [22]
In the citing paper
“In PNA-based surface-enhanced IR absorption spectroscopy (SEIRAS), the great challenge is the limited bandwidth of nanoantenna resonances compared with the ultra-broadband vibrational absorption fingerprints.”
From Wavelength-multiplexed hook nanoantennas for machine learning enabled mid-infrared spectroscopy (2022) · cites this paper as [22]
Self-check
Percentages, sums and reported differences re-computed from the paper’s own numbers.
The self-check needs the paper’s full text.
Citations
Cites
Exceptional chemical and thermal stability of zeolitic imidazolate frameworks
Park, K. S., Ni, Z., Côté, A. P., Choi, J. Y., Huang, R., Uribe‐Romo, F. J., Chae, H. K., O’Keeffe, M., & Yaghi, O. M. (2006) · Proceedings of the National Academy of Sciences · doi:10.1073/pnas.0602439103 · Cited by 7,710
Infrared Perfect Absorber and Its Application As Plasmonic Sensor
Liu, N., Mesch, M., Weiss, T., Hentschel, M., & Giessen, H. W. (2010) · Nano Letters · doi:10.1021/nl9041033 · Cited by 2,842
Hodgkinson, J., & Tatam, R. P. (2012) · Measurement Science and Technology · doi:10.1088/0957-0233/24/1/012004 · Cited by 1,759
Temporal coupled-mode theory for the Fano resonance in optical resonators
Fan, S., Suh, W., & Joannopoulos, J. D. (2003) · Journal of the Optical Society of America A · doi:10.1364/josaa.20.000569 · Cited by 1,700
Infrared Spatial and Frequency Selective Metamaterial with Near-Unity Absorbance
Liu, X., Starr, T., Starr, A. F., & Padilla, W. J. (2010) · Physical Review Letters · doi:10.1103/physrevlett.104.207403 · Cited by 1,200
Lu, G. M., & Hupp, J. T. (2010) · Journal of the American Chemical Society · doi:10.1021/ja101415b · Cited by 1,084
Wu, C., Khanikaev, A. B., Adato, R., Arju, N., Yanik, A. A., Altug, H., & Shvets, G. B. (2011) · Nature Materials · doi:10.1038/nmat3161 · Cited by 1,043
Surface-Enhanced Infrared Spectroscopy Using Resonant Nanoantennas
Neubrech, F., Huck, C., Weber, K., Pucci, A., & Giessen, H. W. (2017) · Chemical Reviews · doi:10.1021/acs.chemrev.6b00743 · Cited by 651
Cong, L., Tan, S., Yahiaoui, R., Yan, F., Zhang, W., & Singh, R. (2015) · Applied Physics Letters · doi:10.1063/1.4906109 · Cited by 544
Dual-Band Perfect Absorber for Multispectral Plasmon-Enhanced Infrared Spectroscopy
Chen, K., Adato, R., & Altug, H. (2012) · ACS Nano · doi:10.1021/nn3026468 · Cited by 523
Cited by
Sorted by citations
Li, D., Yadav, A., Zhou, H., Roy, K., Thanasekaran, P., & Lee, C. (2024) · Global Challenges · doi:10.1002/gch2.202300244 · Cited by 437
Self-citationLiu, L., Guo, X., & Lee, C. (2021) · Nano Energy · doi:10.1016/j.nanoen.2021.106304 · Cited by 417
Self-citationWang, C., He, T., Zhou, H., Zhang, Z., & Lee, C. (2023) · Bioelectronic Medicine · doi:10.1186/s42234-023-00118-1 · Cited by 295
Self-citationRecent progress on MOF-based optical sensors for VOC sensing
Shen, Y., Tissot, A., & Serre, C. (2022) · Chemical Science · doi:10.1039/d2sc04314a · Cited by 261
Wu, Q., & Wang, Y. (2022) · Energy Economics · doi:10.1016/j.eneco.2022.105990 · Cited by 247
Liu, L., Guo, X., Liu, W., & Lee, C. (2021) · Nanomaterials · doi:10.3390/nano11112975 · Cited by 205
Self-citationZhou, H., Xu, L., Ren, Z., Zhu, J., & Lee, C. (2022) · Nanoscale Advances · doi:10.1039/d2na00608a · Cited by 145
Self-citationSurface Functionalized Sensors for Humidity‐Independent Gas Detection
Qu, F., Zhang, S., Huang, C., Guo, X., Zhu, Y., Thomas, T., Guo, H., Attfield, J. P., & Yang, M. (2020) · Angewandte Chemie International Edition · doi:10.1002/anie.202015856 · Cited by 141
Reconfigurable terahertz metamaterials: From fundamental principles to advanced 6G applications
Xu, C., Ren, Z., Wei, J., & Lee, C. (2022) · iScience · doi:10.1016/j.isci.2022.103799 · Cited by 142
Self-citationWavelength-multiplexed hook nanoantennas for machine learning enabled mid-infrared spectroscopy
Ren, Z., Zhang, Z., Wei, J., Dong, B., & Lee, C. (2022) · Nature Communications · doi:10.1038/s41467-022-31520-z · Cited by 132
Self-citationRecent Progress in Silicon‐Based Photonic Integrated Circuits and Emerging Applications
Xiao, Z., Liu, W., Xu, S., Zhou, J., Ren, Z., & Lee, C. (2023) · Advanced Optical Materials · doi:10.1002/adom.202301028 · Cited by 133
Self-citationMetasurface‐Enhanced Infrared Spectroscopy: An Abundance of Materials and Functionalities
John‐Herpin, A., Tittl, A., Kühner, L., Richter, F., Huang, S. H., Shvets, G. B., Oh, S., & Altug, H. (2022) · Advanced Materials · doi:10.1002/adma.202110163 · Cited by 137
Progress of optomechanical micro/nano sensors: a review
Liu, X., Liu, W., Ren, Z., Ma, Y., Dong, B., Zhou, G., & Lee, C. (2021) · International Journal of Optomechatronics · doi:10.1080/15599612.2021.1986612 · Cited by 115
Self-citationOptical Metasurfaces for Biomedical Imaging and Sensing
Kim, H., Yun, H. K., Jeong, S., Lee, S., Cho, E., & Rho, J. (2025) · ACS Nano · doi:10.1021/acsnano.4c14751 · Cited by 114
Hui, X., Yang, C., Li, D., He, X., Huang, H., Zhou, H., Chen, M., Lee, C., & Mu, X. (2021) · Advanced Science · doi:10.1002/advs.202100583 · Cited by 99
Self-citationMicroscale fiber photoacoustic spectroscopy for in situ and real-time trace gas sensing
Ma, J., Fan, E., Liu, H., Zhang, Y., Mai, C., Li, X., Jin, W., & Guan, B. (2024) · Advanced Photonics · doi:10.1117/1.ap.6.6.066008 · Cited by 101
Three-Dimensional Printed Ultrabroadband Terahertz Metamaterial Absorbers
Shen, Z., Li, S., Xu, Y., Yin, W., Zhang, L., & Chen, X. (2021) · Physical Review Applied · doi:10.1103/physrevapplied.16.014066 · Cited by 94
Self-citationZhou, H., Li, D., Hui, X., & Mu, X. (2021) · International Journal of Optomechatronics · doi:10.1080/15599612.2021.1953199 · Cited by 93
Self-citationLiu, W., Ma, Y., Chang, Y., Dong, B., Wei, J., Ren, Z., & Lee, C. (2021) · Nanophotonics · doi:10.1515/nanoph-2021-0029 · Cited by 91
Self-citationZhang, Z., Liu, X., Zhou, H., Xu, S., & Lee, C. (2023) · Small Structures · doi:10.1002/sstr.202300325 · Cited by 99
Self-citationLiu, W., Ma, Y., Liu, X., Zhou, J., Xu, C., Dong, B., & Lee, C. (2022) · Nano Letters · doi:10.1021/acs.nanolett.2c01198 · Cited by 89
Self-citationMultifunctional Terahertz Biodetection Enabled by Resonant Metasurfaces
Wang, R., Ruan, H., Li, D., Huang, L., Jiang, R., Zhang, X., Yang, X., Wang, L., Wang, S., Kivshar, Y. S., et al. (2025) · Advanced Materials · doi:10.1002/adma.202418147 · Cited by 85
Self-citationExpanding chiral metamaterials for retrieving fingerprints via vibrational circular dichroism
Xu, C., Ren, Z., Zhou, H., Zhou, J., Ho, C. P., Wang, N., & Lee, C. (2023) · Light Science & Applications · doi:10.1038/s41377-023-01186-3 · Cited by 84
Self-citationZhai, Y., Ye, J., Zhang, Y., Zhang, K., Zhan, E., Zhang, X., & Yang, Y. (2024) · Chemical Engineering Journal · doi:10.1016/j.cej.2024.149286 · Cited by 79
Ren, Z., Xu, J., Le, X., & Lee, C. (2021) · Micromachines · doi:10.3390/mi12080946 · Cited by 80
Self-citationHe, T., Wen, F., Yang, Y., Le, X., Liu, W., & Lee, C. (2023) · Analytical Chemistry · doi:10.1021/acs.analchem.2c04527 · Cited by 75
Self-citationA Review of Metal–Organic Framework‐Based Compounds for Environmental Applications
Qian, Y., Zhang, F., Kang, D. J., & Pang, H. (2022) · Energy & environment materials · doi:10.1002/eem2.12414 · Cited by 73
Li, D., Zhou, H., Hui, X., He, X., Huang, H., Zhang, J., Mu, X., Lee, C., & Yang, Y. F. (2021) · Advanced Science · doi:10.1002/advs.202101879 · Cited by 70
Self-citationSunildutt, N., Parihar, P., Salih, A. R. C., Lee, S. H., & Choi, K. H. (2023) · Frontiers in Pharmacology · doi:10.3389/fphar.2023.1139229 · Cited by 68
Xu, J., Du, Y., Tian, Y., & Wang, C. (2020) · International Journal of Optomechatronics · doi:10.1080/15599612.2020.1857890 · Cited by 65
Zhou, H., Li, D., Ren, Z., Mu, X., & Lee, C. (2022) · InfoMat · doi:10.1002/inf2.12349 · Cited by 61
Self-citationLi, D., Zhou, H., Hui, X., He, X., & Mu, X. (2021) · Analytical Chemistry · doi:10.1021/acs.analchem.1c01078 · Cited by 60
Self-citationMetal–organic frameworks (MOFs) toward SO 2 detection
Obeso, J. L., Flores, C. V., Peralta, R. A., Viniegra, M., Martín-Guaregua, N., Huxley, M. T., Solís-Ibarra, D., Ibarra, I. A., & Janiak, C. (2025) · Chemical Society Reviews · doi:10.1039/d4cs00997e · Cited by 58
Sun, Z., He, T., Ren, Z., Wang, C., Liu, X., Zhang, Z., Zhou, J., Guo, X., Yang, Y., & Lee, C. (2025) · SmartSys · doi:10.1002/sys3.4 · Cited by 60
Self-citationReview on Metasurfaces: An Alternative Approach to Advanced Devices and Instruments
Zhao, X., Sun, Z., Zhang, L., Wang, Z., Xie, R., Zhao, J., You, R., & You, Z. (2022) · Advanced Devices & Instrumentation · doi:10.34133/2022/9765089 · Cited by 60
MOF/Polymer-Integrated Multi-Hotspot Mid-Infrared Nanoantennas for Sensitive Detection of CO2 Gas
Zhou, H., Ren, Z., Xu, C., Xu, L., & Lee, C. (2022) · Nano-Micro Letters · doi:10.1007/s40820-022-00950-1 · Cited by 58
Self-citationZhou, H., Li, D., Lv, Q., & Lee, C. (2025) · Chemical Society Reviews · doi:10.1039/d4cs00427b · Cited by 58
Self-citationOver-coupled resonator for broadband surface enhanced infrared absorption (SEIRA)
Paggi, L., Fabas, A., Ouazzani, H. E., Hugonin, J., Fayard, N., Bardou, N., Dupuis, C., Greffet, J., & Bouchon, P. (2023) · Nature Communications · doi:10.1038/s41467-023-40511-7 · Cited by 56
Surface-enhanced spectroscopy technology based on metamaterials
Li, D., Wu, X., Chen, Z., Liu, T., & Mu, X. (2025) · Microsystems & Nanoengineering · doi:10.1038/s41378-025-00905-7 · Cited by 58
Self-citationGuo, X., Zhang, Z., Ren, Z., Li, D., Xu, C., Wang, L., Liu, W., Zhuge, Y., Zhou, G., & Lee, C. (2025) · Advanced Materials · doi:10.1002/adma.202510417 · Cited by 57
Self-citationPhonon-Enhanced Mid-Infrared CO2 Gas Sensing Using Boron Nitride Nanoresonators
Bareza, N., Paulillo, B., Slipchenko, T. M., Autore, M., Dolado, I., Liu, S., Edgar, J. H., Vélez, S., Martín-Moreno, L., Hillenbrand, R., et al. (2022) · ACS Photonics · doi:10.1021/acsphotonics.1c01254 · Cited by 53
Organ-on-a-chip microengineering for bio-mimicking disease models and revolutionizing drug discovery
Ahmed, T. (2022) · Biosensors and Bioelectronics X · doi:10.1016/j.biosx.2022.100194 · Cited by 56
Li, D., Xu, C., Xie, J., & Lee, C. (2023) · Nanomaterials · doi:10.3390/nano13162377 · Cited by 51
Self-citationLi, D., Zhou, H., Chen, Z., Ren, Z., Xu, C., He, X., Liu, T., Chen, X., Huang, H., Lee, C., et al. (2023) · Advanced Materials · doi:10.1002/adma.202301787 · Cited by 50
Self-citationLi, D., Zhou, H., Ren, Z., & Lee, C. (2025) · Small Science · doi:10.1002/smsc.202400250 · Cited by 48
Self-citationLi, D., Xie, Z., Qu, M., Zhang, Q. Y., Fu, Y., & Xie, J. (2021) · ACS Applied Materials & Interfaces · doi:10.1021/acsami.1c13046 · Cited by 48
Self-citationSurface Functionalized Sensors for Humidity‐Independent Gas Detection
Qu, F., Zhang, S., Huang, C., Guo, X., Zhu, Y., Thomas, T., Guo, H., Attfield, J. P., & Yang, M. (2020) · Angewandte Chemie · doi:10.1002/ange.202015856 · Cited by 45
Zhou, H., Ren, Z., Li, D., Xu, C., Mu, X., & Lee, C. (2023) · Nature Communications · doi:10.1038/s41467-023-43127-z · Cited by 44
Self-citationSurface plasmons-phonons for mid-infrared hyperspectral imaging
Zhou, H., Li, D., Ren, Z., Xu, C., Wang, L., & Lee, C. (2024) · Science Advances · doi:10.1126/sciadv.ado3179 · Cited by 45
Self-citationLiu, X., Zhang, Z., Zhou, J., Liu, W., Zhou, G., & Lee, C. (2024) · Small · doi:10.1002/smll.202400035 · Cited by 43
Self-citationLi, Z., Liu, J., Yi, X., Wu, W., Li, F., Zhu, Z., Li, H., Shi, J., Xu, Y., Zhou, F., et al. (2021) · Advanced Functional Materials · doi:10.1002/adfm.202109541 · Cited by 38
Xu, C., Ren, Z., Zhou, H., Zhou, J., Li, D., & Lee, C. (2023) · Advanced Functional Materials · doi:10.1002/adfm.202314482 · Cited by 36
Self-citationXia, L., Liu, Y., Chen, R. T., Weng, B., & Zou, Y. (2024) · Applied Physics Reviews · doi:10.1063/5.0197236 · Cited by 38
Xie, J., Ren, Z., Wei, J., Liu, W., Zhou, J., & Lee, C. (2023) · Advanced Optical Materials · doi:10.1002/adom.202202867 · Cited by 36
Self-citationPlasmonic nanosensors for pharmaceutical and biomedical analysis
Akgönüllü, S., & Deni̇zli̇, A. (2023) · Journal of Pharmaceutical and Biomedical Analysis · doi:10.1016/j.jpba.2023.115671 · Cited by 35
Wang, X., Qi, H., Shao, Y., Zhao, M., Chen, H., Chen, Y., Ying, Y., & Wang, Y. (2024) · Advanced Science · doi:10.1002/advs.202400207 · Cited by 36
Zhou, H., Li, D., & Lee, C. (2025) · AI Sensors · doi:10.3390/aisens1010005 · Cited by 37
Self-citationMiniaturized CO2 Gas Sensor Using 20% ScAlN-Based Pyroelectric Detector
Ng, D. K. T., Xu, L., Chen, W., Wang, H., Gu, Z., Chia, X. X., Fu, Y. H., Jaafar, N. B., Ho, C. P., Zhang, T., et al. (2022) · ACS Sensors · doi:10.1021/acssensors.2c00980 · Cited by 33
Ultra-compact broadband terahertz spectroscopy sensor enabled by resonant-gradient metasurface
Wang, R., Zhang, D., Chen, L., Zhang, N., Li, D., Jiang, R., Zhang, X., Yang, X., Zhang, L., Wang, S., et al. (2025) · Nature Communications · doi:10.1038/s41467-025-66310-w · Cited by 37
Self-citationBoron-nitride nanostructures for the detection of harmful gases (CO, CO2, H2S, N2O, and SO2)
Palomino‐Asencio, L., García‐Hernández, E., Shakerzadeh, E., & Anota, E. C. (2024) · Computational and Theoretical Chemistry · doi:10.1016/j.comptc.2024.114613 · Cited by 32
Zhou, J., Zhang, H., Qiao, Q., Chen, H., Huang, Q., Wang, H., Ren, Q., Wang, N., Ma, Y., & Lee, C. (2024) · Nature Communications · doi:10.1038/s41467-024-54704-1 · Cited by 31
Self-citationTerahertz molecular vibrational sensing using 3D printed anapole meta-biosensor
Yang, C., Shen, Z., Cui, Y., Zhang, N., Zhang, L., Yan, R., & Chen, X. (2025) · Biosensors and Bioelectronics · doi:10.1016/j.bios.2025.117351 · Cited by 31
Self-citationMEMS enabled suspended silicon waveguide platform for long-wave infrared modulation applications
Liu, X., Qiao, Q., Dong, B., Liu, W., Xu, C., Xu, S., & Zhou, G. (2022) · International Journal of Optomechatronics · doi:10.1080/15599612.2022.2137608 · Cited by 29
Sensing Technologies for Outdoor/Indoor Farming
Wang, L., Xiao, M., Guo, X., Yang, Y., Zhang, Z., & Lee, C. (2024) · Biosensors · doi:10.3390/bios14120629 · Cited by 28
Self-citationA hybrid graphene metamaterial absorber for enhanced modulation and molecular fingerprint retrieval
Chen, Z., Li, D., Zhou, H., Liu, T., & Mu, X. (2023) · Nanoscale · doi:10.1039/d3nr02830e · Cited by 28
Self-citationMa, Y., Liu, W., Liu, X., Wang, N., & Zhang, H. (2024) · International Journal of Optomechatronics · doi:10.1080/15599612.2024.2342279 · Cited by 29
Mid‐infrared integrated electro‐optic modulators: a review
Xu, T., Dong, Y., Zhong, Q., Zheng, S., Qiu, Y., Zhao, X., Jia, L., Lee, C., & Hu, T. (2023) · Nanophotonics · doi:10.1515/nanoph-2023-0286 · Cited by 29
Self-citationOn‐Chip Near‐Infrared Spectral Sensing with Minimal Plasmon‐Modulated Channels
Zheng, Q., Nan, X., Chen, B., Wang, H., Hu, N., Gao, M., Liu, Z., Wen, L., Cumming, D. R. S., & Chen, Q. (2023) · Laser & Photonics Review · doi:10.1002/lpor.202300475 · Cited by 24
Bassous, N. J., Rodriguez, A. C., Leal, C. I. L., Jung, H. Y., Lee, C. K., Joo, S., Kim, S., Yun, C., Hahm, M. G., Ahn, M., et al. (2023) · Advanced Sensor Research · doi:10.1002/adsr.202300094 · Cited by 24
Self-citationLi, D., Zhou, H., Ren, Z., Xu, C., & Lee, C. (2024) · Nano-Micro Letters · doi:10.1007/s40820-024-01520-3 · Cited by 26
Self-citationKong, Y., Zhao, Z., Wang, Y., Yang, S., Huang, G., Wang, Y., Liu, C., You, C., Tan, J., Wang, C., et al. (2021) · ACS Applied Materials & Interfaces · doi:10.1021/acsami.1c16322 · Cited by 23
Coupling tandem MOFs in metal-insulator-metal resonator advanced chemo-sieving sensing
Li, Z., Liu, J., Feng, L., Liu, X., Xu, Y., Zhou, F., & Liu, W. (2022) · Nano Today · doi:10.1016/j.nantod.2022.101726 · Cited by 23
Wang, J., Xie, Z., Zhu, Y., Zeng, P., He, S., Wang, J., Wei, H., & Yu, C. (2024) · Trends in Environmental Analytical Chemistry · doi:10.1016/j.teac.2024.e00226 · Cited by 24
Xie, J., Ren, Z., Zhou, H., Zhou, J., Liu, W., & Lee, C. (2024) · Advanced Optical Materials · doi:10.1002/adom.202401582 · Cited by 21
Self-citationZheng, C., Pi, M., Song, F., Li, Y., Peng, Z., Guan, G., Zhang, L., Ma, Y., Min, Y., Ye, W., et al. (2023) · Journal of Lightwave Technology · doi:10.1109/jlt.2023.3262774 · Cited by 21
Recent advances in nanostructured substrates for surface-enhanced infrared absorption spectroscopy
Wang, J., Zeng, P., Xiao, X., Zhou, C. S., Wei, H., & Yu, C. (2023) · Nanotechnology · doi:10.1088/1361-6528/acd943 · Cited by 21
AI‑driven photonic noses: from conventional sensors to cloud‑to-edge intelligent microsystems
Zhou, H., Zhang, H., Zhang, R., Yuan, X., & Chang, H. (2025) · Microsystems & Nanoengineering · doi:10.1038/s41378-025-01058-3 · Cited by 20
Self-citationZhang, D., Xiao, L., Xiong, G., He, Q., Pan, Z. S., & Ma, G. (2023) · Journal of Coatings Technology and Research · doi:10.1007/s11998-023-00769-4 · Cited by 19
Ultrasensitive Plasmon‐Enhanced Infrared Spectroelectrochemistry
Li, J. P., Wu, D., Li, J., Zhou, Y., Yan, Z., Liang, J., Zhang, Q., & Xia, X. (2024) · Angewandte Chemie International Edition · doi:10.1002/anie.202319246 · Cited by 17
Gas Sensing of Organophosphorous Compounds with Iii-V Semiconductor PlasmonicsPreprint
Fehlen, P., Thomas, G., Gonzalez-Posada, F., Guise, J., Rusconi, F., Cerutti, L., Taliercio, T., & Spitzer, D. (2022) · SSRN Electronic Journal · doi:10.2139/ssrn.4178083 · Cited by 16
Nuñez, J., Boersma, A., Grand, J., Mintova, S., & Sciacca, B. (2021) · Advanced Functional Materials · doi:10.1002/adfm.202101623 · Cited by 14
Barauskas, D., Pelenis, D., Dzikaras, M., Vanagas, G., Mikolajūnas, M., Baltrušaitis, J., & Viržonis, D. (2023) · Sensors and Actuators B Chemical · doi:10.1016/j.snb.2023.134178 · Cited by 13
Wu, S., Chen, C., Wu, X., Tian, F., Ma, Y., Xu, Y., & Hu, H. (2023) · Sensors and Actuators B Chemical · doi:10.1016/j.snb.2023.133560 · Cited by 13
Peng, Z., Huang, Y., Zheng, K., Min, Y., Zhao, H., Pi, M., Song, F., Zheng, C., Zhang, Y., Chang, Z., et al. (2024) · Analytical Chemistry · doi:10.1021/acs.analchem.3c04793 · Cited by 13
Designing Hybrid Plasmonic Superlattices with Spatially Confined Responsive Heterostructural Units
Liu, J., Luo, H., Li, Z., Ye, P., Zhang, J., Khaniyev, B., Mukhametkarimov, Y. S., Ibraimov, M., & Xu, Y. (2025) · Nano Letters · doi:10.1021/acs.nanolett.4c05072 · Cited by 11
Adi, W., Beisenova, A., Biswas, S. K., Chen, Y., Rosas, S., Unnikrishnan, V., Zheng, T., Kondelaji, M. H. R., Kuruoğlu, F., Arvelo, E. R., et al. (2025) · ACS Photonics · doi:10.1021/acsphotonics.5c00838 · Cited by 11
Multifunctional Terahertz Metasensor Based on Multi-Fano Resonance for Ultrasensitive Biodetection
Ruan, H., Zhong, Y., Wang, R., & Zhang, X. (2024) · IEEE Transactions on Plasma Science · doi:10.1109/tps.2024.3368191 · Cited by 10
Artificial Intelligence of Things in Hydrogen Sensing: Toward Optic and Intelligent System
Zhu, J., Zhan, Y., Ni, X., & Gao, Y. (2025) · Research · doi:10.34133/research.0750 · Cited by 14
Wen, Y., Zhu, H., Song, F., Chen, R., Zheng, C., Pi, M., Zhang, Y., & Wang, Y. (2025) · Spectrochimica Acta Part A Molecular and Biomolecular Spectroscopy · doi:10.1016/j.saa.2025.126621 · Cited by 10
Jiang, T., Bhattacharya, A., Barkey, M., Aigner, A., Rohrer, L., Weber, T., Wang, J., Maier, S. A., & Tittl, A. (2025) · Advanced Functional Materials · doi:10.1002/adfm.202516021 · Cited by 10
Luo, S., Ding, Y., Pan, M., Zhou, R., Han, H., Liao, Z., & Chen, D. (2024) · Optics & Laser Technology · doi:10.1016/j.optlastec.2024.111685 · Cited by 8
Huang, S., Chen, Q., Li, Y., Duan, L., Zhao, X., Lu, Y., & Chen, Z. (2026) · Biosensors · doi:10.3390/bios16010053 · Cited by 8
Hu, W., Chen, W., Shi, J., Lin, C. Y., & Li, X. (2024) · Applied Surface Science · doi:10.1016/j.apsusc.2024.160875 · Cited by 6
Chen, R., Tang, L., Li, G., Luo, P., Wang, Y., Wu, X., Nong, J., & Wei, W. (2024) · Analytical Chemistry · doi:10.1021/acs.analchem.4c03765 · Cited by 5
Advanced Waveguide Based LOC Biosensors: A Minireview
Kanjwal, M. A., & Ghaferi, A. A. A. (2022) · Sensors · doi:10.3390/s22145443 · Cited by 5
Shen, Z., Zhang, L., & Chen, X. (2022) · Optics & Laser Technology · doi:10.1016/j.optlastec.2022.108265 · Cited by 5
Self-citationBatool, S. M., Batool, S. S., Bazrafkan, A., Thomsan., D., Miranda, M., Braaten, B. D., & Oduor, P. G. (2026) · Materials Today Sustainability · doi:10.1016/j.mtsust.2026.101321 · Cited by 4
Li, D., Chen, Z., Wu, X., Liu, T., Zhang, G., Mu, X., & Lee, C. (2026) · ACS Nano · doi:10.1021/acsnano.5c20156 · Cited by 4
Self-citationEnhanced light–matter interaction in plasmonic nanocavities: principle, challenge, and perspective
Song, D., Lu, Z., Guo, Q., Zhang, T., Ji, J., Zhang, Y., Ding, T., Govorov, A. O., Dong, Z., Zhang, S., et al. (2026) · Photonics Insights · doi:10.3788/pi.2026.r01 · Cited by 5
Li, Y., Luo, Y., Lin, X., Li, D., Gong, T., Wang, C., & Yue, W. (2025) · Surfaces and Interfaces · doi:10.1016/j.surfin.2025.105758 · Cited by 4
Self-citation
Metadata
- Authors
- Zhou, H., Hui, X., Li, D., Hu, D., Chen, X., He, X., Gao, L., Huang, H., Lee, C., & Mu, X.
- Affiliations
- Chongqing University (CN)
- National University of Singapore (SG)
- Corresponding author
- Lee, Chengkuo
- Mu, Xiaojing
- ORCID
- Venue
- Advanced Science
- Publisher
- Wiley
- Published
- 2020-09-18
- Volume
- 7
- Issue
- 20
- Pages
- 2001173-2001173
- ISSN
- 2198-3844 (ISSN-L)
- PMC
- PMC7578855
- OpenAlex
- W3087008916
- Cited by
- 136
- References
- 47
- Citations by year
- 2026: 10 · 2025: 29 · 2024: 26 · 2023: 28 · 2022: 20 · 2021: 19 · 2020: 4
- FWCI
- 6.10
- Type
- journal article
- Language
- en
- Open access
- gold
- doi.org
- Licence
- Locations
- Advanced Science (publishedVersion, cc-by)
- PubMed Central (publishedVersion, cc-by)
- PubMed (publishedVersion)
- National University of Singapore (submittedVersion)
- DOAJ (DOAJ: Directory of Open Access Journals) (submittedVersion, cc-by-sa)
- Funders
- National Key Research and Development Program of China (2019YFB2004800, 2019YFB2004803, 2016YFB0402702)
- Fundamental Research Funds for the Central Universities (2019CDCGGD320)
- Topics
- Physical Sciences › Engineering › Electrical and Electronic Engineering › Gas Sensing Nanomaterials and Sensors
- Physical Sciences › Chemistry › Spectroscopy › Spectroscopy and Laser Applications
- Physical Sciences › Chemistry › Inorganic Chemistry › Metal-Organic Frameworks: Synthesis and Applications
- Keywords
- metal-organic frameworks, surface-enhanced infrared absorption, carbon dioxide detection, methane detection, gas selectivity
About these checks
Registry, retraction, Cites and statistics results are computed, not judged, with one exception: a printed reference that no index lists is read once by a model before it counts as a citation error. Claims are extracted by a model and kept only when their quote appears verbatim in the text; each cited source is then checked, with a model’s help, for whether it says what the claim relies on. Those verdicts can be wrong — read the claim’s quote and the cited source before relying on one.
Statistics and arithmetic are recomputed, not judged.
Confidence bands are shown only for fields calibrated on our annotated test set. None is calibrated yet, so no band is shown.
What counts as a claim ›How we measure confidence ›How we check this ›
Are you an author, or do you see a problem with this page? Request a review
