

The DOI matches its Crossref record; 70 of the 71 references it cites were found in a registry or an index.
Modeling Sporadic Alzheimer's Disease in Human Brain Organoids under Serum Exposure
Open accessAbstract
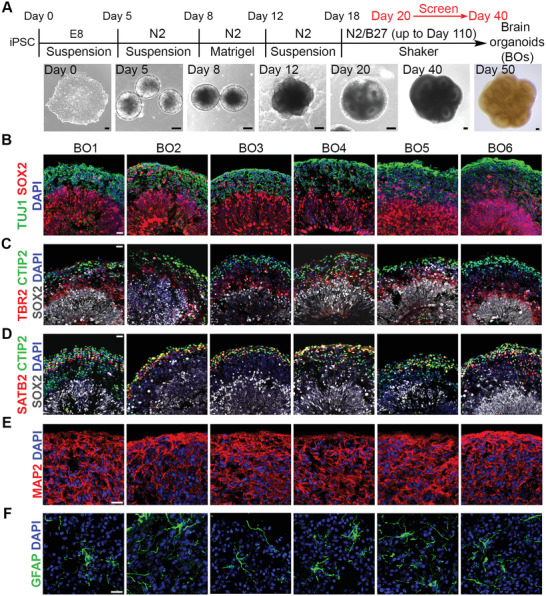
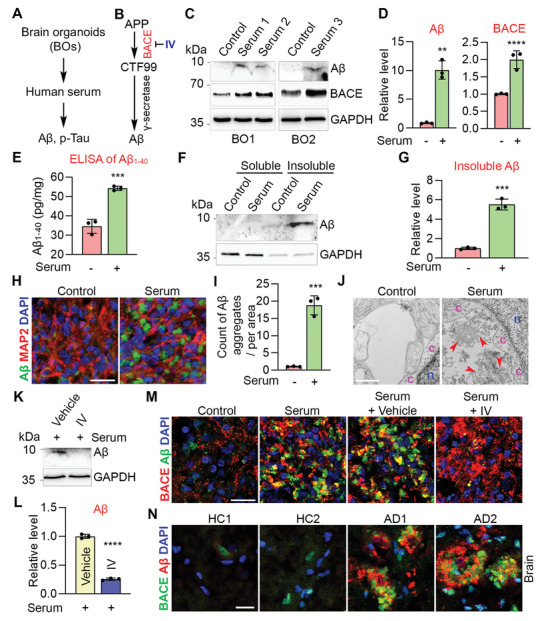
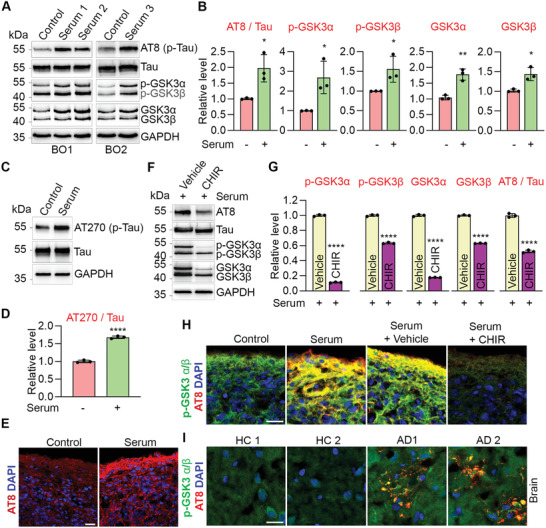
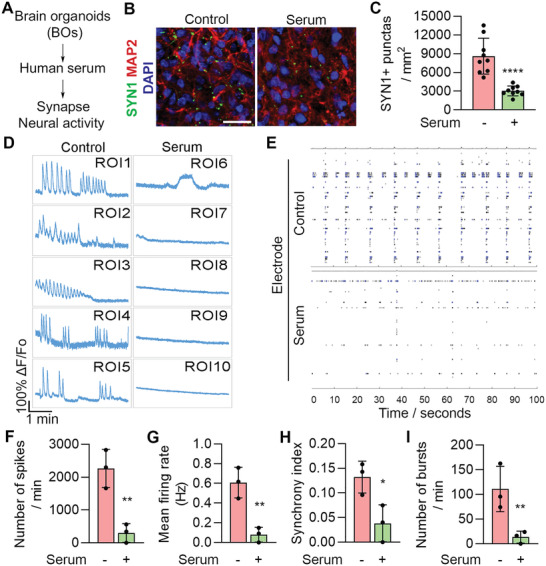
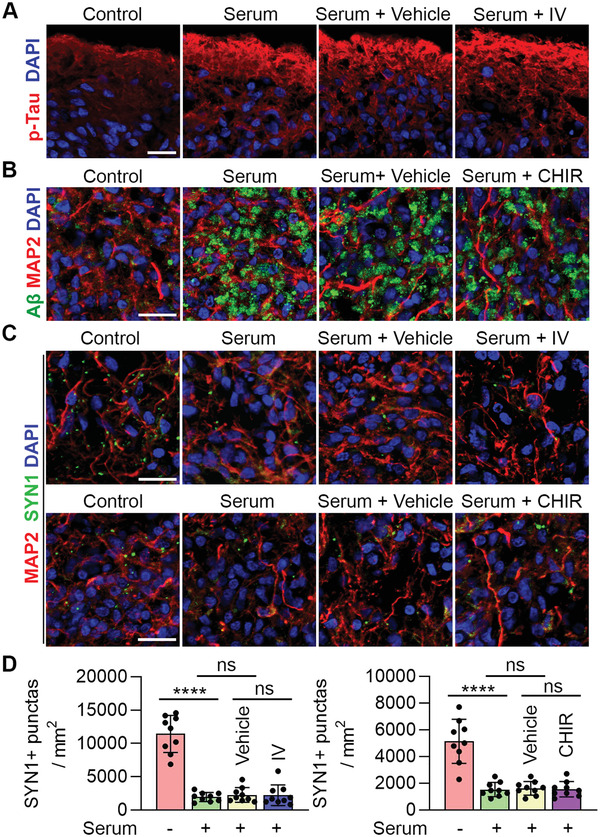
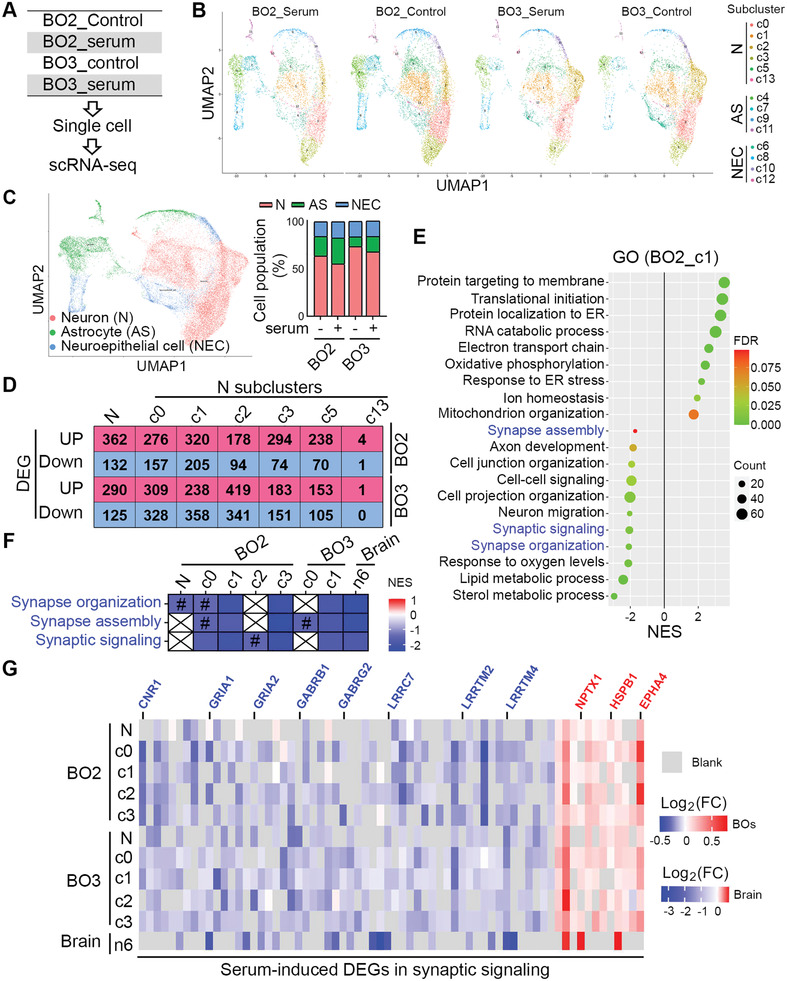
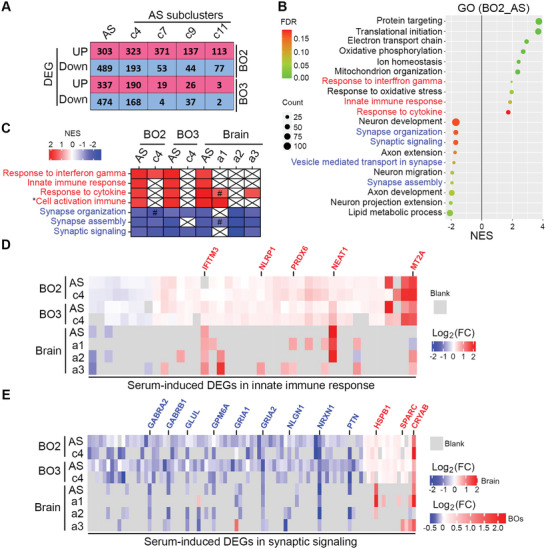
Alzheimer's disease (AD) is a progressive neurodegenerative disease with no cure. Huge efforts have been made to develop anti‐AD drugs in the past decades. However, all drug development programs for disease‐modifying therapies have failed. Possible reasons for the high failure rate include incomplete understanding of complex pathophysiology of AD, especially sporadic AD (sAD), and species difference between humans and animal models used in preclinical studies. In this study, sAD is modeled using human induced pluripotent stem cell (hiPSC)‐derived 3D brain organoids. Because the blood–brain barrier (BBB) leakage is a well‐known risk factor for AD, brain organoids are exposed to human serum to mimic the serum exposure consequence of BBB breakdown in AD patient brains. The serum‐exposed brain organoids are able to recapitulate AD‐like pathologies, including increased amyloid beta (A β ) aggregates and phosphorylated microtubule‐associated tau protein (p‐Tau) level, synaptic loss, and impaired neural network. Serum exposure increases A β and p‐Tau levels through inducing beta‐secretase 1 (BACE) and glycogen synthase kinase‐3 alpha / beta (GSK3 α / β ) levels, respectively. In addition, single‐cell transcriptomic analysis of brain organoids reveals that serum exposure reduced synaptic function in both neurons and astrocytes and induced immune response in astrocytes. The human brain organoid‐based sAD model established in this study can provide a powerful platform for both mechanistic study and therapeutic development in the future.
Overview
The claims and statistics of this paper haven’t been checked yet.
Run the check — free, no account needed. It reads the open-access text and checks the sources it cites.
Integrity signals
Registry
Cites
Statistics
Figures
Verification
Claims the paper makes
The claims and statistics of this paper haven’t been checked yet.
Run the check — free, no account needed. It reads the open-access text and checks the sources it cites.
Claims other papers make about this one
Each is checked against this paper’s own text: does it say what the citing paper says it does?
The cited source says what the claim attributes to it.
In the citing paper
“To mimic BBB leakage-induced sporadic AD, human induced pluripotent stem cell (hiPSC)-derived brain organoids (BOs, composed of neurons and astrocytes) were exposed to serum to recapitulate AD-like pathologies (Figure 3I).31”
From Reverse the progression of Alzheimer’s disease through Nano-ERASER-based adult neuroregeneration (2026) · cites this paper as [31]
Self-check
Percentages, sums and reported differences re-computed from the paper’s own numbers.
The self-check needs the paper’s full text.
Citations
Cites
Subramanian, A., Tamayo, P., Mootha, V. K., Mukherjee, S., Ebert, B. L., Gillette, M. A., Paulovich, A., Pomeroy, S. L., Golub, T. R., Lander, E. S., et al. (2005) · Proceedings of the National Academy of Sciences · doi:10.1073/pnas.0506580102 · Cited by 53,625
Induction of Pluripotent Stem Cells from Adult Human Fibroblasts by Defined Factors
Takahashi, K., Tanabe, K., Ohnuki, M., Narita, M., Ichisaka, T., Tomoda, K., & Yamanaka, S. (2007) · Cell · doi:10.1016/j.cell.2007.11.019 · Cited by 20,221
Neuropathological stageing of Alzheimer-related changes.
Braak, H., & Braak, E. (1991) · Acta Neuropathologica · doi:10.1007/bf00308809 · Cited by 16,123
Comprehensive Integration of Single-Cell Data
Stuart, T., Butler, A., Hoffman, P., Hafemeister, C., Papalexi, E., Mauck, W. M., Hao, Y., Stoeckius, M., Smibert, P., & Satija, R. (2019) · Cell · doi:10.1016/j.cell.2019.05.031 · Cited by 15,453
Amyloid oligomers exacerbate tau pathology in a mouse model of tauopathy
Selenica, M.-L. B., Brownlow, M., Jimenez, J. P., Lee, D. C., Pena, G., Dickey, C. A., Gordon, M. N., & Morgan, D. (2013) · Neurodegenerative Diseases · doi:10.1159/000337230 · Cited by 10,359
Induced Pluripotent Stem Cell Lines Derived from Human Somatic Cells
Yu, J., Vodyanik, M. A., Smuga-Otto, K., Antosiewicz-Bourget, J., Frane, J. L., Tian, S., Nie, J., Jonsdottir, G. A., Ruotti, V., Stewart, R., et al. (2007) · Science · doi:10.1126/science.1151526 · Cited by 10,310
Molecular signatures database (MSigDB) 3.0
Liberzon, A., Subramanian, A., Pinchback, R., Thorvaldsdóttir, H., Tamayo, P., & Mesirov, J. P. (2011) · Bioinformatics · doi:10.1093/bioinformatics/btr260 · Cited by 7,111
Cerebral organoids model human brain development and microcephaly
Lancaster, M. A., Renner, M., Martin, C.-A., Wenzel, D., Bicknell, L. S., Hurles, M. E., Homfray, T., Penninger, J. M., Jackson, A. P., & Knoblich, J. A. (2013) · Nature · doi:10.1038/nature12517 · Cited by 5,372
Aran, D., Looney, A. P., Liu, L., Wu, E., Fong, V., Hsu, A., Chak, S., Naikawadi, R. P., Wolters, P. J., Abate, A. R., et al. (2019) · Nature Immunology · doi:10.1038/s41590-018-0276-y · Cited by 4,984
Meta-Analysis of 74,046 Individuals Identifies 11 New Susceptibility Loci for Alzheimer’s Disease
(EADI), E. A. D. I., Lambert, J.-C., (GERAD), G. A. E. R. I. A. D., Alzheimer's Disease Genetic Consortium (ADGC), (CHARGE), C. F. H. A. A. R. I. G. E., Ibrahim-Verbaas, C. A., Harold, D., Naj, A. C., Sims, R., Bellenguez, C., et al. (2013) · Nature Genetics · doi:10.1038/ng.2802 · Cited by 4,336
Research works printed but not linked: 1
- Yoon S. J., 2019, Nat. Methods, 75, 1675
Cited by
Sorted by citations
Induced pluripotent stem cells (iPSCs): molecular mechanisms of induction and applications
Cerneckis, J., Cai, H., & Shi, Y. (2024) · Signal Transduction and Targeted Therapy · doi:10.1038/s41392-024-01809-0 · Cited by 452
Self-citationOrganoids: The current status and biomedical applications
Yang, S., Hu, H., Kung, H., Zou, R.-Q., Dai, Y.-S., Hu, Y.-F., Wang, T., Lv, T., Yu, J., & Li, F. (2023) · MedComm · doi:10.1002/mco2.274 · Cited by 300
Three-Dimensional Cell Cultures: The Bridge between In Vitro and In Vivo Models
Urzì, O., Gasparro, R., Costanzo, E., Luca, A. D., Giavaresi, G., Fontana, S., & Alessandro, R. (2023) · International Journal of Molecular Sciences · doi:10.3390/ijms241512046 · Cited by 258
Neuropathogenesis-on-chips for neurodegenerative diseases
Amartumur, S., Nguyen, H. M., Huynh, T., Kim, T. S., Woo, R., Oh, E., Kim, K. K., Lee, L. P., & Heo, C. (2024) · Nature Communications · doi:10.1038/s41467-024-46554-8 · Cited by 131
Zhou, L., Huang, J., Li, C., Gu, Q., Li, G., Li, Z. A., Xu, J., Zhou, J., & Tuan, R. S. (2025) · Med · doi:10.1016/j.medj.2025.100667 · Cited by 126
Yao, Q., Cheng, S., Pan, Q., Yu, J., Cao, G., Li, L., & Cao, H. (2024) · MedComm · doi:10.1002/mco2.735 · Cited by 100
Ji, Y., Chen, X., Wang, Z., Meek, C. J., McLean, J. L., Yang, Y., Yuan, C., Rochet, J., Liu, F., & Xu, R. (2025) · Molecular Psychiatry · doi:10.1038/s41380-025-03041-w · Cited by 74
Self-citationPushing the boundaries of brain organoids to study Alzheimer’s disease
Cerneckis, J., Bu, G., & Shi, Y. (2023) · Trends in Molecular Medicine · doi:10.1016/j.molmed.2023.05.007 · Cited by 63
Self-citationShi, C., Zhang, J., Wang, H., Chen, C., Han, M., Gao, L., Tang, C., Sun, P., Zhao, X., Guo, F., et al. (2022) · Advanced Materials · doi:10.1002/adma.202210262 · Cited by 60
Human 3D brain organoids: steering the demolecularization of brain and neurological diseases
Adlakha, Y. K. (2023) · Cell Death Discovery · doi:10.1038/s41420-023-01523-w · Cited by 63
Promoting Alzheimer’s disease research and therapy with stem cell technology
Cao, Z., Kong, F., Ding, J., Chen, C., He, F., & Deng, W. (2024) · Stem Cell Research & Therapy · doi:10.1186/s13287-024-03737-w · Cited by 60
Acharya, P., Choi, N. Y., Shrestha, S., Jeong, S., & Lee, M. (2023) · Biotechnology and Bioengineering · doi:10.1002/bit.28606 · Cited by 50
Protecting Human and Animal Health: The Road from Animal Models to New Approach Methods
Kaplan, B. L. F., Hoberman, A. M., Slikker, W., Smith, M. A., Corsini, E., Knudsen, T. B., Marty, S., Sobrian, S. K., Fitzpatrick, S. C., Ratner, M. H., et al. (2024) · Pharmacological Reviews · doi:10.1124/pharmrev.123.000967 · Cited by 51
Vascular network-inspired diffusible scaffolds for engineering functional midbrain organoids
Cai, H., Tian, C., Chen, L., Yang, Y., Sun, A. X., McCracken, K. W., Tchieu, J. H., Gu, M., Mackie, K., & Guo, F. (2025) · Cell stem cell · doi:10.1016/j.stem.2025.02.010 · Cited by 58
Brain organoids are new tool for drug screening of neurological diseases
Zhou, J.-Q., Zeng, L., Li, C.-T., He, D.-H., Zhao, H.-D., Xu, Y., Jin, Z.-T., & Gao, C. (2023) · Neural Regeneration Research · doi:10.4103/1673-5374.367983 · Cited by 47
Current progress of cerebral organoids for modeling Alzheimer's disease origins and mechanisms
Sreenivasamurthy, S., Laul, M., Zhao, N., Kim, T., & Zhu, D. (2022) · Bioengineering & Translational Medicine · doi:10.1002/btm2.10378 · Cited by 49
Toward the next generation of vascularized human neural organoids
Li, M., Gao, L., Zhao, L., Zou, T., & Xu, H. (2022) · Medicinal Research Reviews · doi:10.1002/med.21922 · Cited by 45
The blood-brain barrier, a key bridge to treat neurodegenerative diseases
Hang, Z., Zhou, L., Xing, C., Wen, Y., & Du, H. (2023) · Ageing Research Reviews · doi:10.1016/j.arr.2023.102070 · Cited by 46
Applications of lung cancer organoids in precision medicine: from bench to bedside
Li, H., Chen, Z., Chen, N., Fan, Y., Xu, Y., & Xu, X. (2023) · Cell Communication and Signaling · doi:10.1186/s12964-023-01332-9 · Cited by 48
Jusop, A. S., Thanaskody, K., Tye, G. J., Dass, S. A., Zaman, W. S. W. K., & Nordin, F. (2023) · Frontiers in Molecular Neuroscience · doi:10.3389/fnmol.2023.1173433 · Cited by 42
Induced Pluripotent Stem Cells in Drug Discovery and Neurodegenerative Disease Modelling
Beghini, D. G., Kasai-Brunswick, T. H., & Henriques‐Pons, A. (2024) · International Journal of Molecular Sciences · doi:10.3390/ijms25042392 · Cited by 37
Sun, G. G., Wang, C., Mazzarino, R. C., Perez-Corredor, P. A., Davtyan, H., Blurton-Jones, M., Lopera, F., Arboleda-Velasquez, J. F., & Shi, Y. (2024) · Cell Reports · doi:10.1016/j.celrep.2024.114982 · Cited by 36
Self-citationOrganoid biobanking, autonomy and the limits of consent
Lewis, J., & Holm, S. (2022) · Bioethics · doi:10.1111/bioe.13047 · Cited by 41
Induced Pluripotent Stem Cells and Organoids in Advancing Neuropathology Research and Therapies
Pazzin, D. B., Previato, T. T. R., Gonçalves, J. I. B., Zanirati, G., Xavier, F. A. C., DaCosta, J. C., & Marinowic, D. R. (2024) · Cells · doi:10.3390/cells13090745 · Cited by 36
Zhang, Y., Tang, C., He, Y., Zhang, Y., Li, Q., Zhang, T., Zhao, B., Tong, A., Zhong, Q., & Zhong, Z. (2024) · Biomedicine & Pharmacotherapy · doi:10.1016/j.biopha.2024.117540 · Cited by 36
Advances and Applications of Brain Organoids
Li, Y., Zeng, P.-M., Wu, J., & Luo, Z. (2023) · Neuroscience Bulletin · doi:10.1007/s12264-023-01065-2 · Cited by 40
Brain organoids: building higher-order complexity and neural circuitry models
Maisumu, G., Willerth, S. M., Nestor, M. W., Waldau, B., Schülke, S., Nardi, F. V., Ahmed, O., Zhou, Y., Durens, M., Liang, B., et al. (2025) · Trends in biotechnology · doi:10.1016/j.tibtech.2025.02.009 · Cited by 40
Garcia, G., Fernandes, A., Stein, F., & Brites, D. (2022) · Frontiers in Pharmacology · doi:10.3389/fphar.2022.833066 · Cited by 32
Organoids and microphysiological systems: Promising models for accelerating AAV gene therapy studies
Ramamurthy, R. M., Atala, A., Porada, C. D., & Almeida-Porada, G. D. (2022) · Frontiers in Immunology · doi:10.3389/fimmu.2022.1011143 · Cited by 35
3D printing of drug delivery systems enhanced with micro/nano-technology
Zhu, H., Kuang, H., Huang, X., Li, X., Zhao, R., Shang, G., Wang, Z., Liao, Y.-C., He, J., & Li, D. (2024) · Advanced Drug Delivery Reviews · doi:10.1016/j.addr.2024.115479 · Cited by 33
Liu, E., Karpf, L., & Bohl, D. (2021) · Frontiers in Molecular Neuroscience · doi:10.3389/fnmol.2021.767041 · Cited by 32
Liu, Z., Chao, J., Wang, C., Sun, G., Roeth, D., Liu, W., Chen, X., Li, L., Tian, E., Feng, L., et al. (2023) · Cell Reports · doi:10.1016/j.celrep.2023.112841 · Cited by 30
Self-citationBrain organoids-on-chip for neural diseases modeling: History, challenges and trends
Zhang, H., Huang, N., Bian, S., & Sawan, M. (2025) · Journal of Pharmaceutical Analysis · doi:10.1016/j.jpha.2025.101323 · Cited by 32
NOX4-mediated astrocyte ferroptosis in Alzheimer’s disease
Maimaiti, Y., Su, T., Zhang, Z., Ma, L., Zhang, Y. E., & Xu, H. (2024) · Cell & Bioscience · doi:10.1186/s13578-024-01266-w · Cited by 28
Huang, C., Rust, N. C., Wu, H., & Hart, G. W. (2022) · Neural Regeneration Research · doi:10.4103/1673-5374.354515 · Cited by 28
Recent Advances in Brain Organoid Technology for Human Brain Research
Jeong, E., Choi, S., & Cho, S. (2022) · ACS Applied Materials & Interfaces · doi:10.1021/acsami.2c17467 · Cited by 29
The Breakthroughs and Caveats of Using Human Pluripotent Stem Cells in Modeling Alzheimer’s Disease
Bendtsen, K. M., & Hall, V. J. (2023) · Cells · doi:10.3390/cells12030420 · Cited by 30
A survey to assess animal methods bias in scientific publishing
Krebs, C. E., Lam, A., McCarthy, J., Constantino, H., & Sullivan, K. (2023) · ALTEX · doi:10.14573/altex.2210212 · Cited by 31
Modeling Alzheimer’s disease using human cell derived brain organoids and 3D models
Fernandes, S., Revanna, J. S., Pratt, J. M., Hayes, N., Marchetto, M. C., & Gage, F. H. (2024) · Frontiers in Neuroscience · doi:10.3389/fnins.2024.1434945 · Cited by 33
Interfacing brain organoids with precision medicine and machine learning
Zheng, H., Feng, Y., Tang, J., & Ma, S. (2022) · Cell Reports Physical Science · doi:10.1016/j.xcrp.2022.100974 · Cited by 26
Patient-Derived Organoids: A Game-Changer in Personalized Cancer Medicine
Abbasian, M. H., Sobhani, N., Sisakht, M. M., D’Angelo, A., Sirico, M., & Roudi, R. (2024) · Stem Cell Reviews and Reports · doi:10.1007/s12015-024-10805-4 · Cited by 28
Central nervous system vascularization in human embryos and neural organoids
Boutom, S., Silva, T. P., Palecek, S. P., Shusta, E. V., Fernandes, T. G., & Ashton, R. S. (2024) · Cell Reports · doi:10.1016/j.celrep.2024.115068 · Cited by 26
Chen, X., Sun, G., Feng, L., Tian, E., & Shi, Y. (2025) · Communications Biology · doi:10.1038/s42003-024-07401-0 · Cited by 23
Self-citationZhang, W., Li, J., Zhou, J., Rastogi, A., & Ma, S. (2022) · Trends in biotechnology · doi:10.1016/j.tibtech.2022.03.003 · Cited by 23
BACE2: A Promising Neuroprotective Candidate for Alzheimer’s Disease
Yeap, Y. J., Kandiah, N., Nižetić, D., & Lim, K. (2022) · Journal of Alzheimer s Disease · doi:10.3233/jad-220867 · Cited by 25
Denkinger, M. N., Baker, S. L., Inglis, B. A., Kobayashi, S., Juarez, A., Mason, S., & Jagust, W. J. (2024) · PLoS ONE · doi:10.1371/journal.pone.0299764 · Cited by 22
Ma, C., Seong, H., Li, X., Yu, X., Xu, S., & Li, Y. (2022) · Stem Cells International · doi:10.1155/2022/2150680 · Cited by 25
Schreiner, T. G., Creangă-Murariu, I., Tamba, B.-I., Lucanu, N., & Popescu, B. O. (2022) · Biomolecules · doi:10.3390/biom12081136 · Cited by 23
Organoids – the future of pre-clinical development of AAV gene therapy for CNS disorders
Kaiser, V., & Gonzalez-Cordero, A. (2025) · Gene Therapy · doi:10.1038/s41434-025-00527-8 · Cited by 19
Mi, L., Yuan, J., Jiang, Y., Hu, Y., Lv, C., Xu, Y., Liu, M., Liu, T., Liu, X., Huang, J., et al. (2025) · Drug Delivery · doi:10.1080/10717544.2025.2486840 · Cited by 20
Dolciotti, C., Righi, M., Grecu, E., Trucas, M., Maxia, C., Murtas, D., & Diana, A. (2025) · Frontiers in Cellular Neuroscience · doi:10.3389/fncel.2025.1553642 · Cited by 19
Single-cell sequencing and organoids: applications in organ development and disease
Li, T., Yin, J., Hao, Y., Gao, W., Li, Q., Feng, Q., Tao, B., Hao, M., Liu, Y., Lin, C., et al. (2025) · Molecular Biomedicine · doi:10.1186/s43556-025-00364-6 · Cited by 20
Cortical spheroid on perfusable microvascular network in a microfluidic device
Russell, T. A., Dirar, Q., Li, Y., Chiang, C., Laskowitz, D. T., & Yun, Y. (2023) · PLoS ONE · doi:10.1371/journal.pone.0288025 · Cited by 18
Transcriptional regulation by PHGDH drives amyloid pathology in Alzheimer’s disease
Chen, J., Hadi, F., Wen, X., Zhao, W., Xu, M., Xue, S., Lin, P., Calandrelli, R., Richard, J. L. C., Song, Z., et al. (2025) · Cell · doi:10.1016/j.cell.2025.03.045 · Cited by 19
Self-citationFeng, L., Chao, J., Zhang, M., Pacquing, E., Hu, W., & Shi, Y. (2023) · iScience · doi:10.1016/j.isci.2023.108037 · Cited by 17
Self-citationTackling neurodegeneration in vitro with omics: a path towards new targets and drugs
Carraro, C., Montgomery, J. V., Klimmt, J., Paquet, D., Schultze, J. L., & Beyer, M. (2024) · Frontiers in Molecular Neuroscience · doi:10.3389/fnmol.2024.1414886 · Cited by 16
How endothelial cell metabolism shapes blood–brain barrier integrity in neurodegeneration
Wang, J., Chen, Y., Chen, S., Mu, Z., & Chen, J. (2025) · Frontiers in Molecular Neuroscience · doi:10.3389/fnmol.2025.1623321 · Cited by 19
Werner, J. M., & Gillis, J. (2024) · PLoS Biology · doi:10.1371/journal.pbio.3002912 · Cited by 21
Generation of human embryonic stem cell-derived lung organoids
Han, L. K., Zhao, S., Yu, F., Rong, Z., Lin, Y., & Chen, Y. (2022) · STAR Protocols · doi:10.1016/j.xpro.2022.101270 · Cited by 15
Experimental modelling of Alzheimer's disease for therapeutic screening
Blaikie, L., Kay, G., Maciel, P., & Lin, P. K. T. (2022) · European Journal of Medicinal Chemistry Reports · doi:10.1016/j.ejmcr.2022.100044 · Cited by 16
Zhang, X., Lin, H., Dong, L., & Xia, Q. (2022) · Theranostics · doi:10.7150/thno.75123 · Cited by 17
Efficient Gene Expression in Human Stem Cell Derived-Cortical Organoids Using Adeno Associated Virus
Cho, A., Bright, F., Morey, N., Au, C. G., Ittner, L. M., & Ke, Y. D. (2022) · Cells · doi:10.3390/cells11203194 · Cited by 17
Prominent and conspicuous astrocyte atrophy in human sporadic and familial Alzheimer’s disease
Rodríguez, J. J., Zallo, F., Gardenal, E., Cabot, J., & Busquets, X. (2023) · Brain Structure and Function · doi:10.1007/s00429-023-02707-x · Cited by 15
Hongen, T., Sakai, K., Ito, T., Qin, X., & Sone, H. (2024) · International Journal of Molecular Sciences · doi:10.3390/ijms252312523 · Cited by 15
Rubio, A. D., Hamilton, L. L., Bausch, M., Jin, M., Papetti, A. V., Jiang, P., & Yelamanchili, S. V. (2025) · Journal of Neuroimmune Pharmacology · doi:10.1007/s11481-025-10181-x · Cited by 17
Zhu, H., Yao, C., Xu, Z., Shang, G., Peng, J., Xie, H., Qian, T., Qiu, Z., Maeso, L., Mao, M., et al. (2025) · Acta Biomaterialia · doi:10.1016/j.actbio.2025.06.013 · Cited by 14
Huang, J., Zhu, Y., Tang, J., Liu, Y., Lu, M., Zhang, R., & Sun, A. X. (2025) · Biomolecules · doi:10.3390/biom15081118 · Cited by 14
Nakatsu, D., Kunishige, R., Taguchi, Y., Shinozaki‐Narikawa, N., Osaka, K., Yokomizo, K., Ishida, M., Takei, S., Yamasaki, S., Hagiya, K., et al. (2023) · Stem Cell Reports · doi:10.1016/j.stemcr.2023.01.004 · Cited by 15
Model Organoids: Integrated Frameworks for the Next Frontier of Healthcare Advancements
Bhattacharya, R., Bose, D., Kaur, T., Patel, R., Renuka, O., & Rodriguez, R. V. (2024) · Stem Cell Reviews and Reports · doi:10.1007/s12015-024-10814-3 · Cited by 15
hPSCs-derived brain organoids for disease modeling, toxicity testing and drug evaluation
Xie, N., Bai, J., Hou, Y., Liu, J., Zhang, Y., Meng, X., & Wang, X. (2024) · Experimental Neurology · doi:10.1016/j.expneurol.2024.115110 · Cited by 15
Cerneckis, J., & Shi, Y. (2023) · Frontiers in Cellular Neuroscience · doi:10.3389/fncel.2023.1198715 · Cited by 14
Self-citationResearch models to study lewy body dementia
Boschen, S. L., Mukerjee, A. A., Faroqi, A. H., Rabichow, B. E., & Fryer, J. D. (2025) · Molecular Neurodegeneration · doi:10.1186/s13024-025-00837-w · Cited by 16
Milford, S. R., Shaw, D., & Starke, G. (2023) · Science and Engineering Ethics · doi:10.1007/s11948-023-00457-x · Cited by 13
Ke, J., Yu, C., Li, S., Hong, Y., Xu, Y., Wang, K., Meng, T., Yuan, P., Fu, Q., Yuan, H., et al. (2023) · Advanced Healthcare Materials · doi:10.1002/adhm.202302939 · Cited by 16
Parrotta, E. I., Lucchino, V., Zannino, C., Valente, D., Scalise, S., Bressan, D., Benedetto, G. L., Iazzetta, M. R., Talarico, M., Gagliardi, M., et al. (2025) · Annals of Neurology · doi:10.1002/ana.27172 · Cited by 14
Application of colloidal photonic crystals in study of organoids
Huang, K., Li, Q., Xue, Y., Wang, Q., Chen, Z., & Gu, Z. (2023) · Advanced Drug Delivery Reviews · doi:10.1016/j.addr.2023.115075 · Cited by 13
Advanced brain organoids for neuroinflammation disease modeling
Sabaté-Soler, S., Kurniawan, H., & Schwamborn, J. (2023) · Neural Regeneration Research · doi:10.4103/1673-5374.375321 · Cited by 10
Advances in Organoid Technology: A Focus on Corneal Limbal Organoids
Lu, C., & Le, Q. (2024) · Stem Cell Reviews and Reports · doi:10.1007/s12015-024-10706-6 · Cited by 12
Human brain organoids for understanding substance use disorders
Li, K., Gu, L., Cai, H., Lu, H., Mackie, K., & Guo, F. (2024) · Drug Metabolism and Pharmacokinetics · doi:10.1016/j.dmpk.2024.101036 · Cited by 14
hPSC-derived lung organoids: Potential opportunities and challenges
Du, X., Dong, Y., Li, W., & Chen, Y. (2023) · Heliyon · doi:10.1016/j.heliyon.2023.e13498 · Cited by 11
Urine-derived cells from the aged donor for the 2D/3D modeling of neural cells via iPSCs
Supakul, S., Hatakeyama, Y., Leventoux, N., Itsuno, M., Numata, N., Hiramine, H., Morimoto, S., Iwata, A., Maeda, S., & Okano, H. (2023) · Aging Brain · doi:10.1016/j.nbas.2023.100101 · Cited by 11
Stokar‐Regenscheit, N., Bell, L., Berridge, B. R., Rudmann, D. G., Tagle, D. A., Hargrove-Grimes, P., Schaudien, D., Hahn, K., Kuehnlenz, J., Ashton, R. S., et al. (2024) · Toxicologic Pathology · doi:10.1177/01926233241253811 · Cited by 11
Advances in construction and modeling of functional neural circuits in vitro
Chow, S. Y. A., Hu, H., Osaki, T., Levi, T., & Ikeuchi, Y. (2022) · Neurochemical Research · doi:10.1007/s11064-022-03682-1 · Cited by 12
Induced Pluripotent Stem Cell-Derived Organoids: Their Implication in COVID-19 Modeling
Csöbönyeiová, M., Klein, M., Kuniaková, M., Varga, I., & Danišovič, Ľ. (2023) · International Journal of Molecular Sciences · doi:10.3390/ijms24043459 · Cited by 10
Blood‐based biomarkers of Alzheimer's disease: Standardization and comprehensiveness
Liu, Y., Guo, Y., & Yu, J. (2024) · Neuroprotection/Neuroprotection (Chichester, England. Print) · doi:10.1002/nep3.58 · Cited by 10
Thymosin beta 4 as an Alzheimer disease intervention target identified using human brain organoids
Zeng, P.-M., Sun, X.-Y., Li, Y., Wu, W.-D., Huang, J., Cao, D.-D., Qian, P.-J., Ju, X.-C., & Luo, Z. (2025) · Stem Cell Reports · doi:10.1016/j.stemcr.2025.102601 · Cited by 14
Organoids in the Clinic: A Systematic Review of Outcomes
Hofmann, B., Zinöcker, S., Holm, S., Lewis, J., & Kavouras, P. (2022) · Cells Tissues Organs · doi:10.1159/000527237 · Cited by 11
Tian, C., Ao, Z., Cerneckis, J., Cai, H., Chen, L., Niu, H., Takayama, K., Kim, J., Shi, Y., Gu, M., et al. (2025) · Science Advances · doi:10.1126/sciadv.adu2708 · Cited by 9
Self-citationLemieux, M. R., Freigassner, B., Hanson, J. L., Thathey, Z., Opp, M. R., Hoeffer, C. A., & Link, C. D. (2024) · PLoS ONE · doi:10.1371/journal.pone.0303901 · Cited by 9
O’Hare, N. R., Millican, K., & Ebong, E. E. (2024) · Frontiers in Physiology · doi:10.3389/fphys.2024.1394725 · Cited by 10
de Camps, C. C., Rostami, S., Xu, V., Li, C., Lépine, P., Durcan, T. M., & Moraes, C. (2024) · Biotechnology Journal · doi:10.1002/biot.202400070 · Cited by 14
Human brain organoids: an innovative model for neurological disorder research and therapy
Li, H., Zhu, J., Li, J., Wu, Y., Luo, C., Huang, Y., Wu, J., Liu, W., Wang, H., & Mo, Z. (2025) · Frontiers in Cellular Neuroscience · doi:10.3389/fncel.2025.1658074 · Cited by 11
Immunosenescence and organoids: pathophysiology and therapeutic opportunities
Kamroo, A., Kakroudi, M. H., Sarmadian, A. J., Firouzabadi, A., Mousavi, S., Yazdanpanah, N., Saleki, K., & Rezaei, N. (2025) · Immunity & Ageing · doi:10.1186/s12979-025-00530-y · Cited by 12
Myelin organoids for the study of Alzheimer's disease
Cerneckis, J., & Shi, Y. (2023) · Frontiers in Neuroscience · doi:10.3389/fnins.2023.1283742 · Cited by 9
Self-citationTranscriptomic Profiling of Tetrodotoxin-Induced Neurotoxicity in Human Cerebral Organoids
Liu, Z., Wang, Z., Wei, Y., Shi, J., Shi, T., Chen, X., & Li, L. (2023) · Marine Drugs · doi:10.3390/md21110588 · Cited by 9
Self-citationGABAergic signaling abnormalities in a novel CLU mutation Alzheimer's disease mouse model
Chen, C., Tang, X., Lan, Z., Wan, C., Su, H., Li, W., Li, Y., Zhou, X. W., Gao, H., Feng, X., et al. (2023) · Translational research · doi:10.1016/j.trsl.2023.05.003 · Cited by 8
A narrative review of organoids for investigating organ aging: opportunities and challenges
Sun, X., Sun, F., Zhang, Y., Qu, J. T., Zhang, W., & Liu, G. (2023) · Journal of Bio-X Research · doi:10.1097/jbr.0000000000000139 · Cited by 8
Griñán‐Ferré, C., Servín-Muñoz, I. V., Palomera‐Ávalos, V., Martínez-Fernández, C., Companys‐Alemany, J., Muñoz-Villanova, A., Ortuño‐Sahagún, D., Pallàs, M., & Bellver‐Sanchís, A. (2024) · Genes · doi:10.3390/genes15111411 · Cited by 8
Strategic use of organoids and organs-on-chip as biomimetic tools
Santos, A. K., Scalzo, S., Souza, R. T. V., Santana, P. H. G., Marques, B. L., de Oliveira, L. F., Filho, D. M., Kihara, A. H., Santiago, H. C., Parreira, R. C., et al. (2022) · Seminars in Cell and Developmental Biology · doi:10.1016/j.semcdb.2022.09.010 · Cited by 9
Cryopreserving 3D cell culture models of Alzheimer’s disease in hydrogel microbeads
Kim, J. J., Hebisch, M., Kwak, S. S., Zheng, M., Nuli, S. S., Bae, J., Brand, E., Tanzi, R. E., Irimia, D., & Kim, D. Y. (2025) · Scientific Reports · doi:10.1038/s41598-025-94810-8 · Cited by 8
Metadata
- Authors
- Chen, X., Sun, G., Tian, E., Zhang, M., Davtyan, H., Beach, T. G., Reiman, E. M., Blurton‐Jones, M., Holtzman, D. M., & Shi, Y.
- Affiliations
- City Of Hope National Medical Center (US)
- University of California, Irvine (US)
- Banner Sun Health Research Institute (US)
- Banner Alzheimer’s Institute (US)
- Department of Neurobiology & Behavior Institute for Memory Impairments & Neurological Disorders and Sue & Bill Gross Stem Cell Research Center University of California Irvine Irvine CA 92697 USA
- Washington University in St. Louis (US)
- Corresponding author
- Shi, Yanhong
- ORCID
- Venue
- Advanced Science
- Publisher
- Wiley
- Published
- 2021-08-02
- Volume
- 8
- Issue
- 18
- Pages
- e2101462-e2101462
- ISSN
- 2198-3844 (ISSN-L)
- PMC
- PMC8456220
- OpenAlex
- W3190034604
- Cited by
- 200
- References
- 71
- Citations by year
- 2026: 32 · 2025: 49 · 2024: 48 · 2023: 44 · 2022: 24 · 2021: 3
- FWCI
- 18.85
- Type
- journal article
- Language
- en
- Open access
- gold
- doi.org
- Licence
- Locations
- Advanced Science (publishedVersion, cc-by)
- Europe PMC (PubMed Central) (publishedVersion, other-oa)
- PubMed Central (publishedVersion, cc-by)
- PubMed (publishedVersion)
- DOAJ (DOAJ: Directory of Open Access Journals) (submittedVersion, cc-by-sa)
- eScholarship (California Digital Library) (submittedVersion, cc-by)
- Funders
- National Institute on Aging (R01AG056305, P30AG019610, RF1AG061794, R56AG061171, P30AG066519, R01AG056303)
- National Institute on Drug Abuse (RF1DA048813)
- National Cancer Institute (P30CA033572)
- National Institute of Neurological Disorders and Stroke (U24NS072026)
- Louise and Herb Horvitz Charitable Foundation
- Topics
- Life Sciences › Neuroscience › Cellular and Molecular Neuroscience › Alzheimer's disease research and treatments
- Life Sciences › Biochemistry, Genetics and Molecular Biology › Molecular Biology › Pluripotent Stem Cells Research
- Life Sciences › Neuroscience › Neurology › Neuroinflammation and Neurodegeneration Mechanisms
- Keywords
- sporadic Alzheimer's disease, brain organoids, human induced pluripotent stem cells, serum exposure, blood-brain barrier disruption, amyloid-beta, tau phosphorylation, beta-secretase 1, glycogen synthase kinase-3, synaptic loss, disease modeling, single-cell transcriptomics
- MeSH terms
- Alzheimer Disease, Brain, Humans, Organoids, Induced Pluripotent Stem Cells
About these checks
Registry, retraction, Cites and statistics results are computed, not judged, with one exception: a printed reference that no index lists is read once by a model before it counts as a citation error. Claims are extracted by a model and kept only when their quote appears verbatim in the text; each cited source is then checked, with a model’s help, for whether it says what the claim relies on. Those verdicts can be wrong — read the claim’s quote and the cited source before relying on one.
Statistics and arithmetic are recomputed, not judged.
Confidence bands are shown only for fields calibrated on our annotated test set. None is calibrated yet, so no band is shown.
What counts as a claim ›How we measure confidence ›How we check this ›
Are you an author, or do you see a problem with this page? Request a review
