Student or educator? Sign up with your school email and get 6 months of Pro free.
CoChat

The DOI matches its Crossref record; 73 of the 73 references it cites were found in a registry or an index.

High Entropy van der Waals Materials

Open access
Ying, Tianping, Yu, Tongxu, Qi, Yanpeng, Chen, Xiaolong, Hosono, Hideo · 2022 · Advanced Science

Abstract

By breaking the restrictions on traditional alloying strategy, the high entropy concept has promoted the exploration of the central area of phase space, thus broadening the horizon of alloy exploitation. This review highlights the marriage of the high entropy concept and van der Waals systems to form a new family of materials category, namely the high entropy van der Waals materials (HEX, HE = high entropy, X = anion clusters) and describes the current issues and next challenges. The design strategy for HEX has integrated the local feature (e.g., composition, spin, and valence states) of structural units in high entropy materials and the holistic degrees of freedom (e.g., stacking, twisting, and intercalating species) in van der Waals materials, and is successfully used for the discovery of high entropy dichalcogenides, phosphorus tri‐chalcogenides, halogens, and MXene. The rich combination and random distribution of the multiple metallic constituents on the nearly regular 2D lattice give rise to a flexible platform to study the correlation features behind a range of selected physical properties, e.g., superconductivity, magnetism, and metal–insulator transition. The deliberate design of structural units and their stacking configuration can also create novel catalysts to enhance their performance in a bunch of chemical reactions.

Overview

The claims and statistics of this paper haven’t been checked yet.

Free: it reads the open-access text and checks the first 5 claims that cite a source we can check. Create a free account to check every claim.

A few free checks a day · papers already verified open instantly · results are public

Integrity signals

Registry

Crossref · 10.1002/advs.202203219

Cites

73 of 73 references verified0 citation errors · 0 not checkable

Statistics

Figures

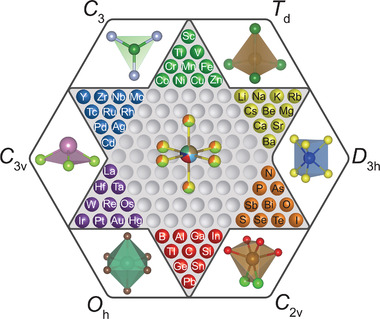
Figure 1 The “Chinese checkers” design strategy of high‐entropy vdW materials. The color balls placed at each corner of the hexagram represent the optional multi‐elements that can be used to construct the structural units. Several typical structural units are exhibited in the voids of the hexagon circumscribing the hexagram. Their corresponding point symmetry groups are marked at the corner of the hexagon. Inside the checkerboard, a HES6 octahedron is sketched for illustration.
Figure 1 The “Chinese checkers” design strategy of high‐entropy vdW materials. The color balls placed at each corner of the hexagram represent the optional multi‐elements that can be used to construct the structural units. Several typical structural units are exhibited in the voids of the hexagon circumscribing the hexagram. Their corresponding point symmetry groups are marked at the corner of the hexagon. Inside the checkerboard, a HES6 octahedron is sketched for illustration.CC BY · PubMed Central
Figure 2 Crystal growth and element distribution of HEX materials.[ 17 , 19 ] a) Schematic diagram of the chemical vapor transport method suitable for the growth of HES2, HESe2, HECl2, HEBr2, HEI2, and HEPS3. b) Optical images of single crystals of (TiVCrNbTa)Se2 and (MnFeCoNi)PS3 with subcentimeter sizes. c) Quantitative element mapping of (TiVCrNbTa)Se2 by EPMA. d) Atomic‐resolution scanning transmission electron microscopy high‐angle annular dark‐field (STEM‐HAADF) image of a flake of (MoWVNbTa)S2, where the highlighted region (red box) shows the [001] projection. e) STEM‐HAADF image showing local variations in the intensity of atomic columns due to varying composition of cations. f) The intensity profile of the green box region is illustrated in (e), where the legends correspond to the predominant elements in each atomic column. b,c) Adapted with permission.[17] Copyright 2021, American Chemical Society. d,f) Wiley‐VCH GmbH.
Figure 2 Crystal growth and element distribution of HEX materials.[ 17 , 19 ] a) Schematic diagram of the chemical vapor transport method suitable for the growth of HES2, HESe2, HECl2, HEBr2, HEI2, and HEPS3. b) Optical images of single crystals of (TiVCrNbTa)Se2 and (MnFeCoNi)PS3 with subcentimeter sizes. c) Quantitative element mapping of (TiVCrNbTa)Se2 by EPMA. d) Atomic‐resolution scanning transmission electron microscopy high‐angle annular dark‐field (STEM‐HAADF) image of a flake of (MoWVNbTa)S2, where the highlighted region (red box) shows the [001] projection. e) STEM‐HAADF image showing local variations in the intensity of atomic columns due to varying composition of cations. f) The intensity profile of the green box region is illustrated in (e), where the legends correspond to the predominant elements in each atomic column. b,c) Adapted with permission.[17] Copyright 2021, American Chemical Society. d,f) Wiley‐VCH GmbH.CC BY · PubMed Central
Figure 3 The exfoliation of several typical HEX single crystals. a) Optical image of the exfoliated (MnFeCoNi)PS3 on a SiO2/Si wafer. b) Atomic force microscope (AFM) topographic image of the squared area shown in (a). The cross‐sectional profile along the black line is superimposed. c) Optical image of as‐cleaved monolayer and few layers (TiVCrNbTa)S2 by using Al2O3‐assisted exfoliation method. Layer numbers have been indicated. d) A typical device fabricated on monolayer (TiVCrNbTa)S2. Adapted with permission.[17] Copyright 2021, American Chemical Society.
Figure 3 The exfoliation of several typical HEX single crystals. a) Optical image of the exfoliated (MnFeCoNi)PS3 on a SiO2/Si wafer. b) Atomic force microscope (AFM) topographic image of the squared area shown in (a). The cross‐sectional profile along the black line is superimposed. c) Optical image of as‐cleaved monolayer and few layers (TiVCrNbTa)S2 by using Al2O3‐assisted exfoliation method. Layer numbers have been indicated. d) A typical device fabricated on monolayer (TiVCrNbTa)S2. Adapted with permission.[17] Copyright 2021, American Chemical Society.CC BY · PubMed Central
Figure 4 The intercalation of HEX. a) X‐ray diffraction patterns of polycrystalline (black), single‐crystalline (orange), and potassium‐intercalated (blue) (TiVCrNbTa)S2. b–d) XPS peaks of S 2p, Ta 4f, and V 2p states for raw, monovalent (K), and divalent (Ba) intercalated (TiVCrNbTa)S2. A continuous redshift by increasing the doping content can be seen in S 2p and Ta 4f. However, the distinction between the monovalent and divalent doping effect cannot be distinguished in V 2p (as well as in the rest transition metals), indicating the uneven and element‐selective charge distribution within the high‐entropy system. Adapted with permission.[17] Copyright 2021, American Chemical Society.
Figure 4 The intercalation of HEX. a) X‐ray diffraction patterns of polycrystalline (black), single‐crystalline (orange), and potassium‐intercalated (blue) (TiVCrNbTa)S2. b–d) XPS peaks of S 2p, Ta 4f, and V 2p states for raw, monovalent (K), and divalent (Ba) intercalated (TiVCrNbTa)S2. A continuous redshift by increasing the doping content can be seen in S 2p and Ta 4f. However, the distinction between the monovalent and divalent doping effect cannot be distinguished in V 2p (as well as in the rest transition metals), indicating the uneven and element‐selective charge distribution within the high‐entropy system. Adapted with permission.[17] Copyright 2021, American Chemical Society.CC BY · PubMed Central
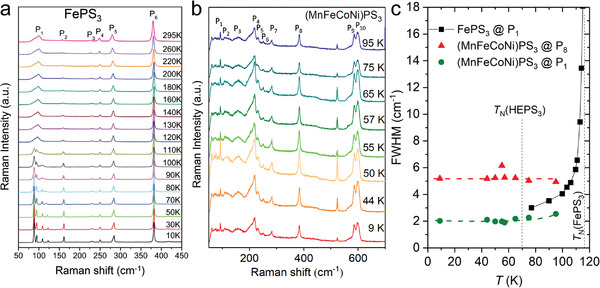
Figure 5 Structure information from Raman spectroscopy. a) Temperature dependence of Raman spectra of bulk FePS3. Reproduced with permission.[ 32 ] Copyright 2016, American Chemical Society. b) Temperature dependence of Raman spectra of (MnFeCoNi)PS3 with an antiferromagnetic transition at 70 K. c) Plots of full width at half maximum (FWHM) of Raman peak of P1 (88 cm−1, 92.7 cm−1) and P8 (383 cm−1) versus temperature in FePS3 and HEPS3. The broken lines indicate the Neel transition temperatures for FePS3 and HEPS3 at 118 and 70 K, respectively.
Figure 5 Structure information from Raman spectroscopy. a) Temperature dependence of Raman spectra of bulk FePS3. Reproduced with permission.[ 32 ] Copyright 2016, American Chemical Society. b) Temperature dependence of Raman spectra of (MnFeCoNi)PS3 with an antiferromagnetic transition at 70 K. c) Plots of full width at half maximum (FWHM) of Raman peak of P1 (88 cm−1, 92.7 cm−1) and P8 (383 cm−1) versus temperature in FePS3 and HEPS3. The broken lines indicate the Neel transition temperatures for FePS3 and HEPS3 at 118 and 70 K, respectively.CC BY · PubMed Central
Figure 6 Corrosion resistance of HE‐dichalcogenides. a–c) Corrosion resistance measurements of (TiVCrNbTa)Se2 and its individual components against acid (HNO3), base (NaOH), and organic (butylamine mixed in tetrahydrofuran) reagents. Adapted with permission.[17] Copyright 2021, American Chemical Society.
Figure 6 Corrosion resistance of HE‐dichalcogenides. a–c) Corrosion resistance measurements of (TiVCrNbTa)Se2 and its individual components against acid (HNO3), base (NaOH), and organic (butylamine mixed in tetrahydrofuran) reagents. Adapted with permission.[17] Copyright 2021, American Chemical Society.CC BY · PubMed Central
Figure 7 The dependence of phase behavior on the characteristic elemental and structural features in different HEX systems. a) Conventional Hume–Rothery rule using electronegativity mismatch (Δχ) versus atomic size mismatch (δ) plot. The single phase and the phase‐separated ones intermingled and the size mismatch failed to be used as a valid criterion. b) Replot of the phase diagram using the mismatch of the M‐X bond (β) as the abscissa with its definition specified in the text. In practice, these bond lengths are extracted from the ICSD database, and their average value can be automatically calculated using a crystalline 3D visualization program such as VESTA.[ 41 ] c) The exception of the HEPS3 system, lying outside of other HE‐systems. Filled and open notations denote single and multiphase formation, respectively.
Figure 7 The dependence of phase behavior on the characteristic elemental and structural features in different HEX systems. a) Conventional Hume–Rothery rule using electronegativity mismatch (Δχ) versus atomic size mismatch (δ) plot. The single phase and the phase‐separated ones intermingled and the size mismatch failed to be used as a valid criterion. b) Replot of the phase diagram using the mismatch of the M‐X bond (β) as the abscissa with its definition specified in the text. In practice, these bond lengths are extracted from the ICSD database, and their average value can be automatically calculated using a crystalline 3D visualization program such as VESTA.[ 41 ] c) The exception of the HEPS3 system, lying outside of other HE‐systems. Filled and open notations denote single and multiphase formation, respectively.CC BY · PubMed Central
Figure 8 Electrical transport properties of HE‐dichalcogenides. a) Composition‐controlled metal‐insulator transition of (TiVCrNbTa)S2 with the variation of its entropy content. b) 2D variable‐range hopping of the resistivity in the (TiVCrNbTa)S2 system. The change of the linear dependence of ln ρ versus T from T −1/3 to T −1/2 indicates the opening of a Coulomb gap (Efros–Shkovskii gap) at low temperature. c) Thickness‐dependent resistivity of (TiVCrNbTa)S2 from 12 to 300 K. An interesting observation is the anomalous increasing conductivity with decreasing the sample thickness, contrasting to the behavior of the majority of 2D materials. d) Superconductivity in (CoAu)0.2(RhIrPdPt)0.8Te2. The transition temperatures can be gradually suppressed by increasing external magnetic fields. Adapted with permission.[ 17 ] Copyright 2021, American Chemical Society.
Figure 8 Electrical transport properties of HE‐dichalcogenides. a) Composition‐controlled metal‐insulator transition of (TiVCrNbTa)S2 with the variation of its entropy content. b) 2D variable‐range hopping of the resistivity in the (TiVCrNbTa)S2 system. The change of the linear dependence of ln ρ versus T from T −1/3 to T −1/2 indicates the opening of a Coulomb gap (Efros–Shkovskii gap) at low temperature. c) Thickness‐dependent resistivity of (TiVCrNbTa)S2 from 12 to 300 K. An interesting observation is the anomalous increasing conductivity with decreasing the sample thickness, contrasting to the behavior of the majority of 2D materials. d) Superconductivity in (CoAu)0.2(RhIrPdPt)0.8Te2. The transition temperatures can be gradually suppressed by increasing external magnetic fields. Adapted with permission.[ 17 ] Copyright 2021, American Chemical Society.CC BY · PubMed Central
Figure 9 a,b) Illustration of the concept of isolated atoms in the catalysis by controlling the concentration of expensive or toxic elements to fit the molecular geometry of the desired reaction. c) The current density of (MoWVNbTa)S2 and Ag nanoparticles plotted against voltage versus RHE using linear sweep voltammetry test mode. (c) Adapted with permission.[ 19 ] Copyright 2021, Wiley‐VCH GmbH.
Figure 9 a,b) Illustration of the concept of isolated atoms in the catalysis by controlling the concentration of expensive or toxic elements to fit the molecular geometry of the desired reaction. c) The current density of (MoWVNbTa)S2 and Ag nanoparticles plotted against voltage versus RHE using linear sweep voltammetry test mode. (c) Adapted with permission.[ 19 ] Copyright 2021, Wiley‐VCH GmbH.CC BY · PubMed Central
Figure 10 Electrochemical characterizations of Co x (VMnNiZn)1− x PS3 for HER. a) Linear sweep voltammetry curves with the variation of entropy. b) HER free‐energy diagram of corresponding edge sites, inset illustrates the adsorption of H on the edge S site (yellow balls). Negative ΔG (HE‐S and S) indicates that the adsorption of hydrogen on S is more favored than the desorption process, and vice versa. c) Basal‐plane models of P sites (P1–P3) and S sites (S1–S9) in Co0.6(VMnNiZn)0.4PS3, where the surface P shows the lowest HER free energy. d) Calculated reaction energy of water dissociation for Co0.6(VMnNiZn)0.4PS3 and CoPS3, including Co, V, Mn, Ni, and Zn sites. Adapted with permission.[ 23 ] Copyright 2021, American Chemical Society.
Figure 10 Electrochemical characterizations of Co x (VMnNiZn)1− x PS3 for HER. a) Linear sweep voltammetry curves with the variation of entropy. b) HER free‐energy diagram of corresponding edge sites, inset illustrates the adsorption of H on the edge S site (yellow balls). Negative ΔG (HE‐S and S) indicates that the adsorption of hydrogen on S is more favored than the desorption process, and vice versa. c) Basal‐plane models of P sites (P1–P3) and S sites (S1–S9) in Co0.6(VMnNiZn)0.4PS3, where the surface P shows the lowest HER free energy. d) Calculated reaction energy of water dissociation for Co0.6(VMnNiZn)0.4PS3 and CoPS3, including Co, V, Mn, Ni, and Zn sites. Adapted with permission.[ 23 ] Copyright 2021, American Chemical Society.CC BY · PubMed Central
Figure 11 Long‐range magnetic ordering in a highly disordered system. a) Magnetic configurations of individual MPS3 (M = Mn, Fe, Co, Ni). The crystal structure of HEPS3 is identical to MPS3 with the transition metal sites occupied by multiple elements. b) Magnetization of (MnFeCoNi)PS3 with the external magnetic field H = 500 Oe perpendicular to or within the ab‐plane. The antiferromagnetic transition (TN) and spin glass transition temperature (T g) are marked. c,d) Two alternative models of magnetic ordering in the stoichiometric (MnFeCoNi)PS3. e) Heat capacity of (MnFeCoNi)PS3 from 2 to 280 K. The magnetic contribution (red) is extracted by subtracting the lattice‐specific heat (black) by fitting the Debye formula above 160 K. b,e) Adapted with permission.[17] Copyright 2021, American Chemical Society.
Figure 11 Long‐range magnetic ordering in a highly disordered system. a) Magnetic configurations of individual MPS3 (M = Mn, Fe, Co, Ni). The crystal structure of HEPS3 is identical to MPS3 with the transition metal sites occupied by multiple elements. b) Magnetization of (MnFeCoNi)PS3 with the external magnetic field H = 500 Oe perpendicular to or within the ab‐plane. The antiferromagnetic transition (TN) and spin glass transition temperature (T g) are marked. c,d) Two alternative models of magnetic ordering in the stoichiometric (MnFeCoNi)PS3. e) Heat capacity of (MnFeCoNi)PS3 from 2 to 280 K. The magnetic contribution (red) is extracted by subtracting the lattice‐specific heat (black) by fitting the Debye formula above 160 K. b,e) Adapted with permission.[17] Copyright 2021, American Chemical Society.CC BY · PubMed Central
Figure 12 High entropy induced electron donation and superconductivity in the HEPSe3 system.[ 18 ] a) XPS of P 2p in (MnFeCdIn)PSe3 compared with that of FePSe3. b) Metal–superconductor transition of (MnFeCdIn)PSe3 with the external pressure. c) P—P distance (circles) and Neel temperature (squares) in MPSe3 as a function of entropy. Insets illustrate the breaking of the P—P dimer into two Ps with lone‐pair electrons caused by the entropy‐driven electron donation. d) Semiconductor–metal transition and the emergence of superconductivity with the applied external pressure for (MnFeCdIn)PSe3 phase. R 300K: resistivity at 300 K. The lone‐electron pair acts as a charge reservoir that releases electrons under high pressure and is responsible for the out‐of‐plane collapse.
Figure 12 High entropy induced electron donation and superconductivity in the HEPSe3 system.[ 18 ] a) XPS of P 2p in (MnFeCdIn)PSe3 compared with that of FePSe3. b) Metal–superconductor transition of (MnFeCdIn)PSe3 with the external pressure. c) P—P distance (circles) and Neel temperature (squares) in MPSe3 as a function of entropy. Insets illustrate the breaking of the P—P dimer into two Ps with lone‐pair electrons caused by the entropy‐driven electron donation. d) Semiconductor–metal transition and the emergence of superconductivity with the applied external pressure for (MnFeCdIn)PSe3 phase. R 300K: resistivity at 300 K. The lone‐electron pair acts as a charge reservoir that releases electrons under high pressure and is responsible for the out‐of‐plane collapse.CC BY · PubMed Central
Figure 13 Out‐of‐plane collapse in pressurized HEPSe3. a,b) Color contour of the (113) and (300) diffraction peaks for Fe0.8Mn0.1Cd0.05In0.05PSe3 and (FeMnCd)0.25In0.17PSe3 under external physical pressure. c–e) Pressure‐dependent lattice parameters and volume of the unit cell for both samples. The pressure‐dependent V of both samples by using the third‐order Birch–Murnaghan equation of state. Reproduced with permission.[ 18 ] Copyright 2022, The Authors.
Figure 13 Out‐of‐plane collapse in pressurized HEPSe3. a,b) Color contour of the (113) and (300) diffraction peaks for Fe0.8Mn0.1Cd0.05In0.05PSe3 and (FeMnCd)0.25In0.17PSe3 under external physical pressure. c–e) Pressure‐dependent lattice parameters and volume of the unit cell for both samples. The pressure‐dependent V of both samples by using the third‐order Birch–Murnaghan equation of state. Reproduced with permission.[ 18 ] Copyright 2022, The Authors.CC BY · PubMed Central
Figure 14 Characterization of high‐entropy MXene morphology and structure. a) A schematic illustration of the soft‐chemical etching method for obtaining HE‐MXene from HE‐MAX. b) SEM micrographs of HE‐MAX, HE‐MXenes, and a single flake image of TiVNbMoC3Tx on an alumina substrate. c) Schematic illustration of the nucleation and growth behavior of lithium guided by strains on HE‐MXene atomic layers. a,c) Reproduced with permission.[ 20 ] Copyright 2021, Wiley‐VCH GmbH. b) Reproduced with permission.[ 21 ] Copyright 2021, American Chemical Society.
Figure 14 Characterization of high‐entropy MXene morphology and structure. a) A schematic illustration of the soft‐chemical etching method for obtaining HE‐MXene from HE‐MAX. b) SEM micrographs of HE‐MAX, HE‐MXenes, and a single flake image of TiVNbMoC3Tx on an alumina substrate. c) Schematic illustration of the nucleation and growth behavior of lithium guided by strains on HE‐MXene atomic layers. a,c) Reproduced with permission.[ 20 ] Copyright 2021, Wiley‐VCH GmbH. b) Reproduced with permission.[ 21 ] Copyright 2021, American Chemical Society.CC BY · PubMed Central
Figure 15 The full set of degrees of freedom in high entropy vdW materials. These freedoms can be used separately or combined to realize bountiful physical properties or chemical performance. Adapted with permission.[ 17 ] Copyright 2021, American Chemical Society.
Figure 15 The full set of degrees of freedom in high entropy vdW materials. These freedoms can be used separately or combined to realize bountiful physical properties or chemical performance. Adapted with permission.[ 17 ] Copyright 2021, American Chemical Society.CC BY · PubMed Central

Verification

Claims the paper makes

The claims and statistics of this paper haven’t been checked yet.

Free: it reads the open-access text and checks the first 5 claims that cite a source we can check. Create a free account to check every claim.

A few free checks a day · papers already verified open instantly · results are public

Claims other papers make about this one

Each is checked against this paper’s own text: does it say what the citing paper says it does?

Self-check

Percentages, sums and reported differences re-computed from the paper’s own numbers.

The self-check needs the paper’s full text.

Citations

Cites

Show all 72 references

Research works printed but not linked: 3

  1. X.Chen J. J.Wang T. P.Ying D. J.Huang H. Y.Gou Q. H.Zhang Y. C.Li H.Hosono J.‐G.Guo X. L.Chen arXiv: 2207.08589. · arXiv
  2. Troparevsky M. C., 2015, Phys. Rev. X, 5, 011041
  3. Hume‐Rothery W., 1936, The Structure of Metals and Alloys

Cited by

See all 55

Metadata

Authors
Ying, T., Yu, T., Qi, Y., Chen, X., & Hosono, H.
Affiliations
  • Tokyo Institute of Technology (JP)
  • Gusu Laboratory of Materials Jiangsu 215123 China
  • ShanghaiTech University (CN)
  • Chinese Academy of Sciences (CN)
Corresponding author
  • Chen, Xiaolong
  • Hosono, Hideo
Venue
Advanced Science
Publisher
Wiley
Published
2022-08-25
Volume
9
Issue
30
Pages
e2203219-e2203219
ISSN
2198-3844 (ISSN-L)
OpenAlex
W3132287826
Cited by
51
References
72
Citations by year
2026: 10 · 2025: 19 · 2024: 15 · 2023: 6 · 2022: 1
FWCI
0.75
Type
journal article
Language
en
Open access
Locations
  • Advanced Science (publishedVersion, cc-by)
  • PubMed Central (publishedVersion, cc-by)
  • PubMed (publishedVersion)
  • arXiv (Cornell University) (submittedVersion)
  • DOAJ (DOAJ: Directory of Open Access Journals) (submittedVersion, cc-by-sa)
  • arXiv (Cornell University)
Funders
National Key Research and Development Program of China (2021YFA1401800)
Topics
  • Physical Sciences › Engineering › Mechanical Engineering › High Entropy Alloys Studies
  • Physical Sciences › Materials Science › Materials Chemistry › 2D Materials and Applications
  • Physical Sciences › Materials Science › Materials Chemistry › Machine Learning in Materials Science
Keywords
high-entropy materials, van der Waals materials, cluster anions, MXene, stacking configurations, torsion, intercalation, superconductivity, magnetism, metal-insulator transition, catalysts, alloy design

About these checks

Registry, retraction, Cites and statistics results are computed, not judged, with one exception: a printed reference that no index lists is read once by a model before it counts as a citation error. Claims are extracted by a model and kept only when their quote appears verbatim in the text; each cited source is then checked, with a model’s help, for whether it says what the claim relies on. Those verdicts can be wrong — read the claim’s quote and the cited source before relying on one.

Statistics and arithmetic are recomputed, not judged.

Confidence bands are shown only for fields calibrated on our annotated test set. None is calibrated yet, so no band is shown.

What counts as a claim ›How we measure confidence ›How we check this ›

Are you an author, or do you see a problem with this page? Request a review

How to cite

Cite CoChat for the checks on this page, and the paper for its own findings.

This page
CoChat. (2026). Citation check: High Entropy van der Waals Materials. https://app.cochat.ai/papers/10.1002/advs.202203219
The paper
Ying, T., Yu, T., Qi, Y., Chen, X., & Hosono, H. (2022). High Entropy van der Waals Materials. Advanced Science. https://doi.org/10.1002/advs.202203219

Data sources

Bibliographic data: Semantic Scholar, OpenAlex, Crossref.

Contains information from the Semantic Scholar Academic Graph Datasets, made available under the ODC Attribution License (ODC-BY 1.0).

Semantic Scholar’s data is described in: Kinney, R., et al. (2023). The Semantic Scholar Open Data Platform. arXiv:2301.10140.