

The DOI matches its Crossref record; 139 of the 140 references it cites were found in a registry or an index; 5 of the 50 sources its claims cite were checked for support.
Hyaluronic a cid–doxorubicin nanoparticles for targeted treatment of colorectal cancer
Open accessAbstract
Colorectal cancer, common in both men and women, occurs when tumors form in the linings of the colon. Common treatments of colorectal cancer include surgery, chemotherapy, and radiation therapy; however, many colorectal cancer treatments often damage healthy tissues and cells, inducing severe side effects. Conventional chemotherapeutic agents such as doxorubicin (Dox) can be potentially used for the treatment of colorectal cancer; however, they suffer from limited targeting and lack of selectivity. Here, we report that doxorubicin complexed to hyaluronic acid (HA) (HA‐Dox) exhibits an unusual behavior of high accumulation in the intestines for at least 24 hr when injected intravenously. Intravenous administrations of HA‐Dox effectively preserved the mucosal epithelial intestinal integrity in a chemical induced colon cancer model in mice. Moreover, treatment with HA‐Dox decreased the expression of intestinal apoptotic and inflammatory markers. The results suggest that HA‐Dox could effectively inhibit the development of colorectal cancer in a safe manner, which potentially be used a promising therapeutic option.
Overview
AI snapshot
Written from the paper’s full text.
TL;DR
HA–doxorubicin (HA-Dox) nanocomplexes injected intravenously accumulate in the intestine and persist there for at least 24 hr, unlike free doxorubicin. In an AOM/DSS mouse colon cancer model, HA-Dox preserved intestinal architecture and reduced proliferation, inflammation, and apoptosis markers compared with saline.
Key findings
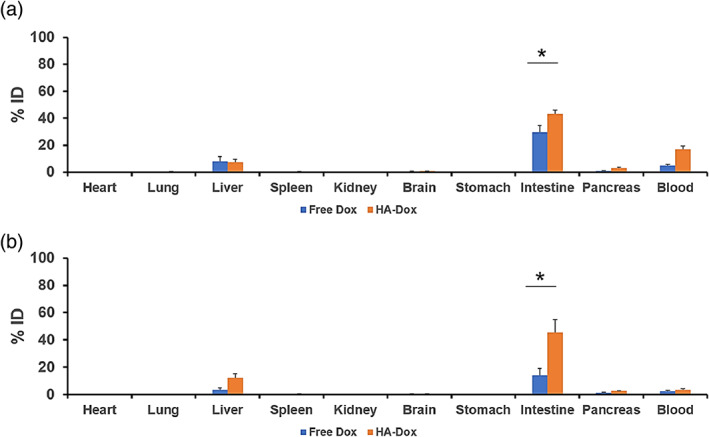
- HA-Dox showed high intestinal accumulation: ~45% injected dose (ID) at 0.5 hr and remained ~45% ID at 24 hr, versus free Dox at ~30% ID and ~15% ID, respectively; intestine:blood ratio was nearly threefold higher for HA-Dox.
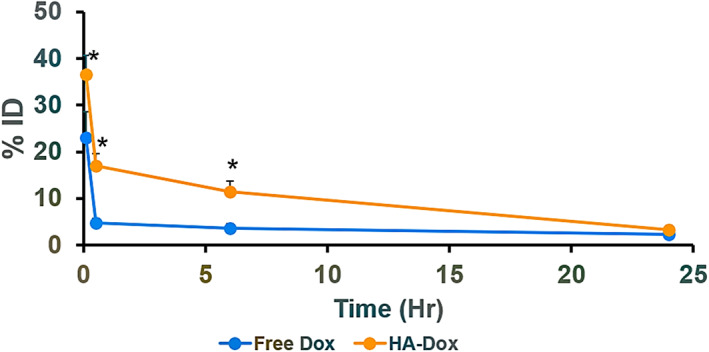
- HA-Dox had longer blood circulation than free Dox: 40% ID vs 20% ID at 0.08 hr, and 3% ID vs 2% ID at 24 hr.
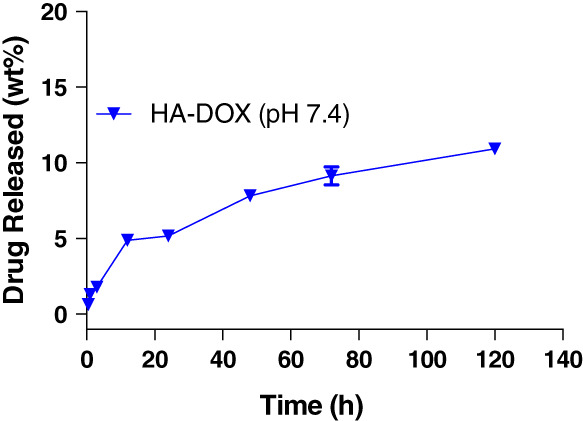
- In vitro, HA-Dox released 20.6 ± 0.8 wt% Dox over 120 hr; particles had a ~50 nm core, 175 nm hydrodynamic size, and zeta potential −4.8 ± 1.06 mV.
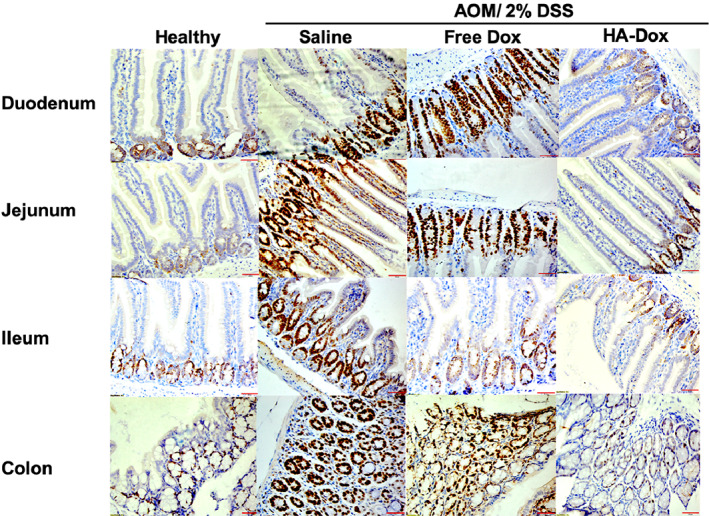
- In AOM/DSS mice, HA-Dox-treated intestines had villi and colon lengths comparable to healthy mice, with lower Ki67 and COX-2 expression than saline or free Dox; iNOS and Bax-2 showed no significant differences across groups, though Bax-2 was elevated in HA-Dox duodenum.
Methods
- HA-Dox was synthesized by conjugating Dox to 50 kDa hyaluronic acid via nucleophilic acyl substitution, purified by size-exclusion chromatography/dialysis, and characterized by TEM, DLS, NanoSight, and fluorescence.
- Healthy female Balb/c mice received IV free Dox or HA-Dox for pharmacokinetics and biodistribution; RBC binding, agglutination, and phosphatidylserine exposure were assessed by flow cytometry and imaging.
- Colorectal cancer was induced in female Balb/c mice with AOM (20 mg/kg) followed by 2.0% DSS in drinking water; mice received IV saline, 105 μg Dox, or 105 μg HA-Dox three times, then intestines were analyzed by H&E and immunohistochemistry for Ki67, COX-2, iNOS, caspase-3, and Bax.
Limitations
- The paper states the intestinal targeting mechanism is unclear, notes difficulty distinguishing normal epithelial turnover from cancer-related apoptosis, and calls for future detailed toxicity studies including cardiac toxicity and anti-inflammatory mechanisms.
- Evident from the text: biodistribution and pharmacokinetic studies used small groups (n = 3), efficacy groups were n = 4 healthy and n = 6–7 treated, only female Balb/c mice were used, and efficacy was assessed by early histologic/proliferation/inflammation markers rather than tumor incidence or survival.
Model-written summary. Check it against the paper before relying on it.
Integrity signals
Registry
Cites
Statistics
Figures
Verification
Claims the paper makes
72 Own result · 25 Own interpretation · 17 Not checked yet · 14 No basis given · 7 Sources not found · 1 Supported so far · 1 Partly supported · 1 Not supported · 1 Own method · accuracy not yet measured
A result the paper reports from its own data — it cites no other source for it, so there is none to check. The quote shows it is in the paper.
In the paper
“The difference between blood concentrations of free Dox and HA‐Dox persisted across all time points studied after 24 hr.”
§ Hyaluronic acid–doxorubicin nanoparticles for targeted treatment of colorectal cancer > RESULTS > Pharmacokinetics of HA‐Dox
plainn = 3 ·- Asserted: passes — The authors put it forward as true.
- Checkable: passes — It can be checked against evidence.
- Load-bearing: passes — The paper’s conclusions depend on it.
- Based: passes — The paper gives a reason why it holds.
A result the paper reports from its own data — it cites no other source for it, so there is none to check. The quote shows it is in the paper.
In the paper
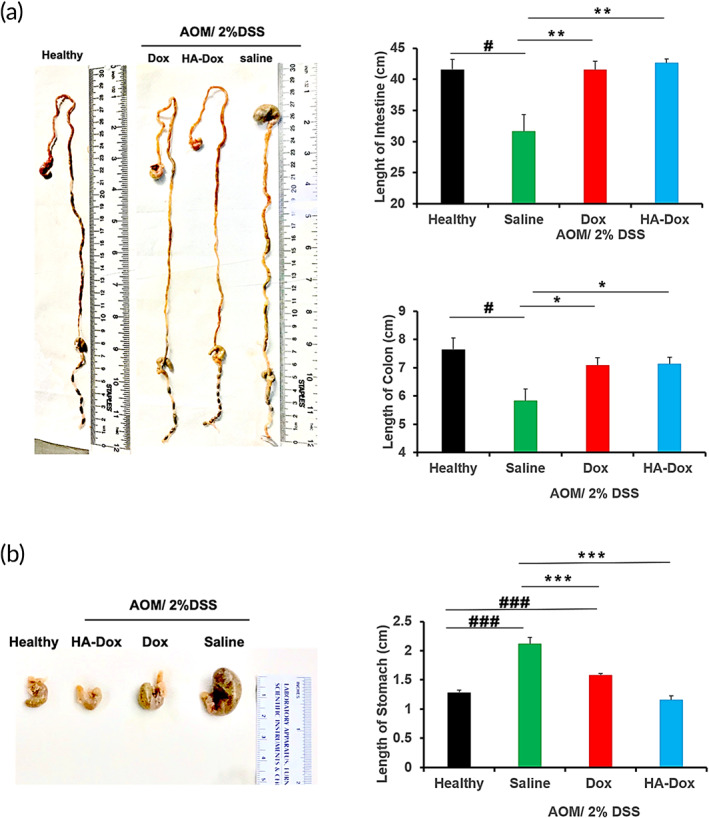
“Saline treated AOM‐DDS mice also exhibited significantly larger stomachs (Figure 7), compared to their free Dox and HA‐Dox counterparts.”
§ Hyaluronic acid–doxorubicin nanoparticles for targeted treatment of colorectal cancer > RESULTS > Effect of Dox and HA‐Dox on early signs of chemical induced colon cancer
plaincorrelationaln = 6- Asserted: passes — The authors put it forward as true.
- Checkable: passes — It can be checked against evidence.
- Load-bearing: unclear — It is unclear whether the paper’s conclusions depend on it.
- Based: passes — The paper gives a reason why it holds.
A result the paper reports from its own data — it cites no other source for it, so there is none to check. The quote shows it is in the paper.
In the paper
“There was a significant increase in HA‐Dox accumulation in the intestine compared to its free Dox counterpart (~45% ID vs ~30% ID respectively).”
§ Hyaluronic acid–doxorubicin nanoparticles for targeted treatment of colorectal cancer > RESULTS > Biodistribution of HA‐Dox
plaindirectn = 3 ·- Asserted: passes — The authors put it forward as true.
- Checkable: passes — It can be checked against evidence.
- Load-bearing: passes — The paper’s conclusions depend on it.
- Based: passes — The paper gives a reason why it holds.
A result the paper reports from its own data — it cites no other source for it, so there is none to check. The quote shows it is in the paper.
In the paper
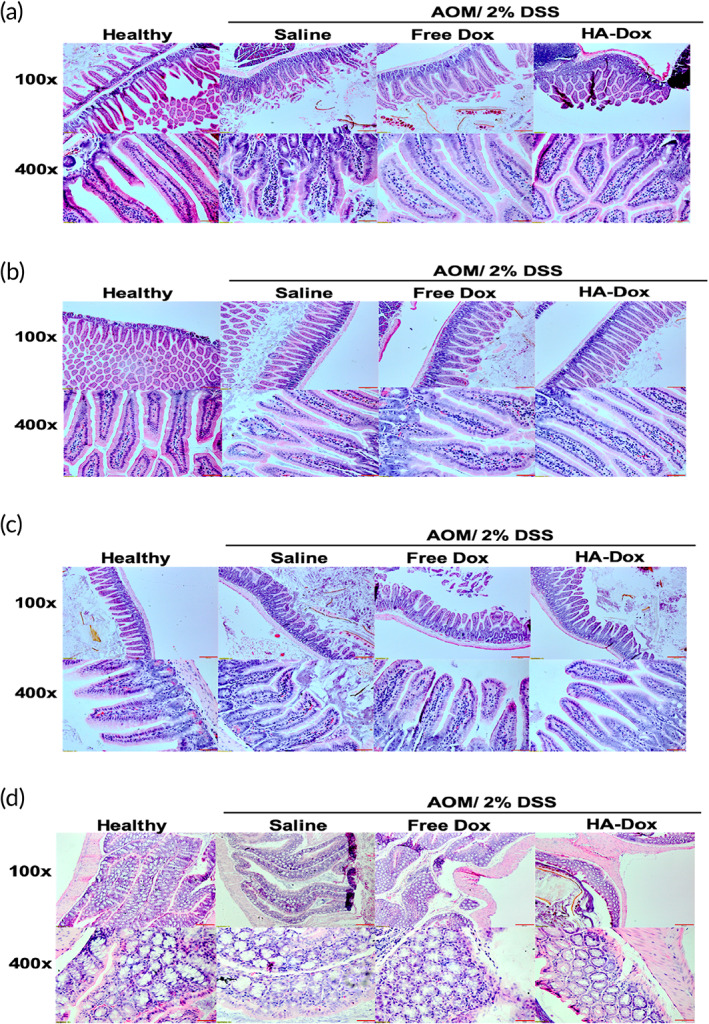
“Microscopic evaluation of H&E stained small intestine and colon sections of AOM/DSS‐treated mice displayed increased intestinal injuries compared to healthy mice (Figure 8).”
§ Hyaluronic acid–doxorubicin nanoparticles for targeted treatment of colorectal cancer > RESULTS > Effect of Dox and HA‐Dox on early signs of chemical induced colon cancer
plaincorrelational- Asserted: passes — The authors put it forward as true.
- Checkable: passes — It can be checked against evidence.
- Load-bearing: passes — The paper’s conclusions depend on it.
- Based: passes — The paper gives a reason why it holds.
A result the paper reports from its own data — it cites no other source for it, so there is none to check. The quote shows it is in the paper.
In the paper
“The amount of HA‐Dox and free Dox circulating in the blood decreased 24 hr after administration (3% ID and 2% ID, respectively).”
§ Hyaluronic acid–doxorubicin nanoparticles for targeted treatment of colorectal cancer > RESULTS > Pharmacokinetics of HA‐Dox
plaindirectn = 3- Asserted: passes — The authors put it forward as true.
- Checkable: passes — It can be checked against evidence.
- Load-bearing: passes — The paper’s conclusions depend on it.
- Based: passes — The paper gives a reason why it holds.
A result the paper reports from its own data — it cites no other source for it, so there is none to check. The quote shows it is in the paper.
In the paper
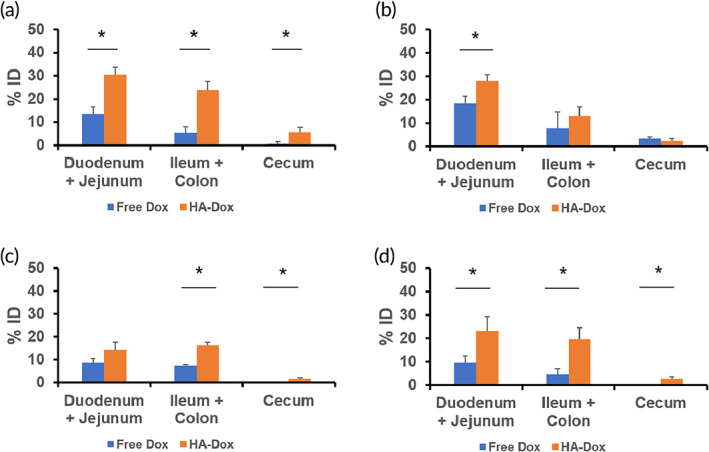
“Compared to 0.08 hr, the amount of HA‐Dox in the duodenum and jejunum remained fairly constant after 0.5 hr (Figure 6b), 6 hr (Figure 6c), and 24 hr (Figure 6d).”
§ Hyaluronic acid–doxorubicin nanoparticles for targeted treatment of colorectal cancer > RESULTS > Biodistribution of HA‐Dox
plainn = 3- Asserted: passes — The authors put it forward as true.
- Checkable: passes — It can be checked against evidence.
- Load-bearing: unclear — It is unclear whether the paper’s conclusions depend on it.
- Based: passes — The paper gives a reason why it holds.
A result the paper reports from its own data — it cites no other source for it, so there is none to check. The quote shows it is in the paper.
In the paper
“Furthermore, villi of AOM/DSS mice also displayed large tears, compared to the healthy counterparts.”
§ Hyaluronic acid–doxorubicin nanoparticles for targeted treatment of colorectal cancer > RESULTS > Effect of Dox and HA‐Dox on early signs of chemical induced colon cancer
plaincorrelational- Asserted: passes — The authors put it forward as true.
- Checkable: passes — It can be checked against evidence.
- Load-bearing: unclear — It is unclear whether the paper’s conclusions depend on it.
- Based: passes — The paper gives a reason why it holds.
A result the paper reports from its own data — it cites no other source for it, so there is none to check. The quote shows it is in the paper.
In the paper
“AOM/DSS mice injected with free Dox displayed a milder form of villi atrophy, while the small intestine of the HA‐Dox‐treated AOM/DSS mice were covered with long villi that were almost the same length as the villi observed in healthy mice.”
§ Hyaluronic acid–doxorubicin nanoparticles for targeted treatment of colorectal cancer > RESULTS > Effect of Dox and HA‐Dox on early signs of chemical induced colon cancer
plaindirect- Asserted: passes — The authors put it forward as true.
- Checkable: passes — It can be checked against evidence.
- Load-bearing: passes — The paper’s conclusions depend on it.
- Based: passes — The paper gives a reason why it holds.
A result the paper reports from its own data — it cites no other source for it, so there is none to check. The quote shows it is in the paper.
In the paper
“Saline injected AOM/DSS mice exhibited substantial damaged intestinal villi and villi atrophy, which is exhibited by the erosion of the villi, resulting in a flat surface.”
§ Hyaluronic acid–doxorubicin nanoparticles for targeted treatment of colorectal cancer > RESULTS > Effect of Dox and HA‐Dox on early signs of chemical induced colon cancer
plaindirect- Asserted: passes — The authors put it forward as true.
- Checkable: passes — It can be checked against evidence.
- Load-bearing: passes — The paper’s conclusions depend on it.
- Based: passes — The paper gives a reason why it holds.
A result the paper reports from its own data — it cites no other source for it, so there is none to check. The quote shows it is in the paper.
In the paper
“Some signal was observed in all parts of the intestine (duodenum, jejunum, ileum, and the colon), suggesting that HA accumulates in the intestines (Figure S4a).”
§ Hyaluronic acid–doxorubicin nanoparticles for targeted treatment of colorectal cancer > RESULTS > Biodistribution of HA‐Dox
hedged- Asserted: passes — The authors put it forward as true.
- Checkable: passes — It can be checked against evidence.
- Load-bearing: passes — The paper’s conclusions depend on it.
- Based: passes — The paper gives a reason why it holds.
- It may state two separate claims as one. 32
- Probably not a substantial claim. 27
At least one cited source doesn’t support this claim or points to a different paper, and none confirmed it — see the verdicts below.
In the paper
“HA is able to bind to receptors on the cell membrane of tumor cells, which slows metastasis and cell migration”
§ Hyaluronic acid–doxorubicin nanoparticles for targeted treatment of colorectal cancer > INTRODUCTION
What the sources say
- Disputedcites [74] Turley EA, Austen L, Vandeligt K, Clary C. Hyaluronan and cell‐associated hyaluronan binding protein regulate the location of ras‐transformed cells. J Cell Biol. 1991; 112: 1041‐ 1047. 1705559 PMC2288867 sourceExperimental — accuracy not yet measured
The Abstract (p. 1041) identifies a hyaluronan-binding protein on the studied ras-transformed cells, but reports that added HA stimulates their locomotion, not slows it. The concluding Discussion likewise describes HA–HABP interactions as promoting cell locomotion. The paper does not establish an effect on metastasis. (LLM, conf=0.91)
Checked by a reasoning model — may be wrong.
- Not checked yetcites [75] Muhan L, Tolg C, Turley E. Dissecting the dual nature of Hyaluronan in the tumor microenvironment. Front Immunol. 2019; 10: 947. 31134064 PMC6522846
- Disputedcites [76] Turley EA, Wood DK, McCarthy JB. Carcinoma cell hyaluronan as a “portable” cncerized prometastatic microenvironment. Cancer Res. 2016; 76: 2507‐ 2512. 27197262 PMC4874571 sourceExperimental — accuracy not yet measured
The paper supports HA binding to receptors on tumor-cell membranes, but says this promotes, rather than slows, migration and metastasis. The “HA Pericellular Matrices, Fragments and Metastasis” section describes HA-induced receptor clustering as sustaining pro-invasion and migration signaling; the Conclusions distinguish this from interventions that inhibit HA interactions and limit metastasis. Page numbers were not provided in our copy. (LLM, conf=0.91)
Checked by a reasoning model — may be wrong.
plaindirect- Asserted: passes — The authors put it forward as true.
- Checkable: passes — It can be checked against evidence.
- Load-bearing: passes — The paper’s conclusions depend on it.
- Based: passes — The paper gives a reason why it holds.
It may state two separate claims as one.
- Disputed
The sources with a verdict support this claim; the rest weren’t checked yet, have no full text we could read, or their verdicts aren’t rated yet.
In the paper
“Prior literature has shown that RBC‐association enhances the circulation of polymeric nanoparticles.”
§ Hyaluronic acid–doxorubicin nanoparticles for targeted treatment of colorectal cancer > RESULTS > Pharmacokinetics of HA‐Dox
What the sources say
- Not checked — no full text of the sourcecites [81] Chambers E, Mitragotri S. Prolonged circulation of large polymeric nanoparticles by non‐covalent adsorption of erythrocytes. J Control Release. 2004; 100(1): 111‐ 119. 15491815 source
- Not checked — no full text of the sourcecites [82] Chambers E, Mitragotri S. Long circulating nanoparticles via adhesion on red blood cells: mechanism and extended circulation. Exp Bio Med. 2007; 232(7): 958‐ 966. 17609513
- Supportedcites [83] Anselmo AC, Gupta V, Zern BJ, et al. Delivering nanoparticles to lungs while avoiding liver and spleen through adsorption on red blood cells. ACS Nano. 2013; 7(12): 11129‐ 11137. 24182189 PMC4128963 source
The Results section, “Attachment of Nanoparticles” (page not provided), identifies the particles as polystyrene nanoparticles, a polymeric material. “Biodistribution of Nanoparticles” (page not provided) reports that RBC-associated particles had blood levels about 2–3 times those of free particles and concludes that RBC carriage markedly prolongs nanoparticle circulation. (LLM, conf=0.94)
plaindirect- Asserted: passes — The authors put it forward as true.
- Checkable: passes — It can be checked against evidence.
- Load-bearing: passes — The paper’s conclusions depend on it.
- Based: passes — The paper gives a reason why it holds.
Probably not a substantial claim.
The cited sources support only part of this claim — read each source’s verdict below.
In the paper
“The development of IBD‐related colorectal cancer (CRC), chronic inflammation is a major risk factor for gastrointestinal malignancies development in IBD patients.”
§ Hyaluronic acid–doxorubicin nanoparticles for targeted treatment of colorectal cancer > DISCUSSION
What the sources say
- Not checked yetcites [137] Lukas M. Inflammatory bowel disease as a risk factor for colorectal cancer. Dig Dis. 2010; 28(4–5): 619‐ 624. 21088413
- Supportedcites [138] Axelrad JE, Lichtiger S, Yajnik V. Inflammatory bowel disease and cancer: the role of inflammation, immunosuppression, and cancer treatment. World J Gastroenterol. 2016; 22(20): 4794‐ 4801. 27239106 PMC4873872 source
The section “Cancer secondary to chronic intestinal inflammation” states that chronic intestinal inflammation is the primary risk factor for gastrointestinal malignancy in patients with IBD and identifies colorectal cancer among those malignancies. This directly supports the attributed claim. (LLM, conf=0.95)
- Partly supportedcites [139] Kim ER, Chang DK. Colorectal cancer in inflammatory bowel disease: the risk, pathogenesis, prevention, and diagnosis. World J Gastroenterol. 2014; 20(29): 9872‐ 9881. 25110418 PMC4123369 sourceExperimental — accuracy not yet measured
The Risk Factors section states that chronic inflammation is a key risk factor for colorectal cancer in patients with IBD. The claim extends this finding to gastrointestinal malignancies generally, which the cited passage does not establish. (LLM, conf=0.86)
plaindirect- Asserted: passes — The authors put it forward as true.
- Checkable: passes — It can be checked against evidence.
- Load-bearing: fails — The paper’s conclusions may not depend on it.
- Based: passes — The paper gives a reason why it holds.
Probably not a substantial claim. The paper’s conclusions may not depend on it.
A result the paper reports from its own data — it cites no other source for it, so there is none to check. The quote shows it is in the paper.
In the paper
“Dox and HA‐Dox exhibited classical elimination behavior, however, a significant difference in the elimination half‐life was found.”
§ Hyaluronic acid–doxorubicin nanoparticles for targeted treatment of colorectal cancer > RESULTS > Pharmacokinetics of HA‐Dox
plaincorrelationaln = 3 ·- Asserted: passes — The authors put it forward as true.
- Checkable: passes — It can be checked against evidence.
- Load-bearing: passes — The paper’s conclusions depend on it.
- Based: passes — The paper gives a reason why it holds.
It may state two separate claims as one.
A result the paper reports from its own data — it cites no other source for it, so there is none to check. The quote shows it is in the paper.
In the paper
“Free Dox accumulated in the liver (8% ID) 0.5 hr after administration and ~30% ID of free Dox accumulated in the intestine.”
§ Hyaluronic acid–doxorubicin nanoparticles for targeted treatment of colorectal cancer > RESULTS > Biodistribution of HA‐Dox
plainn = 3- Asserted: passes — The authors put it forward as true.
- Checkable: passes — It can be checked against evidence.
- Load-bearing: passes — The paper’s conclusions depend on it.
- Based: passes — The paper gives a reason why it holds.
It may state two separate claims as one.
A result the paper reports from its own data — it cites no other source for it, so there is none to check. The quote shows it is in the paper.
In the paper
“Intestinal tissues of the healthy group had normal architecture, although there were cyclooxygenase‐2 positive cells exhibited in the mucosa, particularly prevalent in the epithelial lining encapsulating the villi.”
§ Hyaluronic acid–doxorubicin nanoparticles for targeted treatment of colorectal cancer > RESULTS > The effect of Dox and HA‐Dox on intestinal inflammation in mice with chemical‐induced colon cancer
plain- Asserted: passes — The authors put it forward as true.
- Checkable: passes — It can be checked against evidence.
- Load-bearing: unclear — It is unclear whether the paper’s conclusions depend on it.
- Based: passes — The paper gives a reason why it holds.
It may state two separate claims as one.
A result the paper reports from its own data — it cites no other source for it, so there is none to check. The quote shows it is in the paper.
In the paper
“In contrast, there was no significant difference in the levels of caspase‐3‐activation in the colon between saline, Dox, and HA‐Dox treated AOM/DSS mice though caspase‐3‐activation was lower in the colon of healthy mice.”
§ Hyaluronic acid–doxorubicin nanoparticles for targeted treatment of colorectal cancer > RESULTS > The effect of Dox and HA‐Dox on intestinal apoptosis in mice with chemical‐induced colon cancer
plain- Asserted: passes — The authors put it forward as true.
- Checkable: passes — It can be checked against evidence.
- Load-bearing: unclear — It is unclear whether the paper’s conclusions depend on it.
- Based: passes — The paper gives a reason why it holds.
It may state two separate claims as one.
A result the paper reports from its own data — it cites no other source for it, so there is none to check. The quote shows it is in the paper.
In the paper
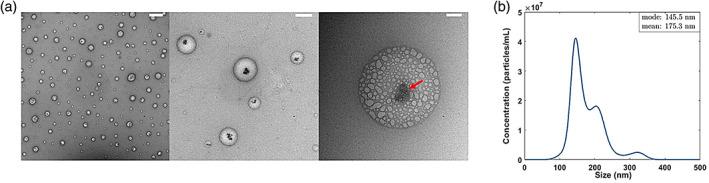
“TEM image, at the highest magnification, depicted a dense core (arrow) with a diffuse shell of HAs, confirming Dox incorporating within the HA‐nanocomplexes.”
§ Hyaluronic acid–doxorubicin nanoparticles for targeted treatment of colorectal cancer > RESULTS > Characterization of HA‐Dox
boosteddirect- Asserted: passes — The authors put it forward as true.
- Checkable: passes — It can be checked against evidence.
- Load-bearing: passes — The paper’s conclusions depend on it.
- Based: passes — The paper gives a reason why it holds.
It may state two separate claims as one.
A result the paper reports from its own data — it cites no other source for it, so there is none to check. The quote shows it is in the paper.
In the paper
“While only 20% ID of free Dox was detected in blood 0.08 hr after injection, 40% ID of HA‐Dox could be detected in the blood at the time point (Figure 3).”
§ Hyaluronic acid–doxorubicin nanoparticles for targeted treatment of colorectal cancer > RESULTS > Pharmacokinetics of HA‐Dox
hedgedn = 3 ·- Asserted: passes — The authors put it forward as true.
- Checkable: passes — It can be checked against evidence.
- Load-bearing: passes — The paper’s conclusions depend on it.
- Based: passes — The paper gives a reason why it holds.
It may state two separate claims as one.
A result the paper reports from its own data — it cites no other source for it, so there is none to check. The quote shows it is in the paper.
In the paper
“At 0.5 h post injection, however, stronger signal was detected in the duodenum and the beginning of the jejunum and no signal was detected in the ileum, cecum, or colon (Figure S5b).”
§ Hyaluronic acid–doxorubicin nanoparticles for targeted treatment of colorectal cancer > RESULTS > Biodistribution of HA‐Dox
plain- Asserted: passes — The authors put it forward as true.
- Checkable: passes — It can be checked against evidence.
- Load-bearing: passes — The paper’s conclusions depend on it.
- Based: passes — The paper gives a reason why it holds.
It may state two separate claims as one.
A result the paper reports from its own data — it cites no other source for it, so there is none to check. The quote shows it is in the paper.
In the paper
“HA‐Dox, a 150 nm nanoparticle‐like complex, was observed 0.08 hr (5 min) after administration in the blood, however, over time, HA‐Dox was cleared from the bloodstream.”
§ Hyaluronic acid–doxorubicin nanoparticles for targeted treatment of colorectal cancer > DISCUSSION
plain- Asserted: passes — The authors put it forward as true.
- Checkable: passes — It can be checked against evidence.
- Load-bearing: unclear — It is unclear whether the paper’s conclusions depend on it.
- Based: passes — The paper gives a reason why it holds.
It may state two separate claims as one.
A result the paper reports from its own data — it cites no other source for it, so there is none to check. The quote shows it is in the paper.
In the paper
“HA and Dox are spherical particles possessing a core–shell morphology (Figure 1a).”
§ Hyaluronic acid–doxorubicin nanoparticles for targeted treatment of colorectal cancer > RESULTS > Characterization of HA‐Dox
plain- Asserted: passes — The authors put it forward as true.
- Checkable: passes — It can be checked against evidence.
- Load-bearing: unclear — It is unclear whether the paper’s conclusions depend on it.
- Based: passes — The paper gives a reason why it holds.
It may state two separate claims as one.
A result the paper reports from its own data — it cites no other source for it, so there is none to check. The quote shows it is in the paper.
In the paper
“Similar to HA‐AlexaFluro647, strong signal was observed in the stomach for HA‐Dox‐AlexaFluro647 and low signal were observed in the cecum and colon at both time points. No signal was detected in the duodenum, jejunum, and ileum (Figure S5a).”
§ Hyaluronic acid–doxorubicin nanoparticles for targeted treatment of colorectal cancer > RESULTS > Biodistribution of HA‐Dox
plain- Asserted: passes — The authors put it forward as true.
- Checkable: passes — It can be checked against evidence.
- Load-bearing: passes — The paper’s conclusions depend on it.
- Based: passes — The paper gives a reason why it holds.
It may state two separate claims as one.
None of the sources cited for this claim have been checked yet.
In the paper
“Unlike most nanoparticles that are able to adsorb onto RBC, 83 , 84 HA‐Dox does not accumulate in the lungs, rather it accumulates in the intestines.”
§ Hyaluronic acid–doxorubicin nanoparticles for targeted treatment of colorectal cancer > DISCUSSION
What the sources say
- Not checked yetcites [83] Anselmo AC, Gupta V, Zern BJ, et al. Delivering nanoparticles to lungs while avoiding liver and spleen through adsorption on red blood cells. ACS Nano. 2013; 7(12): 11129‐ 11137. 24182189 PMC4128963 source
Checked before — its earlier verdict is held back until a new check runs.
- Not checked yetcites [84] Brenner JS, Pan DC, Myerson JW, et al. Red blood cell‐hitchhiking boosts delivery of nanocarriers to chosen organs by orders of magnitude. Nat Commun. 2018; 9(1): 2684. 29992966 PMC6041332 source
Checked before — its earlier verdict is held back until a new check runs.
plain- Asserted: passes — The authors put it forward as true.
- Checkable: passes — It can be checked against evidence.
- Load-bearing: passes — The paper’s conclusions depend on it.
- Based: passes — The paper gives a reason why it holds.
It may state two separate claims as one.
- Not checked yet
A result the paper reports from its own data — it cites no other source for it, so there is none to check. The quote shows it is in the paper.
In the paper
“Interestingly, there was no significant difference in Bax‐2 levels between saline, Dox, and HA‐Dox treated AOM/DSS mice and healthy mice, although Bax‐2 levels were elevated in the duodenum of HA‐Dox treated AOM/DSS.”
§ Hyaluronic acid–doxorubicin nanoparticles for targeted treatment of colorectal cancer > RESULTS > The effect of Dox and HA‐Dox on intestinal apoptosis in mice with chemical‐induced colon cancer
plain- Asserted: passes — The authors put it forward as true.
- Checkable: passes — It can be checked against evidence.
- Load-bearing: unclear — It is unclear whether the paper’s conclusions depend on it.
- Based: passes — The paper gives a reason why it holds.
It may state two separate claims as one.
A result the paper reports from its own data — it cites no other source for it, so there is none to check. The quote shows it is in the paper.
In the paper
“HA‐Dox‐treated AOM/DSS mice had villi that had very small tears and appear to have the lining of the villi almost as intact as that of healthy mice.”
§ Hyaluronic acid–doxorubicin nanoparticles for targeted treatment of colorectal cancer > RESULTS > Effect of Dox and HA‐Dox on early signs of chemical induced colon cancer
hedged- Asserted: passes — The authors put it forward as true.
- Checkable: passes — It can be checked against evidence.
- Load-bearing: passes — The paper’s conclusions depend on it.
- Based: passes — The paper gives a reason why it holds.
It may state two separate claims as one.
A result the paper reports from its own data — it cites no other source for it, so there is none to check. The quote shows it is in the paper.
In the paper
“Significant accumulation of HA‐Dox was found in intestine (~45% ID), while only ~7% ID was found in the liver 0.5 hr after administration (Figure 5a).”
§ Hyaluronic acid–doxorubicin nanoparticles for targeted treatment of colorectal cancer > RESULTS > Biodistribution of HA‐Dox
plainn = 3- Asserted: passes — The authors put it forward as true.
- Checkable: passes — It can be checked against evidence.
- Load-bearing: passes — The paper’s conclusions depend on it.
- Based: passes — The paper gives a reason why it holds.
It may state two separate claims as one.
The paper states this without a source or data behind it here, so there is nothing to check it against. The quote shows it is in the paper.
In the paper
“A higher rate of cell proliferation tended to have an increased expression of COX‐2.”
§ Hyaluronic acid–doxorubicin nanoparticles for targeted treatment of colorectal cancer > RESULTS > The effect of Dox and HA‐Dox on intestinal inflammation in mice with chemical‐induced colon cancer
hedgedcorrelational- Asserted: passes — The authors put it forward as true.
- Checkable: passes — It can be checked against evidence.
- Load-bearing: fails — The paper’s conclusions may not depend on it.
- Based: passes — The paper gives a reason why it holds.
Probably not a substantial claim. The paper’s conclusions may not depend on it.
A result the paper reports from its own data — it cites no other source for it, so there is none to check. The quote shows it is in the paper.
In the paper
“Similarly, iNOS positive cells were also predominantly prevalent in the epithelial lining surrounding the villi.”
§ Hyaluronic acid–doxorubicin nanoparticles for targeted treatment of colorectal cancer > RESULTS > The effect of Dox and HA‐Dox on intestinal inflammation in mice with chemical‐induced colon cancer
plain- Asserted: passes — The authors put it forward as true.
- Checkable: passes — It can be checked against evidence.
- Load-bearing: fails — The paper’s conclusions may not depend on it.
- Based: passes — The paper gives a reason why it holds.
Probably not a substantial claim. The paper’s conclusions may not depend on it.
The paper states this without a source or data behind it here, so there is nothing to check it against. The quote shows it is in the paper.
In the paper
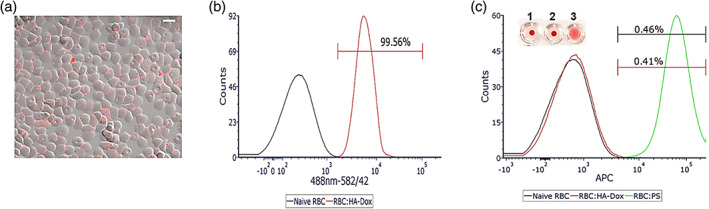
“HA‐Dox is able to absorb onto RBC in the presence of serum; however, it detaches quickly.”
§ Hyaluronic acid–doxorubicin nanoparticles for targeted treatment of colorectal cancer > DISCUSSION
plaindirect- Asserted: passes — The authors put it forward as true.
- Checkable: passes — It can be checked against evidence.
- Load-bearing: unclear — It is unclear whether the paper’s conclusions depend on it.
- Based: passes — The paper gives a reason why it holds.
It may state two separate claims as one.
A result the paper reports from its own data — it cites no other source for it, so there is none to check. The quote shows it is in the paper.
In the paper
“The villi in saline injected AOM/DSS mice displayed large tears while villi in mice treated with free Dox displayed smaller tears.”
§ Hyaluronic acid–doxorubicin nanoparticles for targeted treatment of colorectal cancer > RESULTS > Effect of Dox and HA‐Dox on early signs of chemical induced colon cancer
plaincorrelational- Asserted: passes — The authors put it forward as true.
- Checkable: passes — It can be checked against evidence.
- Load-bearing: passes — The paper’s conclusions depend on it.
- Based: passes — The paper gives a reason why it holds.
It may state two separate claims as one.
A conclusion the paper draws from its own results — it cites no other source for it, so there is none to check. The quote shows it is in the paper.
In the paper
“In the presence of salt, hydrophobic interactions between Dox molecules in HA supersede ionic repulsion between the HA fibrils. This promotes self‐assembled aggregation of micelles with varying sizes, resulting in a heterogenous board distribution of HA‐Dox in PBS.”
§ Hyaluronic acid–doxorubicin nanoparticles for targeted treatment of colorectal cancer > RESULTS > Characterization of HA‐Dox
plaindirect- Asserted: passes — The authors put it forward as true.
- Checkable: passes — It can be checked against evidence.
- Load-bearing: unclear — It is unclear whether the paper’s conclusions depend on it.
- Based: passes — The paper gives a reason why it holds.
It may state two separate claims as one.
A conclusion the paper draws from its own results — it cites no other source for it, so there is none to check. The quote shows it is in the paper.
In the paper
“These findings are significant in HA‐Dox and may play a role in the management of COX‐2 expression, suggesting it might have COX‐2 inhibitor properties.”
§ Hyaluronic acid–doxorubicin nanoparticles for targeted treatment of colorectal cancer > RESULTS > The effect of Dox and HA‐Dox on intestinal inflammation in mice with chemical‐induced colon cancer
hedgedconditional- Asserted: passes — The authors put it forward as true.
- Checkable: passes — It can be checked against evidence.
- Load-bearing: unclear — It is unclear whether the paper’s conclusions depend on it.
- Based: passes — The paper gives a reason why it holds.
It may state two separate claims as one.
The paper states this without a source or data behind it here, so there is nothing to check it against. The quote shows it is in the paper.
In the paper
“HA, coupled to a conventional anticancer drug, could reduce the therapeutic dose along with reduced toxicity to healthy cells.”
§ Hyaluronic acid–doxorubicin nanoparticles for targeted treatment of colorectal cancer > INTRODUCTION
hedgedconditional- Asserted: passes — The authors put it forward as true.
- Checkable: passes — It can be checked against evidence.
- Load-bearing: passes — The paper’s conclusions depend on it.
- Based: unclear — It is unclear why the paper says it holds.
It may state two separate claims as one.
A conclusion the paper draws from its own results — it cites no other source for it, so there is none to check. The quote shows it is in the paper.
In the paper
“However, our variant of doxorubicin conjugated to hyaluronic acid is biocompatible and does not exhibit the issues present in the current intravenous injection therapy.”
§ Hyaluronic acid–doxorubicin nanoparticles for targeted treatment of colorectal cancer > DISCUSSION
plain- Asserted: passes — The authors put it forward as true.
- Checkable: passes — It can be checked against evidence.
- Load-bearing: passes — The paper’s conclusions depend on it.
- Based: passes — The paper gives a reason why it holds.
It may state two separate claims as one.
A conclusion the paper draws from its own results — it cites no other source for it, so there is none to check. The quote shows it is in the paper.
In the paper
“However, the slow release does not affect the therapeutic efficacy of HA‐Dox compared to the free Dox.”
§ Hyaluronic acid–doxorubicin nanoparticles for targeted treatment of colorectal cancer > RESULTS > In vitro hydrolysis
plainn = 3- Asserted: passes — The authors put it forward as true.
- Checkable: passes — It can be checked against evidence.
- Load-bearing: passes — The paper’s conclusions depend on it.
- Based: fails — The paper may give no reason why it holds.
Probably not a substantial claim. The paper may give no reason why it holds.
The paper states this without a source or data behind it here, so there is nothing to check it against. The quote shows it is in the paper.
In the paper
“However, administration of Doxil induces low blood counts and increasing risk for anemia.”
§ Hyaluronic acid–doxorubicin nanoparticles for targeted treatment of colorectal cancer > INTRODUCTION
plaindirect- Asserted: passes — The authors put it forward as true.
- Checkable: passes — It can be checked against evidence.
- Load-bearing: passes — The paper’s conclusions depend on it.
- Based: passes — The paper gives a reason why it holds.
It may state two separate claims as one.
The paper states this without a source or data behind it here, so there is nothing to check it against. The quote shows it is in the paper.
In the paper
“Hyaluronic acid (HA), a naturally found polymer found in the body, has been shown to be useful in cancer treatment as a therapeutic.”
§ Hyaluronic acid–doxorubicin nanoparticles for targeted treatment of colorectal cancer > INTRODUCTION
plaindirect- Asserted: passes — The authors put it forward as true.
- Checkable: passes — It can be checked against evidence.
- Load-bearing: passes — The paper’s conclusions depend on it.
- Based: passes — The paper gives a reason why it holds.
It may state two separate claims as one.
None of the sources cited for this claim have been checked yet.
In the paper
“Recently, a Dox‐loaded hyaluronic acid ceramide nanoassembly releasing microspheres, administered intra‐arterially, was used to treat tumors.”
§ Hyaluronic acid–doxorubicin nanoparticles for targeted treatment of colorectal cancer > INTRODUCTION
What the sources say
- Not checked yetcites [79] Lee SY, Choi JW, Lee JY, Kim DD, Kim HC, Cho HJ. Hyaluronic acid/doxorubicin nanoassemby‐releasing microspheres for the transarterial chemoembolization of a liver tumor. Drug Deliv. 2018; 25: 1472‐ 1483. 29909706 PMC6058484 source
Checked before — its earlier verdict is held back until a new check runs.
plain- Asserted: passes — The authors put it forward as true.
- Checkable: passes — It can be checked against evidence.
- Load-bearing: fails — The paper’s conclusions may not depend on it.
- Based: passes — The paper gives a reason why it holds.
Probably not a substantial claim. The paper’s conclusions may not depend on it.
- Not checked yet
The paper states this without a source or data behind it here, so there is nothing to check it against. The quote shows it is in the paper.
In the paper
“There are many studies have shown that drugs taken orally are absorbed systemically from the small intestine, making oral drug delivery to be the traditional choice for intestinal targeting.”
§ Hyaluronic acid–doxorubicin nanoparticles for targeted treatment of colorectal cancer > DISCUSSION
boosteddirect- Asserted: passes — The authors put it forward as true.
- Checkable: passes — It can be checked against evidence.
- Load-bearing: fails — The paper’s conclusions may not depend on it.
- Based: fails — The paper may give no reason why it holds.
Probably not a substantial claim. The paper’s conclusions may not depend on it. The paper may give no reason why it holds. It may state two separate claims as one.
None of the sources cited for this claim have been checked yet.
In the paper
“Doxorubicin encapsulated in a liposome (Doxil), administrated intravenously, has been used to treat breast cancer, ovarian cancer, Kaposi's sarcoma, and other solid tumors.”
§ Hyaluronic acid–doxorubicin nanoparticles for targeted treatment of colorectal cancer > INTRODUCTION
What the sources say
- Not checked yetcites [69] Gabizon AA. Pegylated liposomal doxorubicin: metamorphosis of an old drug into a new form of chemotherapy. Cancer Invest. 2001; 19(4): 424‐ 436. 11405181
- Not checked — no full text of the sourcecites [70] Duggan ST, Keating GM. Pegylated liposomal doxoribucin: a review of its use in metastatic breast cancer, ovarian cancer, multiple myeloma and AIDS‐related Kaposi's sarcoma. Drugs. 2011; 71(18): 2531‐ 2558. 22141391 source
- Not checked — no full text of the sourcecites [71] Lyseng‐Williamson KA, Duggan ST, Keating GM. Pegylated liposomal doxorubicin: a guide to its use in various malignancies. BioDrugs. 2013; 27(5): 533‐ 540. 24018470 source
plain- Asserted: passes — The authors put it forward as true.
- Checkable: passes — It can be checked against evidence.
- Load-bearing: fails — The paper’s conclusions may not depend on it.
- Based: passes — The paper gives a reason why it holds.
Probably not a substantial claim. The paper’s conclusions may not depend on it.
The paper states this without a source or data behind it here, so there is nothing to check it against. The quote shows it is in the paper.
In the paper
“Doxorubicin has been used to treat cancers such as leukemia, lymphoma, as well as breast cancer, lung cancer, and thyroid cancer.”
§ Hyaluronic acid–doxorubicin nanoparticles for targeted treatment of colorectal cancer > DISCUSSION
plain- Asserted: passes — The authors put it forward as true.
- Checkable: passes — It can be checked against evidence.
- Load-bearing: fails — The paper’s conclusions may not depend on it.
- Based: fails — The paper may give no reason why it holds.
Probably not a substantial claim. The paper’s conclusions may not depend on it. The paper may give no reason why it holds.
The paper states this without a source or data behind it here, so there is nothing to check it against. The quote shows it is in the paper.
In the paper
“It is only available on the market as intravenous formulations, often laden with cardiotoxicity and a drastically reduced ability to specifically target the intestines and colon.”
§ Hyaluronic acid–doxorubicin nanoparticles for targeted treatment of colorectal cancer > DISCUSSION
plaindirect- Asserted: passes — The authors put it forward as true.
- Checkable: passes — It can be checked against evidence.
- Load-bearing: passes — The paper’s conclusions depend on it.
- Based: fails — The paper may give no reason why it holds.
Probably not a substantial claim. The paper may give no reason why it holds. It may state two separate claims as one.
A conclusion the paper draws from its own results — it cites no other source for it, so there is none to check. The quote shows it is in the paper.
In the paper
“Thus, doxorubicin exhibits low oral bioavailability and traditional drug delivery pathway to the intestines is hindered.”
§ Hyaluronic acid–doxorubicin nanoparticles for targeted treatment of colorectal cancer > DISCUSSION
plaindirect- Asserted: passes — The authors put it forward as true.
- Checkable: passes — It can be checked against evidence.
- Load-bearing: passes — The paper’s conclusions depend on it.
- Based: passes — The paper gives a reason why it holds.
It may state two separate claims as one.
- Rests on an assumption: Doxorubicin undergoes acid hydrolysis in the stomach and any remaining doxorubicin reaching the intestine is discharged by P-glycoprotein, found in the epithelial cells lining the small intestine and colon.
A conclusion the paper draws from its own results — it cites no other source for it, so there is none to check. The quote shows it is in the paper.
In the paper
“The results suggest that HA‐Dox could effectively inhibit the development of colorectal cancer in a safe manner, which potentially be used a promising therapeutic option.”
§ Hyaluronic acid–doxorubicin nanoparticles for targeted treatment of colorectal cancer > Abstract
hedgeddirect- Asserted: passes — The authors put it forward as true.
- Checkable: passes — It can be checked against evidence.
- Load-bearing: passes — The paper’s conclusions depend on it.
- Based: passes — The paper gives a reason why it holds.
It may state two separate claims as one.
The paper states this without a source or data behind it here, so there is nothing to check it against. The quote shows it is in the paper.
In the paper
“Adriamycin, commonly known as doxorubicin (Dox), has been used, in combinations with other drugs, to treat many different types of cancers, such as breast, lung, ovarian, and bladder cancers, as well as neuroblastoma, leukemia, Hodgkin's and non‐Hodgkin's lymphoma.”
§ Hyaluronic acid–doxorubicin nanoparticles for targeted treatment of colorectal cancer > INTRODUCTION
plain- Asserted: passes — The authors put it forward as true.
- Checkable: passes — It can be checked against evidence.
- Load-bearing: fails — The paper’s conclusions may not depend on it.
- Based: passes — The paper gives a reason why it holds.
Probably not a substantial claim. The paper’s conclusions may not depend on it.
A conclusion the paper draws from its own results — it cites no other source for it, so there is none to check. The quote shows it is in the paper.
In the paper
“This swelling is most likely due ascites, a pathological fluid accumulation within the peritoneal cavity that associated with colon cancer.”
§ Hyaluronic acid–doxorubicin nanoparticles for targeted treatment of colorectal cancer > RESULTS > Effect of Dox and HA‐Dox on early signs of chemical induced colon cancer
hedgedconditionaln = 6- Asserted: passes — The authors put it forward as true.
- Checkable: passes — It can be checked against evidence.
- Load-bearing: fails — The paper’s conclusions may not depend on it.
- Based: passes — The paper gives a reason why it holds.
Probably not a substantial claim. The paper’s conclusions may not depend on it.
The paper states this without a source or data behind it here, so there is nothing to check it against. The quote shows it is in the paper.
In the paper
“There have been studies that have shown that Dox induces apoptosis by activation of caspase 3 in cultured cardiomyocytes in vitro and rat cardiac ventricles in vivo.”
§ Hyaluronic acid–doxorubicin nanoparticles for targeted treatment of colorectal cancer > RESULTS > The effect of Dox and HA‐Dox on intestinal apoptosis in mice with chemical‐induced colon cancer
boosteddirect- Asserted: passes — The authors put it forward as true.
- Checkable: passes — It can be checked against evidence.
- Load-bearing: fails — The paper’s conclusions may not depend on it.
- Based: fails — The paper may give no reason why it holds.
Probably not a substantial claim. The paper’s conclusions may not depend on it. The paper may give no reason why it holds.
A conclusion the paper draws from its own results — it cites no other source for it, so there is none to check. The quote shows it is in the paper.
In the paper
“The negative zeta potential was likely due to the protonation of the hydroxyl groups of HA shells, which is favorable for dispersion of nanocomplexes in a biological‐relevant environment and the efficient intracellular translocation of therapeutic compounds.”
§ Hyaluronic acid–doxorubicin nanoparticles for targeted treatment of colorectal cancer > RESULTS > Characterization of HA‐Dox
hedgedconditional- Asserted: passes — The authors put it forward as true.
- Checkable: passes — It can be checked against evidence.
- Load-bearing: unclear — It is unclear whether the paper’s conclusions depend on it.
- Based: passes — The paper gives a reason why it holds.
It may state two separate claims as one.
In the paper
“Even in the presence of escape mechanisms associated with cancer progression, the ability of HA to slow cancer growth was unaffected.”
§ Hyaluronic acid–doxorubicin nanoparticles for targeted treatment of colorectal cancer > INTRODUCTION
What the sources say
- Not checked yetcites [78] Filino MC, Menard S, Filion B, Roy J, Reader S, Phillips NC. (2002). Anti‐cancer activity of hyaluronan, in Hyaluronan: Proceedings of an International Meeting, September 2000, North East Wales Institute, UK (eds. J.F. Kennedy, G.O. Phillips, P.A. Williams, V.C. Hascall), WoodheadPublishing Ltd., Cambridge, pp. 419–427.
plain- Asserted: passes — The authors put it forward as true.
- Checkable: passes — It can be checked against evidence.
- Load-bearing: fails — The paper’s conclusions may not depend on it.
- Based: passes — The paper gives a reason why it holds.
Probably not a substantial claim. The paper’s conclusions may not depend on it.
None of the sources cited for this claim have been checked yet.
In the paper
“Anti‐inflammatory agents such as COX2 inhibitors, as well as iNOS inhibitors, suppress colorectal cancer by inhibiting inflammatory pathways.”
§ Hyaluronic acid–doxorubicin nanoparticles for targeted treatment of colorectal cancer > DISCUSSION
What the sources say
- Not checked yetcites [108] Sobolweski C, Cerella C, Dicato M, Ghibelli L, Diederich M. The role of cycoloxygenase‐2 in cell proliferation and cell death in human malignancies. Int J Cell Biol. 2010; 2010: 215158. 20339581 PMC2841246
- Not checked yetcites [109] Hanh E, Kaus S, Arber N. Role of cyclooxygenase‐2 in pathogenesis and prevention of colorectal cancer. Dig Dis. 2010; 28(4–5): 585‐ 589. 21088406
- Not checked — no full text of the sourcecites [110] Brown JR, DuBois RN. COX‐2: a molecular target for colorectal cancer prevention. J Clin Oncol. 2005; 23(12): 2840‐ 2855. 15837998 source
plaindirect- Asserted: passes — The authors put it forward as true.
- Checkable: passes — It can be checked against evidence.
- Load-bearing: fails — The paper’s conclusions may not depend on it.
- Based: passes — The paper gives a reason why it holds.
Probably not a substantial claim. The paper’s conclusions may not depend on it.
None of the sources cited for this claim have been checked yet.
In the paper
“COX‐2 inhibitors (e.g., rofexoxib, celecoxib, and valdecoxib), subclass of nonsteroidal anti‐inflammatory drugs, reduce the production of prostaglandins, chemical that promotes inflammation.”
§ Hyaluronic acid–doxorubicin nanoparticles for targeted treatment of colorectal cancer > DISCUSSION
What the sources say
- Not checked yetcites [114] Wang D, DuBois RN. The role of COX‐2 in intestinal inflammation and colorectal cancer. Oncogene. 2011; 29(6): 781‐ 788. PMC3181054 19946329 source
Checked before — its earlier verdict is held back until a new check runs.
- Not checked — no full text of the sourcecites [125] Grosch S, Maier TJ, Schiffmann S, Geisslinger G. Cyclooxygenase‐2 (COX‐2)‐independent anticarcinogenic effects of selective COX‐2 inhibitors. JNCI. 2006; 98(11): 736‐ 747. 16757698 source
- Not checked yetcites [126] Arber N. Cyclooxygenase‐2 inhibitors in colorectal cancer prevention: point. Cancer Epidermiol Biomarkers Prev. 2008; 17(8): 1852‐ 1857. 18708371
plaindirect- Asserted: passes — The authors put it forward as true.
- Checkable: passes — It can be checked against evidence.
- Load-bearing: fails — The paper’s conclusions may not depend on it.
- Based: passes — The paper gives a reason why it holds.
Probably not a substantial claim. The paper’s conclusions may not depend on it.
- Not checked yet
In the paper
“Mechanism of its action include either to promote the creation of a capsule from the connective tissue, resulting in the encompassing of the tumor, proteolytical activation of CD44, or binding to the cell membrane of the tumor cells.”
§ Hyaluronic acid–doxorubicin nanoparticles for targeted treatment of colorectal cancer > DISCUSSION
What the sources say
- Not matchedcites [96] Selyanin MA, Boykov PY, Khabarov VN, Polyak F. In: Selyanin MA, Boykov PY, Khabarov VN, Polyak F, eds. Hyaluronan in Oncology. Hyaluronic Acid, Preparation, Properties, Application in Biology and Medicine. Chichester, West Sussex, United Kingdom: Wiley; 2015: 176‐ 177.
Couldn’t be matched to a paper in Crossref, so it can’t be checked.
plaindirect- Asserted: passes — The authors put it forward as true.
- Checkable: passes — It can be checked against evidence.
- Load-bearing: fails — The paper’s conclusions may not depend on it.
- Based: passes — The paper gives a reason why it holds.
Probably not a substantial claim. The paper’s conclusions may not depend on it.
- Not matched
In the paper
“There have been studies that have shown that HA can act as inhibitor of tumor vascularization, tumor metastasis, cancer formation, and cancer growth.”
§ Hyaluronic acid–doxorubicin nanoparticles for targeted treatment of colorectal cancer > DISCUSSION
What the sources say
- Not matchedcites [96] Selyanin MA, Boykov PY, Khabarov VN, Polyak F. In: Selyanin MA, Boykov PY, Khabarov VN, Polyak F, eds. Hyaluronan in Oncology. Hyaluronic Acid, Preparation, Properties, Application in Biology and Medicine. Chichester, West Sussex, United Kingdom: Wiley; 2015: 176‐ 177.
Couldn’t be matched to a paper in Crossref, so it can’t be checked.
plaindirect- Asserted: passes — The authors put it forward as true.
- Checkable: passes — It can be checked against evidence.
- Load-bearing: fails — The paper’s conclusions may not depend on it.
- Based: passes — The paper gives a reason why it holds.
Probably not a substantial claim. The paper’s conclusions may not depend on it.
- Not matched
What the paper did — it cites no source for this, so there is none to check. The quote shows it is in the paper.
In the paper
“Considering this, in our study, it is unclear whether HA‐Dox induces apoptosis in the intestine due to the continuous shedding of the intestinal epithelium.”
§ Hyaluronic acid–doxorubicin nanoparticles for targeted treatment of colorectal cancer > DISCUSSION
hedged- Asserted: passes — The authors put it forward as true.
- Checkable: passes — It can be checked against evidence.
- Load-bearing: fails — The paper’s conclusions may not depend on it.
- Based: passes — The paper gives a reason why it holds.
Probably not a substantial claim. The paper’s conclusions may not depend on it.
A conclusion the paper draws from its own results — it cites no other source for it, so there is none to check. The quote shows it is in the paper.
In the paper
“This may play a role in the generation and turnover of epithelial cells.”
§ Hyaluronic acid–doxorubicin nanoparticles for targeted treatment of colorectal cancer > DISCUSSION
hedgedconditional- Asserted: passes — The authors put it forward as true.
- Checkable: passes — It can be checked against evidence.
- Load-bearing: fails — The paper’s conclusions may not depend on it.
- Based: fails — The paper may give no reason why it holds.
Probably not a substantial claim. The paper’s conclusions may not depend on it. The paper may give no reason why it holds.
A conclusion the paper draws from its own results — it cites no other source for it, so there is none to check. The quote shows it is in the paper.
In the paper
“The AlexaFluro647‐labeled HA and HA‐Dox found in the stomach could be potentially mediated by the fluorophore itself or interference from the food in the measurements.”
§ Hyaluronic acid–doxorubicin nanoparticles for targeted treatment of colorectal cancer > DISCUSSION
hedgedconditional- Asserted: passes — The authors put it forward as true.
- Checkable: passes — It can be checked against evidence.
- Load-bearing: fails — The paper’s conclusions may not depend on it.
- Based: fails — The paper may give no reason why it holds.
Probably not a substantial claim. The paper’s conclusions may not depend on it. The paper may give no reason why it holds. It may state two separate claims as one.
A conclusion the paper draws from its own results — it cites no other source for it, so there is none to check. The quote shows it is in the paper.
In the paper
“it is plausible that HA‐Dox traveled to the portal vein in the liver after administration and transcytosed through the hepatocytes and entered the bile duct into the duodenum of the small intestine, where we saw large accumulation.”
§ Hyaluronic acid–doxorubicin nanoparticles for targeted treatment of colorectal cancer > DISCUSSION
hedgedconditional- Asserted: passes — The authors put it forward as true.
- Checkable: passes — It can be checked against evidence.
- Load-bearing: unclear — It is unclear whether the paper’s conclusions depend on it.
- Based: passes — The paper gives a reason why it holds.
It may state two separate claims as one.
In the paper
“Mechanism of its action include either to promote the creation of a capsule from the connective tissue, resulting in the encompassing of the tumor, proteolytical activation of CD44, or binding to the cell membrane of the tumor cells.”
§ Hyaluronic acid–doxorubicin nanoparticles for targeted treatment of colorectal cancer > DISCUSSION
What the sources say
- Not matchedcites [96] Selyanin MA, Boykov PY, Khabarov VN, Polyak F. In: Selyanin MA, Boykov PY, Khabarov VN, Polyak F, eds. Hyaluronan in Oncology. Hyaluronic Acid, Preparation, Properties, Application in Biology and Medicine. Chichester, West Sussex, United Kingdom: Wiley; 2015: 176‐ 177.
Couldn’t be matched to a paper in Crossref, so it can’t be checked.
plaindirect- Asserted: passes — The authors put it forward as true.
- Checkable: passes — It can be checked against evidence.
- Load-bearing: fails — The paper’s conclusions may not depend on it.
- Based: passes — The paper gives a reason why it holds.
Probably not a substantial claim. The paper’s conclusions may not depend on it.
- Not matched
None of the sources cited for this claim have been checked yet.
In the paper
“There is evidence that a link between inflammation and colorectal cancer exists.”
§ Hyaluronic acid–doxorubicin nanoparticles for targeted treatment of colorectal cancer > DISCUSSION
What the sources say
- Not checked — no full text of the sourcecites [97] Janakiram NB, Rao CV. The role of inflammation in colon cancer. Adv Exp Med Biol. 2014; 816: 25‐ 52. 24818718 source
- Not checked — no full text of the sourcecites [98] Terzic J, Grivennikov S, Karin E, Karin M. Inflammation and colon cancer. Gastroenterology. 2010; 138(6): 2101‐ 2114. 20420949 source
- Not checked yetcites [99] Azer SA. Overview of molecular pathways in inflammatory bowel disease associated with colorectal cancer development. Eur J Gastroenterol Hepatol. 2013; 25(3): 271‐ 281. 23169309
plaincorrelational- Asserted: passes — The authors put it forward as true.
- Checkable: passes — It can be checked against evidence.
- Load-bearing: fails — The paper’s conclusions may not depend on it.
- Based: passes — The paper gives a reason why it holds.
Probably not a substantial claim. The paper’s conclusions may not depend on it.
None of the sources cited for this claim have been checked yet.
In the paper
“Currently, therapies to treat IBD diminish the mucosal inflammatory response.”
§ Hyaluronic acid–doxorubicin nanoparticles for targeted treatment of colorectal cancer > DISCUSSION
What the sources say
- Not checked yetcites [138] Axelrad JE, Lichtiger S, Yajnik V. Inflammatory bowel disease and cancer: the role of inflammation, immunosuppression, and cancer treatment. World J Gastroenterol. 2016; 22(20): 4794‐ 4801. 27239106 PMC4873872 source
Checked before — its earlier verdict is held back until a new check runs.
plaindirect- Asserted: passes — The authors put it forward as true.
- Checkable: passes — It can be checked against evidence.
- Load-bearing: fails — The paper’s conclusions may not depend on it.
- Based: passes — The paper gives a reason why it holds.
Probably not a substantial claim. The paper’s conclusions may not depend on it.
- Not checked yet
In the paper
“Mechanism of its action include either to promote the creation of a capsule from the connective tissue, resulting in the encompassing of the tumor, proteolytical activation of CD44, or binding to the cell membrane of the tumor cells.”
§ Hyaluronic acid–doxorubicin nanoparticles for targeted treatment of colorectal cancer > DISCUSSION
What the sources say
- Not matchedcites [96] Selyanin MA, Boykov PY, Khabarov VN, Polyak F. In: Selyanin MA, Boykov PY, Khabarov VN, Polyak F, eds. Hyaluronan in Oncology. Hyaluronic Acid, Preparation, Properties, Application in Biology and Medicine. Chichester, West Sussex, United Kingdom: Wiley; 2015: 176‐ 177.
Couldn’t be matched to a paper in Crossref, so it can’t be checked.
plaindirect- Asserted: passes — The authors put it forward as true.
- Checkable: passes — It can be checked against evidence.
- Load-bearing: fails — The paper’s conclusions may not depend on it.
- Based: passes — The paper gives a reason why it holds.
Probably not a substantial claim. The paper’s conclusions may not depend on it.
- Not matched
A conclusion the paper draws from its own results — it cites no other source for it, so there is none to check. The quote shows it is in the paper.
In the paper
“Our findings suggest HA‐Dox lowers inflammation levels in all parts of the intestine, stopping the further development of CRC.”
§ Hyaluronic acid–doxorubicin nanoparticles for targeted treatment of colorectal cancer > DISCUSSION
hedgeddirect- Asserted: passes — The authors put it forward as true.
- Checkable: passes — It can be checked against evidence.
- Load-bearing: passes — The paper’s conclusions depend on it.
- Based: passes — The paper gives a reason why it holds.
It may state two separate claims as one.
- Rests on an assumption: Lowering inflammation levels in the intestine stops the further development of colorectal cancer.
None of the sources cited for this claim have been checked yet.
In the paper
“There has been evidence over the decade that show a link between chronic intestinal inflammation and CRC thorough a series of events; from the development of early dysplasia to low grade dysplasia to high‐grade dysplasia to eventually converting to invasive adenocarcinoma.”
§ Hyaluronic acid–doxorubicin nanoparticles for targeted treatment of colorectal cancer > DISCUSSION
What the sources say
- Not checked yetcites [137] Lukas M. Inflammatory bowel disease as a risk factor for colorectal cancer. Dig Dis. 2010; 28(4–5): 619‐ 624. 21088413
- Not checked yetcites [138] Axelrad JE, Lichtiger S, Yajnik V. Inflammatory bowel disease and cancer: the role of inflammation, immunosuppression, and cancer treatment. World J Gastroenterol. 2016; 22(20): 4794‐ 4801. 27239106 PMC4873872 source
Checked before — its earlier verdict is held back until a new check runs.
- Not checked yetcites [139] Kim ER, Chang DK. Colorectal cancer in inflammatory bowel disease: the risk, pathogenesis, prevention, and diagnosis. World J Gastroenterol. 2014; 20(29): 9872‐ 9881. 25110418 PMC4123369 source
Checked before — its earlier verdict is held back until a new check runs.
plaincorrelational- Asserted: passes — The authors put it forward as true.
- Checkable: passes — It can be checked against evidence.
- Load-bearing: fails — The paper’s conclusions may not depend on it.
- Based: passes — The paper gives a reason why it holds.
Probably not a substantial claim. The paper’s conclusions may not depend on it.
The paper states this without a source or data behind it here, so there is nothing to check it against. The quote shows it is in the paper.
In the paper
“CD44 is normally expressed in lower crypt epithelium of the intestinal mucosa, localized to the basolateral membrane of the cells.”
§ Hyaluronic acid–doxorubicin nanoparticles for targeted treatment of colorectal cancer > DISCUSSION
plain- Asserted: passes — The authors put it forward as true.
- Checkable: passes — It can be checked against evidence.
- Load-bearing: unclear — It is unclear whether the paper’s conclusions depend on it.
- Based: passes — The paper gives a reason why it holds.
It may state two separate claims as one.
None of the sources cited for this claim have been checked yet.
In the paper
“Many studies have shown that pro‐inflammatory mediators such as cyclooxygenase‐2 (COX‐2) and lipoxygenase pathways may lead to tumor cell proliferation, growth, thus promoting colorectal cancers.”
§ Hyaluronic acid–doxorubicin nanoparticles for targeted treatment of colorectal cancer > DISCUSSION
hedgedconditional- Asserted: passes — The authors put it forward as true.
- Checkable: passes — It can be checked against evidence.
- Load-bearing: fails — The paper’s conclusions may not depend on it.
- Based: passes — The paper gives a reason why it holds.
Probably not a substantial claim. The paper’s conclusions may not depend on it.
The paper relies on this without support.
There have been no reports of free Dox injected intravenously treating colorectal cancers.
“To our knowledge, there have been no reports of free Dox, injected intravenously, treating colorectal cancers.”
The paper relies on this without support.
Hyaluronic acid by itself has a blood half-life of 3–5 min in the blood.
“Hyaluronic acid by itself has a blood half‐life of 3–5 min in the blood.”
The paper relies on this without support.
There have been no reports of free Dox or any Dox complexes accumulating in the intestines via intravenous injection.
“To our knowledge, there have been no reports of free Dox or any Dox complexes accumulating in the intestines via intravenous injection.”
The paper relies on this without support.
There are no reports of the use of doxorubicin to intestinal and colon cancers.
“However, there are no reports of the use of doxorubicin to intestinal and colon cancers.”
The paper relies on this without support.
Doxorubicin undergoes acid hydrolysis in the stomach and any remaining doxorubicin reaching the intestine is discharged by P-glycoprotein, found in the epithelial cells lining the small intestine and colon.
“Doxorubicin undergoes acid hydrolysis in the stomach and any remaining doxorubicin reaching the intestine is discharged by P‐glycoprotein, found in the epithelial cells lining the small intestine and colon.”
The paper relies on this without support.
The AOM/DSS mouse model is predictive of human IBD-associated colorectal cancer for evaluating HA-Dox efficacy.
“In conclusion, our study revealed that HA‐Dox may be an effective therapeutic agent to prevent or reduce the risk of colorectal cancer development, particularly for people who already suffer from IBD.”
The paper relies on this without support.
Lowering inflammation levels in the intestine stops the further development of colorectal cancer.
“Our findings suggest HA‐Dox lowers inflammation levels in all parts of the intestine, stopping the further development of CRC.”
The paper relies on this without support.
The accumulation and therapeutic effects of HA-Dox in intestinal tissues are enhanced by increased blood flow and vascular permeability in inflammatory bowel disease.
“The accumulation and therapeutic effects of HA‐Dox in the intestinal tissues are probably enhanced by both an increase in blood flow and in vascular permeability; both being well documented in inflammatory bowel disease (IBD).”
The paper relies on this without support.
Doxorubicin slows or stops cancer growth by blocking topoisomerase 2.
“Dox slows or stops the growth of cancer by blocking topoisomerase 2.”
Self-check
Percentages, sums and reported differences re-computed from the paper’s own numbers.
Each contradiction between two passages listed here was confirmed by an independent check.
Rated minor: it would not touch a result — a value no result rests on, a p-value that stays on the same side of the significance level, or a conflict that is clerical, resolved elsewhere in the paper, or outside its own findings.
In the paper
§ Hyaluronic acid–doxorubicin nanoparticles for targeted treatment of colorectal cancer > RESULTS > Biodistribution of HA‐Dox
“Similar to HA‐AlexaFluro647, strong signal was observed in the stomach for HA‐Dox‐AlexaFluro647 and low signal were observed in the cecum and colon at both time points.”
§ Hyaluronic acid–doxorubicin nanoparticles for targeted treatment of colorectal cancer > RESULTS > Biodistribution of HA‐Dox
“At 0.5 h post injection, however, stronger signal was detected in the duodenum and the beginning of the jejunum and no signal was detected in the ileum, cecum, or colon (Figure S5b).”
Cited works that were retracted
Works this paper cites that were later retracted, from the retraction notices publishers deposit. Major when the notice came out before this paper was published.
Rated major: it would touch a result — a value a result rests on, reported and recomputed p-values on opposite sides of the significance level, two passages that conflict with no sign which is right, or a cited work retracted before this paper was published.
In the paper
“10.1159/000320276”
Cited work 10.1159/000320276 · retracted 2010-11-18 · notice 10.1159/000539915 · this paper published 2020-05-28
Citations
Cites
1 retracted
Inflammatory Bowel Disease as a Risk Factor for Colorectal Cancer
Lukáš, M. (2010) · Digestive Diseases · doi:10.1159/000320276 · Cited by 99
RetractedSiegel, R. L., Miller, K. D., & Jemal, A. (2019) · CA: A Cancer Journal for Clinicians · doi:10.3322/caac.21551 · Cited by 20,160
5-Fluorouracil: mechanisms of action and clinical strategies
Longley, D. B., Harkin, D. P., & Johnston, P. G. (2003) · Nature Reviews Cancer · doi:10.1038/nrc1074 · Cited by 5,332
Oxaliplatin, Fluorouracil, and Leucovorin as Adjuvant Treatment for Colon Cancer
André, T., Boni, C., Mounedji-Boudiaf, L., Navarro, M., Tabernero, J. M., Hickish, T., Topham, C., Zaninelli, M., Clingan, P. R., Bridgewater, J. A., et al. (2004) · New England Journal of Medicine · doi:10.1056/nejmoa032709 · Cited by 3,694
Douillard, J., Cunningham, D., Roth, A., Navarro, M., James, R., Karasek, P., Jandik, P., Iveson, T., Carmichael, J., Alakl, M., et al. (2000) · The Lancet · doi:10.1016/s0140-6736(00)02034-1 · Cited by 3,256
Irinotecan plus Fluorouracil and Leucovorin for Metastatic Colorectal Cancer
Saltz, L. B., Cox, J. V., Blanke, C. D., Rosen, L. S., Fehrenbacher, L., Moore, M. J., Maroun, J. A., Ackland, S. P., Locker, P. K., Pirotta, N., et al. (2000) · New England Journal of Medicine · doi:10.1056/nejm200009283431302 · Cited by 3,004
Goldberg, R. M., Sargent, D. J., Morton, R. F., Fuchs, C. S., Ramanathan, R. K., Williamson, S. K., Findlay, B., Pitot, H. C., & Alberts, S. R. (2003) · Journal of Clinical Oncology · doi:10.1200/jco.2004.09.046 · Cited by 2,251
Terzić, J., Grivennikov, S., Karin, E., & Karin, M. (2010) · Gastroenterology · doi:10.1053/j.gastro.2010.01.058 · Cited by 1,974
Randomized Trial of TAS-102 for Refractory Metastatic Colorectal Cancer
Mayer, R. J., Van Cutsem, E., Falcone, A., Yoshino, T., Garcia-Carbonero, R., Mizunuma, N., Yamazaki, K., Shimada, Y., Tabernero, J., Komatsu, Y., et al. (2015) · New England Journal of Medicine · doi:10.1056/nejmoa1414325 · Cited by 1,431
Nanoparticle–liver interactions: Cellular uptake and hepatobiliary elimination
Zhang, Y.-N., Poon, W., Tavares, A. J., McGilvray, I. D., & Chan, W. C. W. (2016) · Journal of Controlled Release · doi:10.1016/j.jconrel.2016.01.020 · Cited by 1,388
Cited by
Sorted by citations
Hyaluronic Acid‐Based Bioconjugate Systems, Scaffolds, and Their Therapeutic Potential
Kotla, N. G., Isa, I. L. M., Larrañaga, A., Maddiboyina, B., Swamy, S. K., Sivaraman, G., & Vemula, P. K. (2023) · Advanced Healthcare Materials · doi:10.1002/adhm.202203104 · Cited by 96
Wang, K., Shen, R., Meng, T., Hu, F., & Yuan, H. (2022) · Molecules · doi:10.3390/molecules27092981 · Cited by 70
Almeida, A., Castro, F., Resende, C., Lúcio, M., Schwartz, S., & Sarmento, B. F. C. C. (2022) · Journal of Controlled Release · doi:10.1016/j.jconrel.2022.07.029 · Cited by 70
Mohamed, R. A., Ali, S. M., Ahmed, I. S., Rawas‐Qalaji, M., & Hussain, Z. (2025) · Biomaterials Science · doi:10.1039/d5bm01176k · Cited by 63
Yang, P., Lu, Y., Gou, W., Qin, Y., Tan, J., Luo, G., & Zhang, Q. (2023) · Advanced Science · doi:10.1002/advs.202305918 · Cited by 58
Rezaei, T., Rezaei, M., Karimifard, S., Beram, F. M., Dakkali, M. S., Heydari, M., Afshari-Behbahanizadeh, S., Mostafavi, E., Bokov, D. O., Ansari, M. J., et al. (2022) · Frontiers in Pharmacology · doi:10.3389/fphar.2022.851242 · Cited by 57
Malfanti, A., Catania, G., Degros, Q., Wang, M., Bausart, M., & Véronique Préat, A. (2022) · Pharmaceutics · doi:10.3390/pharmaceutics14010124 · Cited by 44
Lin, J., Jia, S., Cao, F., Huang, J., Chen, J., Wang, J., Liu, P., Zeng, H., Zhang, X., & Cui, W. (2024) · Advanced Functional Materials · doi:10.1002/adfm.202400585 · Cited by 42
Applications and advancements of polysaccharide-based nanostructures for enhanced drug delivery
Kareemi, A. F., & Likhitkar, S. (2024) · Colloids and Surfaces B Biointerfaces · doi:10.1016/j.colsurfb.2024.113883 · Cited by 34
Noreen, S., Maqbool, I., Saleem, A., Mahmood, H., & Rai, N. (2025) · Critical Reviews in Oncology/Hematology · doi:10.1016/j.critrevonc.2025.104646 · Cited by 31
Siddiqui, L., Hasan, N., Mishra, P. K., Gupta, N., Singh, A. T., Madaan, A., Jaggi, M., Saad, S., Ekielski, A., Iqbal, Z., et al. (2023) · International Journal of Pharmaceutics · doi:10.1016/j.ijpharm.2023.123270 · Cited by 28
Prakash, S., Kumbhojkar, N., Clegg, J. R., & Mitragotri, S. (2020) · Current Opinion in Colloid & Interface Science · doi:10.1016/j.cocis.2020.101408 · Cited by 27
Self-citationFakhri, S., Moradi, S. Z., Faraji, F., Farhadi, T., Hesami, O., Iranpanah, A., Webber, K. J., & Bishayee, A. (2023) · Cancer and Metastasis Reviews · doi:10.1007/s10555-023-10119-w · Cited by 24
Ginghină, O., Hudiță, A., Zaharia, C., Tsatsakis, A. M., Mezhuev, Y. O., Costache, M., & Gălățeanu, B. (2021) · Materials · doi:10.3390/ma14092440 · Cited by 24
Duan, S., Sun, F., Qiao, P., Zhu, Z., Geng, M., Gong, X., Li, Y., & Yao, H. (2023) · ACS Biomaterials Science & Engineering · doi:10.1021/acsbiomaterials.2c01179 · Cited by 23
Zhang, B., Li, N., Gao, J., Zhao, Y., Jiang, J., Xie, S., Zhang, C., Zhang, Q., Liu, L., Wang, Z., et al. (2024) · Journal of Experimental & Clinical Cancer Research · doi:10.1186/s13046-024-02974-4 · Cited by 23
Mohajeri, S., Moayedi, S., Mohajeri, S., Yadegar, A., & Haririan, I. (2022) · Frontiers in Pharmacology · doi:10.3389/fphar.2022.1045575 · Cited by 22
Long, C., Peng, H., Yang, W., Wang, M., Luo, B., Hao, J., Dong, Y., & Zuo, W. (2024) · ACS Omega · doi:10.1021/acsomega.3c09751 · Cited by 18
Myat, Y. Y., Ngawhirunpat, T., Rojanarata, T., Opanasopit, P., Bradley, M., Patrojanasophon, P., & Pornpitchanarong, C. (2022) · Pharmaceutics · doi:10.3390/pharmaceutics14030479 · Cited by 17
Wang, Y., Xie, K., Chen, W., Fang, Y., Mo, Q., Zhang, H., Zhao, X., Li, D., Tan, W., Zhao, P., et al. (2023) · Bioengineering & Translational Medicine · doi:10.1002/btm2.10515 · Cited by 15
Functionalised Ligand-Based Nanomaterial Drug Targeting Approaches for Colorectal Cancer Therapy
Dixit, A. A., Mandlik, D. S., & Mandlik, S. K. (2024) · Recent Advances in Drug Delivery and Formulation · doi:10.2174/0126673878301004240703073107 · Cited by 14
Advancements in Hyaluronic Acid Synthetic Methodologies and Their Translational Relevance
Sockett, K. A., Jiang, N., Ungolan, P., Niu, J., & Grinstaff, M. W. (2026) · Chemical Reviews · doi:10.1021/acs.chemrev.5c00790 · Cited by 13
Recent advances in nanomaterial-based precision medicine for orthotopic tumor therapy
Luo, M. H., Zhao, F. K., Ouyang, C.-H., Wang, Y.-M., Luo, Y., & Bian, J. (2026) · Journal of Nanobiotechnology · doi:10.1186/s12951-026-04056-3 · Cited by 10
Abbasi, Y. F., Wu, L., Guo, X., Das, P., Bera, H., & Yang, M. (2025) · Carbohydrate Polymers · doi:10.1016/j.carbpol.2025.124654 · Cited by 6
Targeted Nanoparticles: the Smart Way for the Treatment of Colorectal Cancer
Abdellatif, A. A. H., Alshubrumi, A. S., & Younis, M. A. (2024) · AAPS PharmSciTech · doi:10.1208/s12249-024-02734-9 · Cited by 6
Recent advances in glyco-nanoparticles for probing the glyco-codes of cancer
Ullah, A. K. M. A., & Huang, X. (2025) · Carbohydrate Research · doi:10.1016/j.carres.2025.109757 · Cited by 3
Wang, Q., Liu, Z., & Jin, K. (2026) · International Journal of Nanomedicine · doi:10.2147/ijn.s581940 · Cited by 3
Liao, W., Long, J., Li, Y., Xie, F., Xun, Z., Wang, Y., Yang, X., Wang, Y., Zhou, K., Sang, X., et al. (2022) · Frontiers in Cell and Developmental Biology · doi:10.3389/fcell.2022.910749 · Cited by 3
Liu, C., Wang, L., Huai, J., He, S., Su, Q., Min, Q., & An, Z. (2025) · Mediators of Inflammation · doi:10.1155/mi/6267309 · Cited by 2
Nanoparticles for colorectal cancer therapy: A review
Yang, C.-W., Fang, H.-M., Gong, X.-Y., Wang, J., & Zou, T. (2026) · Biomaterials Advances · doi:10.1016/j.bioadv.2026.214926 · Cited by 2
Kožik, B., Čorbo, T., Pojskić, N., Božović, A., Todorović, L., Kolaković, A., Mandušić, V., & Pojskić, L. (2025) · International Journal of Molecular Sciences · doi:10.3390/ijms26136261 · Cited by 1
HCT116 cell line heterogeneity: A useful tool for preclinical research
Grigoreva, T. A., Sagaidak, A. V., Kindt, D. N., Zenina, A. D., Romanova, A. A., Ivanov, G. S., Yakovleva, T. K., Турилова, В. И., & Tribulovich, V. G. (2025) · Chemico-Biological Interactions · doi:10.1016/j.cbi.2025.111790 · Cited by 1
Emara, H. M., Youness, R. A., Manie, T., Abdelnaser, A., & Allam, N. K. (2026) · Nanoscale Advances · doi:10.1039/d5na01082a · Cited by 1
Importance of Nanocarriers in Colon Cancer
Srivastava, N., Mishra, Y., & Mishra, V. K. (2023) · BENTHAM SCIENCE PUBLISHERS eBooks · doi:10.2174/9789815080506123010011 · Cited by 1
Advancements in formulations and technologies for colon-targeted drug delivery
Rana, R. S., Ale, Y., Pant, P., Kukreti, N., & Jakhmola, V. (2025) · Journal of Applied Pharmaceutical Research · doi:10.69857/joapr.v13i2.825
Zhang, B., Li, N., Gao, J., Zhao, Y., Jiang, J., Xie, S., Zhang, C., Zhang, Q., Liu, L., Wang, Z., et al. (2024) · Figshare · doi:10.6084/m9.figshare.26682484
Devi, L. S., Morelli, M. B., Amantini, C., Gigliobianco, M. R., Ma, Q., Martino, P. D., Casadidio, C., & Censi, R. (2026) · ACS Applied Bio Materials · doi:10.1021/acsabm.5c02196
Hermawan, F., Puspitasari, A. D., Marlina, L. A., Yudha, E., Fatmasari, N., Hastuti, L. P., & Vifta, R. L. (2026) · Asian Pacific Journal of Cancer Prevention · doi:10.31557/apjcp.2026.27.4.1265
Rodella, G., Pesce, C., Rampado, R., Garofalo, M., Wang, M., Učakar, B., Vanvarenberg, K., Ma, Z., Joudiou, N., Véronique Préat, A., et al. (2026) · Materials Today Bio · doi:10.1016/j.mtbio.2026.103142
Preparation and Characterization of Hyaluronic Acid-Functionalized Zinc Ferrite Nanoparticles
Alshekh, Y., Halabi, A., & Kenan, U. T. K. U. (2025) · Research Journal of Idlib University · doi:10.66247/taq3px86
Yan, Y., Shi, J., Zheng, Z., Shi, X., & Zhao, X. (2026) · European Journal of Pharmaceutics and Biopharmaceutics · doi:10.1016/j.ejpb.2026.115143
Santos, A. O., Checca, N. R., Soares, A. V. H., de Almeida, F. B., Alves, O. C., Xing, Y. T., & Silva, J. C. M. (2026) · Materials Chemistry and Physics · doi:10.1016/j.matchemphys.2026.132873
Metadata
- Authors
- Pan, D. C., Krishnan, V., Salinas, A. K., Kim, J., Sun, T., Ravid, S., Peng, K., Wu, D., Nurunnabi, M., Nelson, J. A., Niziolek, Z., Guo, J., & Mitragotri, S.
- Affiliations
- Harvard University (US)
- Corresponding author
- Mitragotri, Samir
- ORCID
- Venue
- Bioengineering & Translational Medicine
- Publisher
- Wiley
- Published
- 2020-05-28
- Volume
- 6
- Issue
- 1
- Pages
- e10166-e10166
- ISSN
- 2380-6761 (ISSN-L)
- PMC
- PMC7823125
- OpenAlex
- W3024165904
- Cited by
- 42
- References
- 140
- Citations by year
- 2026: 10 · 2025: 9 · 2024: 7 · 2023: 7 · 2022: 7 · 2021: 1 · 2020: 1
- FWCI
- 0.97
- Type
- journal article
- Language
- en
- Open access
- gold
- doi.org
- Licence
- Locations
- Bioengineering & Translational Medicine (publishedVersion, cc-by)
- Europe PMC (PubMed Central) (publishedVersion, other-oa)
- PubMed (publishedVersion)
- PubMed Central (publishedVersion, cc-by)
- scholarworks - UTEP (The University of Texas at El Paso) (submittedVersion)
- DOAJ (DOAJ: Directory of Open Access Journals) (submittedVersion, cc-by-sa)
- Funders
- Harvard School of Engineering and Applied Sciences
- The National Cancer Institute (#2CA174650)
- Harvard University
- Topics
- Physical Sciences › Materials Science › Biomaterials › Nanoparticle-Based Drug Delivery
- Life Sciences › Pharmacology, Toxicology and Pharmaceutics › Pharmaceutical Science › Advanced Drug Delivery Systems
- Life Sciences › Biochemistry, Genetics and Molecular Biology › Cell Biology › Proteoglycans and glycosaminoglycans research
- Keywords
- hyaluronic acid, doxorubicin, nanoparticles, targeted drug delivery, colorectal cancer, intravenous injection, intestinal mucosal integrity, apoptosis, inflammation, chemotherapy side effects
About these checks
Registry, retraction, Cites and statistics results are computed, not judged, with one exception: a printed reference that no index lists is read once by a model before it counts as a citation error. Claims are extracted by a model and kept only when their quote appears verbatim in the text; each cited source is then checked, with a model’s help, for whether it says what the claim relies on. Those verdicts can be wrong — read the claim’s quote and the cited source before relying on one.
A language model drew the claims from the paper on 2026-11-10, under version 3 of the claim definition (model deepseek-v4.1-flash, prompt extract-v3).
A second model labelled each claim on 2026-11-10 (model jev-1.13-20260917, definition revision gold-guideline-v0.2).
Cited sources are checked with a language model’s help (gpt-6-sol).
Statistics and arithmetic are recomputed, not judged.
Confidence bands are shown only for fields calibrated on our annotated test set. None is calibrated yet, so no band is shown.
What counts as a claim ›How we measure confidence ›How we check this ›
Are you an author, or do you see a problem with this page? Request a review
