Cited by 5Entomopathogenic Microorganisms in Pest ControlInvertebrate Immune Response MechanismsPlant and Fungal Interactions Research

The DOI matches its Crossref record; 3 of the 3 references it cites were found in a registry or an index.

Insect hosts are nutritional landscapes navigated by fungal pathogens

Open access
De Fine Licht, Henrik H., Csontos, Zsuzsanna, Nielsen, Piet Jan Domela Nijegaard, Langkilde, Enzo Buhl, Kjærgård Hansen, August K., Shik, Jonathan Z.·2025·Ecology

Published version of a preprint

Abstract

Nutrition can mediate host–pathogen interactions indirectly when specific deficiencies (e.g., iron or glutamine) constrain host immune performance. Nutrition can also directly govern these interactions as invading pathogens colonize finite landscapes of nutritionally variable host tissues that must be optimally foraged during pathogen development. We first used a conceptual framework of nutritional niches to show that insect‐pathogenic Metarhizium fungi navigate host landscapes where different tissues vary widely in (protein [P] and carbohydrates [C]). We next tested whether host‐specific Metarhizium species have narrower fundamental nutritional niches (FNNs) than host‐generalists by measuring pathogen performance across an in vitro nutritional landscape simulating a within‐host foraging environment. We then tested how developing pathogens navigate nutritional landscapes by developing a liquid‐media approach to track pathogen intake of P and C over time. Host‐specificity did not govern FNN dimensions, as the three tested Metarhizium species: (1) grew maximally across C treatments assuming P was present above a lower threshold, and (2) similarly initiated dispersal behaviors and sporulated when either C or P became depleted. However, specialist and generalist pathogens navigated nutritional landscapes differently. The host specialist ( M. acridum ) first prioritized C intake, but generalists ( M. anisopliae , M. robertsii ) prioritized P and C according to their availability. The numbers of known hosts may be insufficient to delimit pathogens as specialists or generalists as diverse hosts do not necessarily comprise diverse nutritional landscapes. Instead, the immune responses of hosts and nutritional niche breadth of pathogens are likely co‐equal evolutionary drivers of host specificity.

Overview

The claims and statistics of this paper haven’t been checked yet.

Run the check — free, no account needed. It reads the open-access text and checks the sources it cites.

A few free checks a day · papers already verified open instantly · results are public

Integrity signals

Registry

Crossref · 10.1002/ecy.70015

Cites

3 of 3 references verified0 citation errors · 0 not checkable

Statistics

Figures

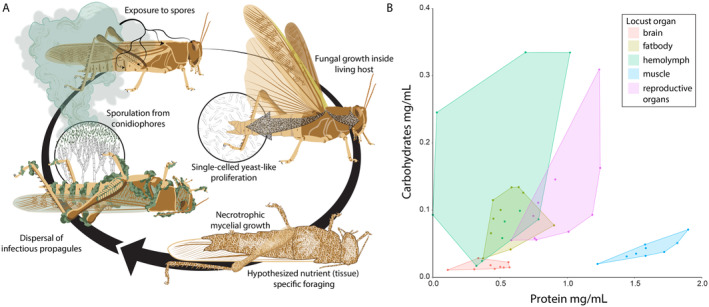
FIGURE 1 Visualizing a locust host as a landscape of nutritionally variable tissues foraged by developing Metarhizium fungal pathogens. (A) Infection starts after the locust is exposed to Metarhizium conidia that adhere to its cuticle. The conidia then germinate to form appressorial cells that penetrate the cuticle using mechanical forces and enzymatic degradation. Inside the body cavity, single‐celled ovoid hyphal bodies called blastospores obtain nutrients and proliferate throughout the hemolymph. After one to several days, the insect dies and Metarhizium switches to necrotrophic growth, which coincides with penetration of all body tissues. After accessible nutrients are depleted, the fungal pathogen initiates dispersal by producing green conidia that are visible emerging from the insect. (B) Protein and carbohydrate content of five different tissues of female locusts (Locusta migratoria) showing that the different tissues comprising the foraging landscape within the insect host contain different ratios and concentrations of protein and carbohydrates and thus provide opportunities for nutrient‐specific foraging and possibly niche partitioning among competing pathogen species. Each dot represents a different tissue sample from a different female locust individual. Illustration (A) by Damond Kyllo.
FIGURE 1 Visualizing a locust host as a landscape of nutritionally variable tissues foraged by developing Metarhizium fungal pathogens. (A) Infection starts after the locust is exposed to Metarhizium conidia that adhere to its cuticle. The conidia then germinate to form appressorial cells that penetrate the cuticle using mechanical forces and enzymatic degradation. Inside the body cavity, single‐celled ovoid hyphal bodies called blastospores obtain nutrients and proliferate throughout the hemolymph. After one to several days, the insect dies and Metarhizium switches to necrotrophic growth, which coincides with penetration of all body tissues. After accessible nutrients are depleted, the fungal pathogen initiates dispersal by producing green conidia that are visible emerging from the insect. (B) Protein and carbohydrate content of five different tissues of female locusts (Locusta migratoria) showing that the different tissues comprising the foraging landscape within the insect host contain different ratios and concentrations of protein and carbohydrates and thus provide opportunities for nutrient‐specific foraging and possibly niche partitioning among competing pathogen species. Each dot represents a different tissue sample from a different female locust individual. Illustration (A) by Damond Kyllo.CC BY · PubMed Central
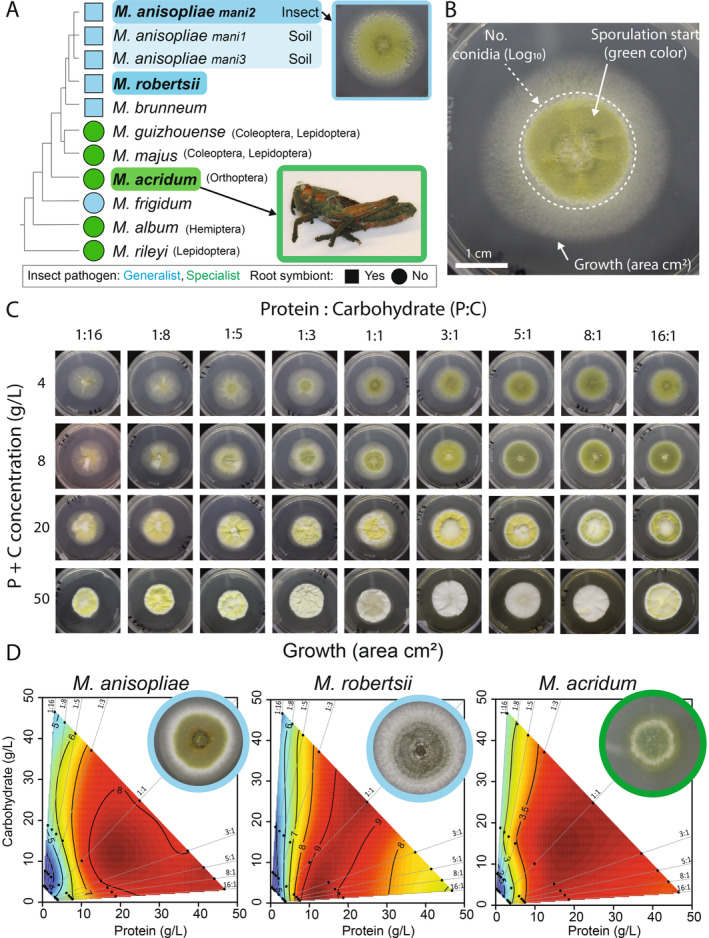
FIGURE 2 Linking host specificity with fundamental nutritional niche (FNN) breadth across species of Metarhizium pathogens. (A) We used a schematic phylogeny of the fungal genus Metarhizium to map host‐specificity and potential for free‐living existence in the plant rhizosphere. Species analyzed in the present study are marked in bold font. The species M. anisopliae is currently divided between three distinct phylogenetic groups where mani2 mostly infects insects while mani1 and mani3 are mostly isolated from soil. (B) An in vitro image of M. anisopliae (ESALQ1604) cultivated on a 1:1 protein:carbohydrate agar media at 4 g/L. The three performance traits measured to assess FNN dimensions were: Mycelial growth measured as the area (in square millimeters) of the mycelium, and reproductive effort measured in terms of total number of green conidia and the onset day of green coloration indicating the switch to reproduction (stippled‐line circle). (C) We quantified variation in pathogen performance across an in vitro nutritional landscape using FNNs. FNN heatmaps were based on measures of pathogen performance recorded across 36 nutritionally‐defined media treatments varying systematically in P:C ratios and P + C concentrations. (D) FNN heatmaps of fungal growth area (in square centimeters) are visualized for M. anisopliae, M. robertsii, and M. acridum using mean values of three isolates. Red colors indicate high growth values and blue color depicts low growth values. Statistical analyses used to support the interpretations of heatmaps are provided in Appendix S1: Table S1 (isolate‐level analyses) and Appendix S1: Table S2 (species‐level analyses). All Photos: Zsuzsanna Csontos.
FIGURE 2 Linking host specificity with fundamental nutritional niche (FNN) breadth across species of Metarhizium pathogens. (A) We used a schematic phylogeny of the fungal genus Metarhizium to map host‐specificity and potential for free‐living existence in the plant rhizosphere. Species analyzed in the present study are marked in bold font. The species M. anisopliae is currently divided between three distinct phylogenetic groups where mani2 mostly infects insects while mani1 and mani3 are mostly isolated from soil. (B) An in vitro image of M. anisopliae (ESALQ1604) cultivated on a 1:1 protein:carbohydrate agar media at 4 g/L. The three performance traits measured to assess FNN dimensions were: Mycelial growth measured as the area (in square millimeters) of the mycelium, and reproductive effort measured in terms of total number of green conidia and the onset day of green coloration indicating the switch to reproduction (stippled‐line circle). (C) We quantified variation in pathogen performance across an in vitro nutritional landscape using FNNs. FNN heatmaps were based on measures of pathogen performance recorded across 36 nutritionally‐defined media treatments varying systematically in P:C ratios and P + C concentrations. (D) FNN heatmaps of fungal growth area (in square centimeters) are visualized for M. anisopliae, M. robertsii, and M. acridum using mean values of three isolates. Red colors indicate high growth values and blue color depicts low growth values. Statistical analyses used to support the interpretations of heatmaps are provided in Appendix S1: Table S1 (isolate‐level analyses) and Appendix S1: Table S2 (species‐level analyses). All Photos: Zsuzsanna Csontos.CC BY · PubMed Central
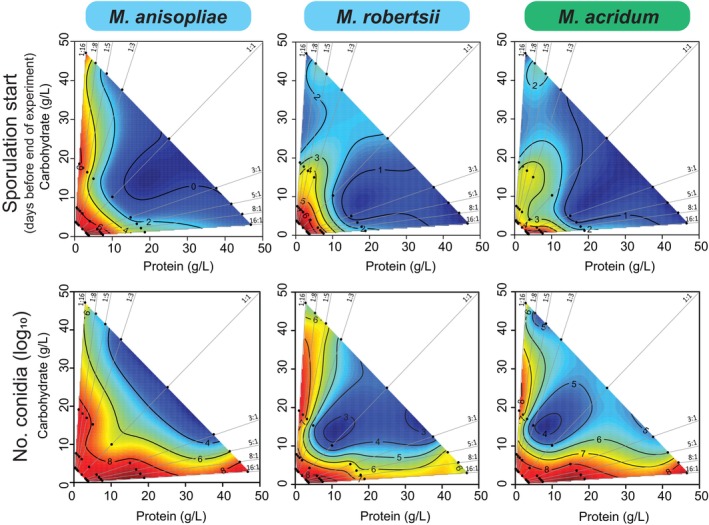
FIGURE 3 Comparing fundamental nutritional niches (FNNs) for reproductive effort traits across three species of Metarhizium. Heatmaps show how onset day of sporulation (top panel) and log10 (number of conidia) (bottom panel) vary across the 36 nutritionally‐defined media treatments (shown in Figure 2C) during the 11‐day experiment. The heatmaps show the average values of three isolates of each of the three species, and red heatmap color shows early sporulation (top panel) or high numbers of conidia (bottom panel), and blue heatmap color depicts low values of these traits. Statistical analyses used to support the interpretations of heatmaps are provided in Appendix S1: Table S1 (isolate‐level analyses) and Appendix S1: Table S2 (species‐level analyses).
FIGURE 3 Comparing fundamental nutritional niches (FNNs) for reproductive effort traits across three species of Metarhizium. Heatmaps show how onset day of sporulation (top panel) and log10 (number of conidia) (bottom panel) vary across the 36 nutritionally‐defined media treatments (shown in Figure 2C) during the 11‐day experiment. The heatmaps show the average values of three isolates of each of the three species, and red heatmap color shows early sporulation (top panel) or high numbers of conidia (bottom panel), and blue heatmap color depicts low values of these traits. Statistical analyses used to support the interpretations of heatmaps are provided in Appendix S1: Table S1 (isolate‐level analyses) and Appendix S1: Table S2 (species‐level analyses).CC BY · PubMed Central
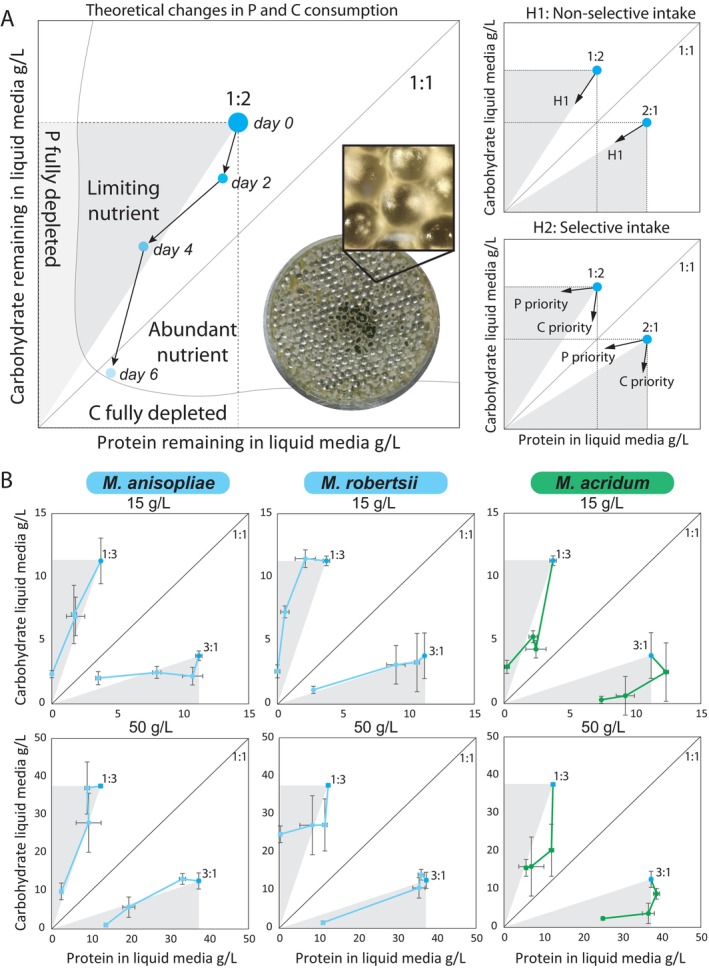
FIGURE 4 Comparing nutritional foraging strategies of generalist and specialist Metarhizium pathogens. (A) Nutrient foraging strategies were measured in vitro by measuring the amount of protein and carbohydrate remaining in nutritionally‐defined liquid media after two, four, and six days of fungal growth. As an example, we show fungal foraging from a 1:2 P:C starting point. The dashed line rectangle shows the nutritional geometric area available to the fungus for nutrient consumption. The gray triangle shows the limiting nutrient (P) and the white triangle shows the abundant nutrient (C). The nonselective intake hypothesis is illustrated by these diagonal segmented arrows showing that daily fungal P and C intake leads to the origin in the lower left corner. Here, P and C are both totally and passively depleted based only on their relative abundance in the 1:2 P:C growth media. In contrast, the selective intake hypothesis shows either horizontal arrows leading to the Y axis (selective P foraging) or vertical arrows leading to the X axis (selective C foraging). Here, intake is independent of the initial relative abundance of either nutrient in the growth media. Picture shows M. acridum growing in Petri dish filled with glass beads and liquid media with a close‐up showing how the glass beads support fungal growth. (B) Nutrient foraging in three species of Metarhizium measured in a factorial combination of P:C ratios (1:3, 3:1) and P + C concentrations (15 g/L in the top row, 50 g/L in the bottom row). Each individual dot is the mean ± SE of three measured replicates. All photos: Piet Jan Domela Nijegaard Nielsen and Enzo Buhl Langkilde.
FIGURE 4 Comparing nutritional foraging strategies of generalist and specialist Metarhizium pathogens. (A) Nutrient foraging strategies were measured in vitro by measuring the amount of protein and carbohydrate remaining in nutritionally‐defined liquid media after two, four, and six days of fungal growth. As an example, we show fungal foraging from a 1:2 P:C starting point. The dashed line rectangle shows the nutritional geometric area available to the fungus for nutrient consumption. The gray triangle shows the limiting nutrient (P) and the white triangle shows the abundant nutrient (C). The nonselective intake hypothesis is illustrated by these diagonal segmented arrows showing that daily fungal P and C intake leads to the origin in the lower left corner. Here, P and C are both totally and passively depleted based only on their relative abundance in the 1:2 P:C growth media. In contrast, the selective intake hypothesis shows either horizontal arrows leading to the Y axis (selective P foraging) or vertical arrows leading to the X axis (selective C foraging). Here, intake is independent of the initial relative abundance of either nutrient in the growth media. Picture shows M. acridum growing in Petri dish filled with glass beads and liquid media with a close‐up showing how the glass beads support fungal growth. (B) Nutrient foraging in three species of Metarhizium measured in a factorial combination of P:C ratios (1:3, 3:1) and P + C concentrations (15 g/L in the top row, 50 g/L in the bottom row). Each individual dot is the mean ± SE of three measured replicates. All photos: Piet Jan Domela Nijegaard Nielsen and Enzo Buhl Langkilde.CC BY · PubMed Central

Verification

Claims the paper makes

The claims and statistics of this paper haven’t been checked yet.

Run the check — free, no account needed. It reads the open-access text and checks the sources it cites.

A few free checks a day · papers already verified open instantly · results are public

Self-check

Percentages, sums and reported differences re-computed from the paper’s own numbers.

The self-check needs the paper’s full text.

Citations

Cites

Research works printed but not linked: 51

  1. 10.1016/j.jip.2011.04.004 · DOI
  2. 10.1146/annurev-ento-011613-162054 · DOI
  3. 10.1111/J.1365-2435.2010.01766.X · DOI
  4. 10.1111/2041-210X.13551 · DOI
  5. De Fine Licht H. H., 2024, Metarhizium Nutritional Map Data
  6. 10.1111/j.1574-6968.2006.00504.x · DOI
  7. 10.1641/0006-3568(2003)053[1112:BSAEPO]2.0.CO;2 · DOI
  8. 10.1038/nature02291 · DOI
  9. 10.1111/j.1365-2672.2009.04422.x · DOI
  10. Fox J., 2019, An R Companion to Applied Regression
  11. 10.1890/07-0389.1 · DOI
  12. 10.1038/cmi.2009.33 · DOI
  13. 10.4161/viru.1.6.12985 · DOI
  14. 10.1073/pnas.1406075111 · DOI
  15. 10.1152/physrev.00019.2004 · DOI
  16. 10.1016/j.jip.2008.02.017 · DOI
  17. 10.1046/J.1365-3059.1997.D01-224.X · DOI
  18. 10.1016/j.fbr.2021.01.002 · DOI
  19. 10.1046/J.1472-765X.2002.01128.X · DOI
  20. 10.1006/jipa.1999.4884 · DOI
  21. 10.1038/s42003-021-02925-1 · DOI
  22. 10.1006/JIPA.1995.1039 · DOI
  23. 10.1007/s00294-014-0447-9 · DOI
  24. 10.1016/j.simyco.2020.04.001 · DOI
  25. 10.1080/21505594.2017.1405190 · DOI
  26. 10.1111/j.1462-5822.2010.01529.x · DOI · Paper page
  27. Nychka D., 2021, Fields: Tools for Spatial Data. R
  28. 10.1098/rspb.2019.1220 · DOI
  29. 10.1242/jeb.245714 · DOI
  30. 10.1371/journal.ppat.1002223 · DOI
  31. 10.1016/j.jinsphys.2012.10.011 · DOI
  32. R Core Team, 2022, R: A Language and Environment for Statistical Computing
  33. 10.1073/pnas.1818371116 · DOI
  34. 10.1890/10-1707.1 · DOI
  35. 10.1016/0014-4894(57)90002-4 · DOI
  36. 10.3389/fmicb.2019.00854 · DOI
  37. 10.1111/J.1462-2920.2012.02736.X · DOI
  38. 10.1111/OIK.05418 · DOI
  39. 10.1016/j.femsle.2005.08.010 · DOI
  40. 10.1111/NPH.13722 · DOI · Paper page
  41. 10.1016/j.tree.2020.03.009 · DOI
  42. 10.1073/pnas.1606128113 · DOI
  43. 10.1038/s41559-020-01314-x · DOI
  44. 10.1111/ele.12140 · DOI
  45. 10.1093/icb/icm006 · DOI
  46. 10.1007/978-1-4615-2858-6_1 · DOI
  47. 10.1016/0169-5347(96)20067-9 · DOI
  48. 10.1890/1540-9295(2005)003[0268:HNAIDA]2.0.CO;2 · DOI
  49. 10.1098/rsob.200307 · DOI
  50. 10.3389/FMICB.2017.01281 · DOI
  51. 10.1111/j.1744-7917.2007.00153.x · DOI

Metadata

Authors
De Fine Licht, H. H., Csontos, Z., Nielsen, P. J. D. N., Langkilde, E. B., Kjærgård Hansen, A. K., & Shik, J. Z.
Affiliations
  • Section for Organismal Biology, Department of Plant and Environmental Sciences University of Copenhagen Frederiksberg Denmark
  • University of Copenhagen (DK)
Venue
Ecology
Publisher
Wiley
Published
2025-02
Volume
106
Issue
2
Pages
e70015-e70015
ISSN
  • 0012-9658 (ISSN-L)
  • 1939-9170
OpenAlex
W4407255124
Cited by
5
References
3
Citations by year
2026: 2 · 2025: 2
FWCI
2.99
Type
journal article
Language
en
Open access
Locations
  • Ecology (publishedVersion, cc-by)
  • bioRxiv (Cold Spring Harbor Laboratory) (acceptedVersion)
  • PubMed Central (publishedVersion, cc-by)
  • PubMed (publishedVersion)
  • Research at the University of Copenhagen (University of Copenhagen) (publishedVersion, cc-by)
Funders
Natur og Univers, Det Frie Forskningsråd (8049‐00086A)
Topics
  • Life Sciences › Agricultural and Biological Sciences › Insect Science › Entomopathogenic Microorganisms in Pest Control
  • Life Sciences › Immunology and Microbiology › Immunology › Invertebrate Immune Response Mechanisms
  • Life Sciences › Immunology and Microbiology › Virology › Plant and Fungal Interactions Research
Keywords
Metarhizium, entomopathogenic fungi, host-pathogen interaction, nutritional niche, host specificity, foraging behavior, Metarhizium acridum, Metarhizium anisopliae, Metarhizium robertsii, host immune response, fungal dispersal
MeSH terms
Animals, Insecta, Metarhizium, Host-Pathogen Interactions

About these checks

Registry, retraction, Cites and statistics results are computed, not judged, with one exception: a printed reference that no index lists is read once by a model before it counts as a citation error. Claims are extracted by a model and kept only when their quote appears verbatim in the text; each cited source is then checked, with a model’s help, for whether it says what the claim relies on. Those verdicts can be wrong — read the claim’s quote and the cited source before relying on one.

Statistics and arithmetic are recomputed, not judged.

Confidence bands are shown only for fields calibrated on our annotated test set. None is calibrated yet, so no band is shown.

What counts as a claim ›How we measure confidence ›How we check this ›

Are you an author, or do you see a problem with this page? Request a review