

The DOI matches its Crossref record; 64 of the 64 references it cites were found in a registry or an index.
Toll‐like receptor 4 is required for α‐synuclein dependent activation of microglia and astroglia
Open accessAbstract
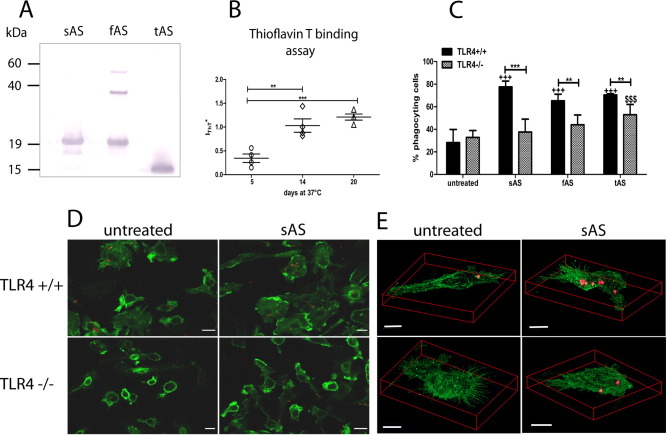
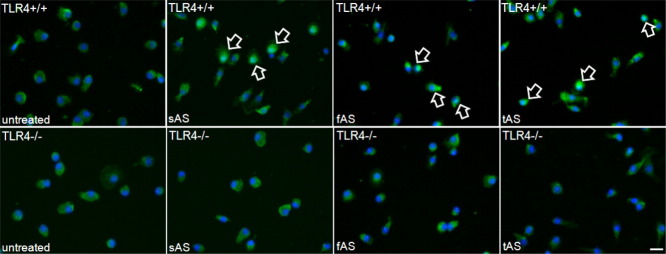
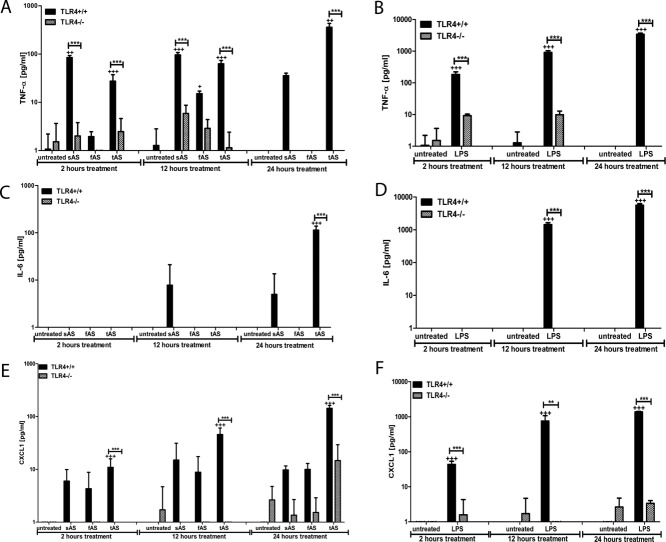
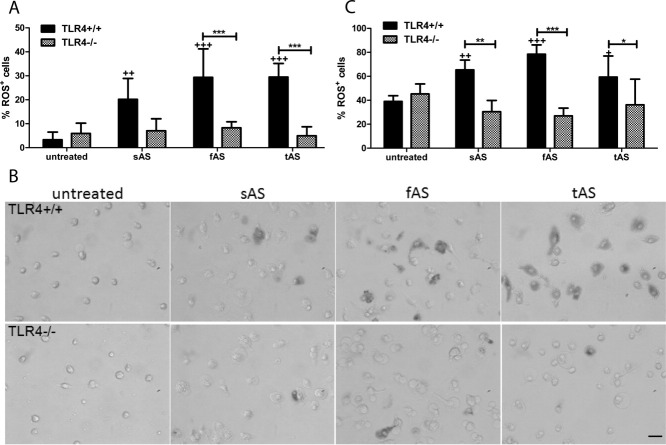
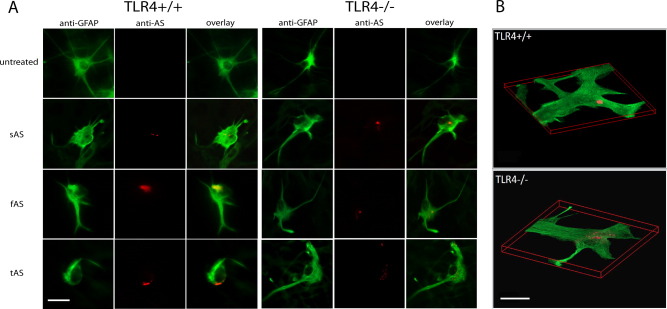
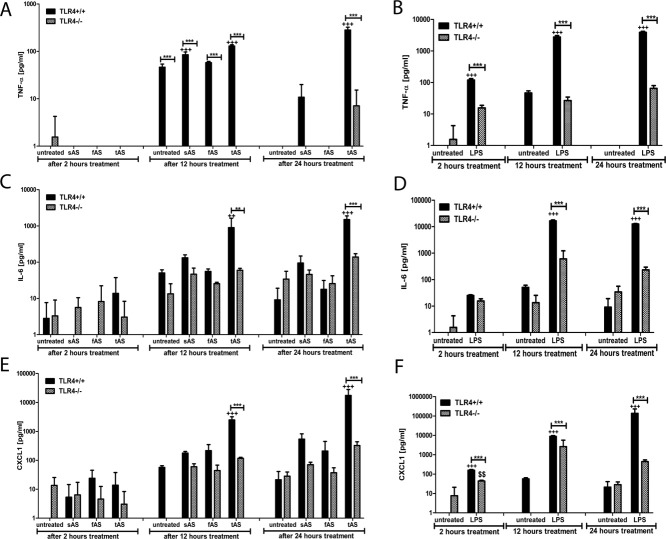
Alpha‐synucleinopathies (ASP) are neurodegenerative disorders, characterized by accumulation of misfolded α‐synuclein, selective neuronal loss, and extensive gliosis. It is accepted that microgliosis and astrogliosis contribute to the disease progression in ASP. Toll‐like receptors (TLRs) are expressed on cells of the innate immune system, including glia, and TLR4 dysregulation may play a role in ASP pathogenesis. In this study we aimed to define the involvement of TLR4 in microglial and astroglial activation induced by different forms of α‐synuclein (full length soluble, fibrillized, and C‐terminally truncated). Purified primary wild type (TLR4+/+) and TLR4 deficient (TLR4−/−) murine microglial and astroglial cell cultures were treated with recombinant α‐synuclein and phagocytic activity, NFκB nuclear translocation, cytokine release, and reactive oxygen species (ROS) production were measured. We show that TLR4 mediates α‐synuclein‐induced microglial phagocytic activity, pro‐inflammatory cytokine release, and ROS production. TLR4−/− astroglia present a suppressed pro‐inflammatory response and decreased ROS production triggered by α‐synuclein treatment. However, the uptake of α‐synuclein by primary astroglia is not dependent on TLR4 expression. Our results indicate the C‐terminally truncated form as the most potent inductor of TLR4‐dependent glial activation. The current findings suggest that TLR4 plays a modulatory role on glial pro‐inflammatory responses and ROS production triggered by α‐synuclein. In contrast to microglia, the uptake of alpha‐synuclein by astroglia is not dependent on TLR4. Our data provide novel insights into the mechanisms of α‐synuclein‐induced microglial and astroglial activation which may have an impact on understanding the pathogenesis of ASP. © 2012 Wiley Periodicals, Inc.
Overview
The claims and statistics of this paper haven’t been checked yet.
Run the check — free, no account needed. It reads the open-access text and checks the sources it cites.
Integrity signals
Registry
Cites
Statistics
Figures
Verification
Claims the paper makes
The claims and statistics of this paper haven’t been checked yet.
Run the check — free, no account needed. It reads the open-access text and checks the sources it cites.
Claims other papers make about this one
Each is checked against this paper’s own text: does it say what the citing paper says it does?
The source backs part of the claim, not all of it — or backs it for a different population, condition or comparison.
In the citing paper
“Previous reports showed α-synuclein can trigger TLR4 or TLR2 activation in cultured glia, which leads to an increase in inflammatory gene transcription19,40,41.”
From Microglia clear neuron-released α-synuclein via selective autophagy and prevent neurodegeneration (2020) · cites this paper as [40]
Experimental — accuracy not yet measuredThe cited source says what the claim attributes to it.
In the citing paper
“TLR4 was required for NF-κB activation, and increased inflammation and phagocytic activity in response to various forms of α-synuclein40,41,56.”
From Microglia clear neuron-released α-synuclein via selective autophagy and prevent neurodegeneration (2020) · cites this paper as [40]
The cited source says what the claim attributes to it.
In the citing paper
“TLR4 was required for NF-κB activation, and increased inflammation and phagocytic activity in response to various forms of α-synuclein40,41,56.”
From Microglia clear neuron-released α-synuclein via selective autophagy and prevent neurodegeneration (2020) · cites this paper as [40]
The cited source says what the claim attributes to it.
In the citing paper
“TLR4 was required for NF-κB activation, and increased inflammation and phagocytic activity in response to various forms of α-synuclein40,41,56.”
From Microglia clear neuron-released α-synuclein via selective autophagy and prevent neurodegeneration (2020) · cites this paper as [40]
The cited source says what the claim attributes to it.
In the citing paper
“For instance, α -synuclein aggregates induce microglial activation (Boza-Serrano et al., 2014) in a TLR-4 dependent manner (Fellner et al., 2013).”
From TET2 Regulates the Neuroinflammatory Response in Microglia (2019) · cites this paper as Fellner et al., 2013
In the citing paper
“Oligomeric α-syn directly engages TLR1/2 and TLR4 to induce a pro-inflammatory M1 phenotype.”
From Microglia in neurodegenerative diseases: mechanism and potential therapeutic targets (2023) · cites this paper as [246]
Self-check
Percentages, sums and reported differences re-computed from the paper’s own numbers.
The self-check needs the paper’s full text.
Citations
Cites
Resting microglial cells are highly dynamic surveillants of brain parenchyma in vivo
Nimmerjahn, A., Kirchhoff, F., & Helmchen, F. (2005) · Science · doi:10.1126/science.1110647 · Cited by 5,827
(1998) · Europe PMC (PubMed Central) · Cited by 1,594
Zhang, W., Wang, T., Pei, Z., Miller, D. S., Wu, X., Block, M. L., Wilson, B., Zhang, W., Zhou, Y., Hong, J.-S., et al. (2005) · The FASEB Journal · doi:10.1096/fj.04-2751com · Cited by 1,265
In vivo imaging of microglial activation with [11C](R)-PK11195 PET in idiopathic Parkinson's disease
Gerhard, A., Pavese, N., Hotton, G., Turkheimer, F., Es, M., Hammers, A., Eggert, K., Oertel, W., Banati, R. B., & Brooks, D. J. (2006) · Neurobiology of Disease · doi:10.1016/j.nbd.2005.08.002 · Cited by 1,200
Broad Expression of Toll-Like Receptors in the Human Central Nervous System
Bsibsi, M., Ravid, R., Gveric, D. O., & van Noort, J. M. (2002) · Journal of Neuropathology & Experimental Neurology · doi:10.1093/jnen/61.11.1013 · Cited by 1,000
Saijo, K., Winner, B., Carson, C. T., Collier, J. G., Boyer, L., Rosenfeld, M. G., Gage, F. H., & Glass, C. K. (2009) · Cell · doi:10.1016/j.cell.2009.01.038 · Cited by 957
Microglia as neuroprotective, immunocompetent cells of the CNS
Streit, W. J. (2002) · Glia · doi:10.1002/glia.10154 · Cited by 919
Lee, H.-J., Suk, J.-E., Patrick, C., Bae, E.-J., Cho, J.-H., Rho, S., Hwang, D., Masliah, E., & Lee, S.-J. (2010) · Journal of Biological Chemistry · doi:10.1074/jbc.m109.081125 · Cited by 877
Conway, K. A., Harper, J. D., & Lansbury, P. T. (2000) · Biochemistry · doi:10.1021/bi991447r · Cited by 786
The role of microglia and macrophages in the pathophysiology of the CNS
Stollg, G., & Jander, S. (1999) · Progress in Neurobiology · doi:10.1016/s0301-0082(98)00083-5 · Cited by 683
Cited by
Sorted by citations
Items 501–600 of 699
Toward disease modification in multiple system atrophy: Pitfalls, bottlenecks, and possible remedies
Krismer, F., Seppi, K., Stefanova, N., & Wenning, G. K. (2016) · Movement Disorders · doi:10.1002/mds.26517 · Cited by 9
Self-citationGuevara‐Salinas, A., Netzahualcoyotzi, C., Álvarez‐Luquín, D. D., Pérez‐Figueroa, E., Sevilla-Reyes, E. E., Castellanos‐Barba, C., Vega-Angeles, V. T., Terán‐Dávila, E., Estudillo, E., Velasco, I., et al. (2024) · CNS Neuroscience & Therapeutics · doi:10.1111/cns.14883 · Cited by 8
Microglia and Microbiome-Gut-Brain Axis
Filho, A. M. C., Gomes, N. S., Lós, D. B., Leite, I. B., Tremblay, M., & Macêdo, D. S. (2024) · Advances in neurobiology · doi:10.1007/978-3-031-55529-9_17 · Cited by 8
Microglial and neuronal fates following inhibition of CSF-1R in synucleinopathy mouse model
Iba, M., Lee, Y., Horan-Portelance, L., Chang, K., Szabo, M. P., Rissman, R. A., You, S., Masliah, E., & Kim, C. (2024) · Brain Behavior and Immunity · doi:10.1016/j.bbi.2024.09.016 · Cited by 9
Grünenwald, F., Huerta, T. J., Sepúlveda, D., Jerez, C., Urbina, V., Carrera, B., Díaz‐Espinoza, R., Nova, E., Pacheco, R., Martín‐Montañez, E., et al. (2025) · Aging Cell · doi:10.1111/acel.70020 · Cited by 12
Chakraborty, R., Maya, S., Testa, V., Montero-Muñoz, J., Nonaka, T., Hasegawa, M., Consiglio, A., & Zurzolo, C. (2026) · Nature Communications · doi:10.1038/s41467-026-73136-7 · Cited by 10
The role of autophagy in synucleinopathy: clearance versus spread of α-synuclein
Birnbaum, E., & Yue, Z. (2025) · Autophagy Reports · doi:10.1080/27694127.2025.2577406 · Cited by 10
Sterile innate immune mechanisms in neurodegenerative diseases
Ealy, A., Serapiglia, A. M., & Panicker, N. (2025) · Journal of Biological Chemistry · doi:10.1016/j.jbc.2025.111039 · Cited by 8
Disease mechanisms as subtypes: Microbiome
Bonvegna, S., & Cilia, R. (2023) · Handbook of clinical neurology · doi:10.1016/b978-0-323-85555-6.00006-0 · Cited by 8
Broken strands, broken minds: Exploring the nexus of DNA damage and neurodegeneration
Stavgiannoudaki, I., Goulielmaki, E., & Garinis, G. A. (2024) · DNA repair · doi:10.1016/j.dnarep.2024.103699 · Cited by 8
Jing, S., Wang, Z., Zhang, J., Li, X., & Huang, R. (2021) · Pharmacognosy Magazine · doi:10.4103/pm.pm_291_19 · Cited by 8
Villegas, L. D., Nørremølle, A., Freude, K., & Vilhardt, F. (2021) · Frontiers in Aging Neuroscience · doi:10.3389/fnagi.2021.736734 · Cited by 8
Slowing Parkinson’s Disease Progression with Vaccination and Other Immunotherapies
Vijayakumar, D., & Jankovic, J. J. (2022) · CNS Drugs · doi:10.1007/s40263-022-00903-7 · Cited by 8
JAK1/2 Regulates Synergy Between Interferon Gamma and Lipopolysaccharides in Microglia
Young, A. P., & Denovan‐Wright, E. M. (2024) · Journal of Neuroimmune Pharmacology · doi:10.1007/s11481-024-10115-z · Cited by 7
Crompton, L., Llana, O. C., & Caldwell, M. A. (2017) · Brain Pathology · doi:10.1111/bpa.12522 · Cited by 8
Zhang, Y., & Lu, K. (2021) · Journal of Integrative Neuroscience · doi:10.31083/j.jin2002055 · Cited by 8
Lai, W., Huang, S., Liu, J., Zhou, B., Yu, Z., Brown, J., & Hong, G. (2024) · The FASEB Journal · doi:10.1096/fj.202301923rr · Cited by 7
Shao, X., Xie, L., Zhai, J., & Ge, M. (2024) · IBRO Neuroscience Reports · doi:10.1016/j.ibneur.2024.12.008 · Cited by 7
Yadav, A. K., Verma, P., Srivastava, A., Srivastava, P., Rai, R., & Rathour, S. (2026) · Inflammopharmacology · doi:10.1007/s10787-026-02113-9 · Cited by 9
Rueda-Gensini, L., Serna, J. A., Bolaños, N. I., Rodríguez, J., Cruz, J. C., & Muñoz-Camargo, C. (2022) · Frontiers in Pharmacology · doi:10.3389/fphar.2022.905347 · Cited by 7
Neuropathology of Parkinson's Disease
El‐Mansoury, B., Hiba, O. E., Agnaou, M., Jayakumar, A. R., Khiat, A. E., Kahim, K., Boulbaroud, S., Zouhairi, N., Tibssirte, O., Bouighajd, H., et al. (2023) · Advances in medical diagnosis, treatment, and care (AMDTC) book series · doi:10.4018/978-1-6684-5156-4.ch006 · Cited by 7
Neuroglia in neurodegeneration: Alzheimer, Parkinson, and Huntington disease
Lim, D., Matute, C., Cavaliere, F., & Verkhratsky, A. (2025) · Handbook of Clinical Neurology · doi:10.1016/b978-0-443-19102-2.00012-0 · Cited by 8
Li, Z., Song, A., & Yu, H. (2018) · Journal of Clinical Neuroscience · doi:10.1016/j.jocn.2018.12.002 · Cited by 7
Possible Incidental Parkinson’s Disease following Asthma: A Nested Case–Control Study in Korea
Kwon, M. J., Kim, J., Kang, H. S., Lim, H. S., Kim, M.-J., Kim, N. Y., Kim, S. H., Choi, H. G., & Kim, E. S. (2023) · Journal of Personalized Medicine · doi:10.3390/jpm13050718 · Cited by 7
Synucleinopathies: Intrinsic and Extrinsic Factors
Lomeli-Lepe, A. K., Castañeda‐Cabral, J. L., & López‐Pérez, S. J. (2023) · Cell Biochemistry and Biophysics · doi:10.1007/s12013-023-01154-z · Cited by 6
Hong, H., Liu, S., Yang, T., Lin, J., Luo, K., Xu, Y., Li, T., Yu, X., Yang, L., Lu, Y., et al. (2025) · Cell Biology and Toxicology · doi:10.1007/s10565-025-09989-3 · Cited by 7
Campomayor, N. B., Kim, H. J., & Kim, M. (2025) · Biomolecules & Therapeutics · doi:10.4062/biomolther.2024.224 · Cited by 8
Targeting neuroinflammation in neurodegenerative disorders: the emerging potential of semaglutide
Evola, V., & Parmar, M. S. (2026) · Inflammation Research · doi:10.1007/s00011-025-02166-6 · Cited by 7
Trained immunity in acute and chronic neurological diseases
Zhang, S., & Liesz, A. (2026) · eLife · doi:10.7554/elife.106037 · Cited by 7
Liu, N., Zhou, Q., Wang, H., Li, Q., Chen, Z., Lin, Y., Yi, L., Jiang, S., Chen, C., & Deng, Y. (2023) · Cellular and Molecular Neurobiology · doi:10.1007/s10571-023-01378-w · Cited by 6
Glycolipids in Parkinson's disease: beyond neuronal function
Spanos, F., & Deleidi, M. (2023) · FEBS Open Bio · doi:10.1002/2211-5463.13651 · Cited by 6
α‐Synuclein activates innate immunity but suppresses interferon‐γ expression in murine astrocytes
Wang, J., Chen, Z., Walston, J. D., Gao, P., Gao, M., & Leng, S. X. (2018) · European Journal of Neuroscience · doi:10.1111/ejn.13956 · Cited by 6
Neuron–Glia Crosstalk in the Regulation of Astrocytic Antioxidative Mechanisms Following CNS Injury
Zakrzewski, P. K., & Boczek, T. (2025) · Antioxidants · doi:10.3390/antiox14121415 · Cited by 10
Distinct forebrain regions define a dichotomous astrocytic profile in multiple system atrophy
Schneider, Y., Gauer, C., Andert, M., Hoffmann, A., Riemenschneider, M. J., Krebs, W., Chalmers, N., Lötzsch, C., Naumann, U. J., Xiang, W., et al. (2024) · Acta Neuropathologica Communications · doi:10.1186/s40478-023-01699-3 · Cited by 7
Gui, S., Ni, J., Mizutani, S., SHIGEMATSU, N., Nakanishi, H., Kashiwazaki, H., & Wu, Z. (2024) · Food Science & Nutrition · doi:10.1002/fsn3.4045 · Cited by 5
Li, X., Hao, X., Chen, C., Zhai, C., Pan, T., Zhou, X., Liu, Y., Wu, D., & Chen, X. (2024) · Frontiers in Cellular and Infection Microbiology · doi:10.3389/fcimb.2024.1421270 · Cited by 7
Andromidas, F., MacKinnon, B., Myers, A. J., Shaffer, M. M., Brahimi, A., Atashpanjeh, S., Vazquez, T. L., Le, T., Jellison, E. R., Staurovsky, S., et al. (2024) · Molecular and Cellular Neuroscience · doi:10.1016/j.mcn.2024.103975 · Cited by 4
Paul, D., & Basavan, D. (2022) · Future Journal of Pharmaceutical Sciences · doi:10.1186/s43094-022-00446-0 · Cited by 5
Liu, H., Hua, M., Zheng, Q. Y., Gao, Y., & Li, Z. (2023) · MedComm – Biomaterials and Applications · doi:10.1002/mba2.47 · Cited by 5
Casini, A., Vivacqua, G., Ceci, L., Leone, S., Vaccaro, R., Tagliafierro, M., Bassi, F. M., Vitale, S., Bocci, E., Pannarale, L., et al. (2024) · Cell and Tissue Research · doi:10.1007/s00441-024-03932-4 · Cited by 5
Inflammation: Role in Parkinson's Disease and Target for Therapy
Flood, P. M., Arbabzada, N., & Sharma, M. (2016) · InTech eBooks · doi:10.5772/63164 · Cited by 5
Immunotherapeutic interventions in Parkinson's disease: Focus on α-Synuclein
Ganguly, U., Singh, S., Chakrabarti, S., Saini, A. K., & Saini, R. V. (2022) · Advances in protein chemistry and structural biology · doi:10.1016/bs.apcsb.2021.11.010 · Cited by 6
pKr-2 induces neurodegeneration via upregulation of microglial TLR4 in the hippocampus of AD brain
Kim, S., Sharma, C., Shin, M., Kim, H., Kim, J., & Kim, S. R. (2023) · Brain Behavior & Immunity - Health · doi:10.1016/j.bbih.2023.100593 · Cited by 5
Immune-Based Therapies for Traumatic Brain Injury: Insights from Pre-Clinical Studies
Machado, C. A., Silva, A. C. S. E., de Miranda, A. S., Cordeiro, T. M. E., Ferreira, R. N., de Souza, L. C., Teixeira, A. L., & de Miranda, A. S. (2019) · Current Medicinal Chemistry · doi:10.2174/0929867326666190710173234 · Cited by 5
Evans, J. R., Grant‐Peters, M., Beckwith, J. S., Toomey, C. E., Popovic, R., Breiter, J. C., Brenton, J., Fairbrother-Browne, A., Strohbuecker, S., Lachica, J., et al. (2025) · bioRxiv (Cold Spring Harbor Laboratory) · doi:10.1101/2025.08.25.671921 · Cited by 5
Erdafitinib diminishes LPS-mediated neuroinflammatory responses through NLRP3 in wild-type mice
Lee, H., Kim, S. H., Jung, T.-M., Kim, Y.-J., Gu, C.-H., Jeong, Y. J., Song, J.-H., & Hoe, H. (2025) · Frontiers in Pharmacology · doi:10.3389/fphar.2025.1572604 · Cited by 4
Klæstrup, I. H., Reinert, L. S., Ferreira, S. A., Lauritsen, J., Toft, G. U., Gram, H., Jensen, P. H., Paludan, S. R., & Romero‐Ramos, M. (2025) · npj Parkinson s Disease · doi:10.1038/s41531-025-01228-0 · Cited by 5
Gao, C., Lin, Z., Chen, Y., Gan, R., Wang, K., He, X., & Han, H. (2025) · Neuropharmacology and Therapy · doi:10.15212/npt-2025-0015 · Cited by 5
Sex-dependent immune activation shapes disease progression in a model of Parkinson’s disease
Beauchamp, L. C., Palumbo, L. A., Lanser, T. B., Baig, M., & Cox, L. M. (2025) · Biology of Sex Differences · doi:10.1186/s13293-025-00809-1 · Cited by 5
Zhai, J., Li, Y., Liu, J., & Dai, C. (2026) · Clinical and Translational Discovery · doi:10.1002/ctd2.70117 · Cited by 4
Genetic modifiers of synucleinopathies—lessons from experimental models
Lee, R. M. Q., & Koh, T. (2023) · Oxford Open Neuroscience · doi:10.1093/oons/kvad001 · Cited by 4
Mitigation of CXCL10 secretion by metabolic disorder drugs in microglial-mediated neuroinflammation
Oliai, S. F., Shippy, D. C., & Ulland, T. K. (2024) · Journal of Neuroimmunology · doi:10.1016/j.jneuroim.2024.578364 · Cited by 4
Al-Musawi, I., Dennis, B. H., Clowry, G. J., & LeBeau, F. E. N. (2024) · Frontiers in Dementia · doi:10.3389/frdem.2024.1404841 · Cited by 5
Insulin and TLR4 Inhibitor Improve Motor Impairments in a Rat Model of Parkinson’s Disease
Hemmati, F., Valian, N., Ahmadiani, A., Mohamed, Z., Raymond, A. A., Ibrahim, N. M., & Shirazi, S. F. H. (2024) · Iranian journal of pharmaceutical research · doi:10.5812/ijpr-144200 · Cited by 5
The potential role of CGRP in synuclein-associated neurodegenerative disorders
Alexoudi, A., Donadio, V., & Karageorgiou, E. (2024) · Frontiers in Neuroscience · doi:10.3389/fnins.2024.1479830 · Cited by 5
Sagai, M., & WIN-SHWE, T. T. (2015) · Nippon Eiseigaku Zasshi (Japanese Journal of Hygiene) · doi:10.1265/jjh.70.127 · Cited by 4
Interaction Between α-Synuclein and DJ-1 in Parkinson’s Disease
Sobhifar, P., & Brown, D. R. (2025) · Brain Sciences · doi:10.3390/brainsci15090899 · Cited by 4
Microglia-associated research in Parkinson’s disease: a bibliometric analysis
Chen, Y.-J., Xie, M.-R., Zhou, S.-Q., & Liu, F. (2025) · Frontiers in Aging Neuroscience · doi:10.3389/fnagi.2025.1657349 · Cited by 3
Unraveling synucleinopathies: Recent breakthroughs in Parkinson’s disease therapy
Nanda, A., Pandey, S. K., & Singh, R. K. (2025) · Journal of Pharmacology and Experimental Therapeutics · doi:10.1016/j.jpet.2025.103735 · Cited by 3
Wójcik, P., Culmsee, C., & Adamczyk, A. (2026) · Cellular and Molecular Neurobiology · doi:10.1007/s10571-026-01733-7 · Cited by 3
Liang, Y.-L., Yang, F.-G., & Tang, Q. (2026) · Journal of Neurology · doi:10.1007/s00415-026-13900-3 · Cited by 3
Bustos, L. M., & Sattler, R. (2023) · Frontiers in Molecular Medicine · doi:10.3389/fmmed.2023.1075805 · Cited by 4
Contribution of α‐synuclein cytopathologies to distinct seeding of misfolded α‐synuclein
Kim, A., Martínez-Valbuena, I., Danics, K., Forrest, S. L., & Kovács, G. G. (2025) · Brain Pathology · doi:10.1111/bpa.70024 · Cited by 3
Parkinson’s disease: exploring the systemic immune mechanisms through molecular investigations
Mohan, M., Mannan, A., & Singh, T. G. (2025) · Inflammopharmacology · doi:10.1007/s10787-025-01816-9 · Cited by 3
TLR4 in Neurodegenerative Diseases: Alzheimer’s and Parkinson’s Diseases
Balducci, C., & Forloni, G. (2020) · Progress in inflammation research · doi:10.1007/978-3-030-56319-6_7 · Cited by 4
Kaur, G., Behl, T., Sehgal, A., Singh, S., Sharma, N., Kumar, A., Arora, S., & BUNGAU, S. G. (2021) · Journal of Molecular Neuroscience · doi:10.1007/s12031-021-01811-z · Cited by 3
RetractedImmune receptors and aging brain
Djurisic, M. R. (2024) · Bioscience Reports · doi:10.1042/bsr20222267 · Cited by 3
Lysosomal Acidification in Cultured Astrocytes Using Nanoparticles
Lööv, C., & Erlandsson, A. (2017) · Methods in molecular biology · doi:10.1007/978-1-4939-6934-0_10 · Cited by 4
Traumatic Brain Injury Models in Zebrafish (Danio rerio)
Babchenko, V. Y., Belova, A. S., Bashirzade, A. A., Tikhonova, M. A., Demin, K. A., Zabegalov, K. N., Petersen, E. V., Kalueff, A. V., & Amstislavskaya, T. G. (2022) · Neuroscience and Behavioral Physiology · doi:10.1007/s11055-022-01254-y · Cited by 4
Zolezzi, J. M., Candia, S. B., & Inestrosa, N. C. (2019) · IntechOpen eBooks · doi:10.5772/intechopen.86167 · Cited by 3
Recent Advances in Neurodegeneration
Borreca, A. (2019) · IntechOpen eBooks · doi:10.5772/intechopen.71995 · Cited by 3
α-Synuclein strains influence multiple system atrophy via central and peripheral mechanismsPreprint
Torre-Muruzabal, T., der Perren, A. V., Coens, A., Janer, A. B., Camacho-Garcia, S., Stefanova, N., Melki, R., Baekelandt, V., & Peelaerts, W. (2020) · bioRxiv (Cold Spring Harbor Laboratory) · doi:10.1101/2020.10.16.342089 · Cited by 3
Self-citationThe Interplay Between CB2 and NMDA Receptors in Parkinson’s Disease
Reyes‐Resina, I., Lillo, J., Raïch, I., Rebassa, J. B., Capó, T., Navarro, G., & Navarro, G. (2025) · International Journal of Molecular Sciences · doi:10.3390/ijms26199419 · Cited by 2
Singh, L. (2025) · Molecular Neurobiology · doi:10.1007/s12035-025-05376-5 · Cited by 2
Burgaletto, C., Cantone, A. F., Palmas, M. F., Platania, C. B. M., Benedetto, G. D., Gaudio, G., Barbagallo, C., Ragusa, M., Bucolo, C., Vicario, N., et al. (2025) · Cell Death Discovery · doi:10.1038/s41420-025-02830-0 · Cited by 2
Differential microglial responses to structurally distinct alpha-synuclein polymorphs
Chang, K., Kim, J., Iba, M., Park, J. H., Beilina, A., Syed, Z. A., Baena, V., Horan-Portelance, L., Cookson, M., You, S., et al. (2025) · Molecular Brain · doi:10.1186/s13041-025-01256-0 · Cited by 2
Tu, Y., Lu, C., Wu, B. J., Yang, Y., Li, J., Su, Q., & Zhao, Z. (2026) · Frontiers in Aging Neuroscience · doi:10.3389/fnagi.2026.1724548 · Cited by 2
DYRK1A and Parkinson’s disease, facts and hypotheses
Meijer, L., Lindberg, M. F., Hogrel, G., & Khor, B. (2026) · Neurobiology of Disease · doi:10.1016/j.nbd.2026.107379 · Cited by 2
Targeting TLR4 in Parkinson's disease: mechanisms and therapeutic prospects
Dong, S., Lu, J., Wu, L., Wang, S., 宫玉波, Hu, J., Liu, Y., & Chen, X. (2026) · International Immunopharmacology · doi:10.1016/j.intimp.2026.116780 · Cited by 2
Toll-like receptors: versatile players in tumor
Yang, Y., & Pi, R. (2026) · Frontiers in Immunology · doi:10.3389/fimmu.2026.1735188 · Cited by 2
The Role of Astrocytes in Astrocytes Alzheimer’s Disease
Mavroudis, I. A., Petridis, F., Chatzikonstantinou, S., McKENN, J., Karantali, E., & KAZIS, D. (2020) · Annals of the Academy of Romanian Scientists Series on Biological Sciences · doi:10.56082/annalsarscibio.2020.1.65 · Cited by 2
Neurodegenerative Aspects of Multiple System Atrophy
Radford, R. A. W., Wong, M. B., & Pountney, D. L. (2022) · Springer eBooks · doi:10.1007/978-3-031-15080-7_110 · Cited by 2
Immunology and microbiome: Implications for motor systems
Mahjoub, Y., & Martino, D. (2023) · Handbook of clinical neurology · doi:10.1016/b978-0-323-98818-6.00001-7 · Cited by 2
Neuroinflammation and Immune Dysfunction in the Mechanisms of Development of Parkinson’s Disease
Idova, G. V., Лазаревна, А. Е., & Zhanaeva, S. Y. (2023) · Neuroscience and Behavioral Physiology · doi:10.1007/s11055-023-01549-8 · Cited by 2
Immune Sensors, Regulators, and Effectors of Brain Health
Acıoğlu, Ç., & Elkabes, S. (2024) · Springer eBooks · doi:10.1007/978-3-031-68237-7_3 · Cited by 2
Immunity in Parkinson's disease – The role of innate responses
Iyengar, A. S., Dunkley, P. R., & Dickson, P. W. (2025) · Journal of Neuroimmunology · doi:10.1016/j.jneuroim.2025.578716 · Cited by 4
Alpha-synuclein and neuroinflammation in Parkinson's disease
Varanita, T., & Bubacco, L. (2020) · Elsevier eBooks · doi:10.1016/b978-0-12-815950-7.00027-8 · Cited by 2
Role of Neuroinflammation in Neurodegenerative Disorders
Mohan, V., Edamakanti, C. R., & Sharma, V. (2021) · Elsevier eBooks · doi:10.1016/b978-0-12-821974-4.00001-7 · Cited by 2
Role of caspases, apoptosis and additional factors in pathology of Alzheimer's disease
Gupta, A. (2021) · Elsevier eBooks · doi:10.1016/b978-0-12-820122-0.00001-7 · Cited by 2
Altern und neurodegenerative Erkrankungen – warum gehen Nervenzellen verloren?
Klimaschewski, L. P. (2021) · Springer eBooks · doi:10.1007/978-3-662-63392-2_2 · Cited by 2
Self-citationStefanova, N. (2013) · Springer eBooks · doi:10.1007/978-3-7091-0687-7_5 · Cited by 2
Self-citationDisease mechanisms as subtypes: Immune dysfunction in Parkinson's disease
Contaldi, E., Magistrelli, L., & Comi, C. (2023) · Handbook of clinical neurology · doi:10.1016/b978-0-323-85555-6.00008-4 · Cited by 3
Molecular Basis of Neurodegeneration: Lessons from Alzheimer’s and Parkinson’s Diseases
Zolezzi, J. M., Candia, S. B., & Inestrosa, N. C. (2019) · IntechOpen eBooks · doi:10.5772/intechopen.81270 · Cited by 2
Paschou, C., Apokotou, O., Κόλλιας, Α., Charmpi, K., Dede, S., Samiotaki, M. K., Palese, F., Dimoula, K., Emmanouilidou, E., Taoufik, E., et al. (2024) · bioRxiv (Cold Spring Harbor Laboratory) · doi:10.1101/2024.11.06.621638 · Cited by 2
Astrocytes and the Synucleinopathies
Koob, A. O., & Sacchetti, P. (2018) · Springer eBooks · doi:10.1007/978-981-13-0944-1_8 · Cited by 1
Prionopathies and Prionlike Protein Aberrations in Neurodegenerative Diseases
Anderson, K. N., Overcast, W. B., Brosch, J. R., Graner, B. D., & Veronesi, M. C. (2021) · Neurographics · doi:10.3174/ng.2000035 · Cited by 1
Parkinson's Disease Involving Glial Cell Dysfunction
Oukhrib, M., Tamegart, L., Ghachi, H. E., Haj-Khlifa, A., Hamdan, Y. A., Maloui, A. B., Gamrani, H., & Chraa, M. (2023) · Advances in bioinformatics and biomedical engineering book series · doi:10.4018/978-1-6684-9675-6.ch009 · Cited by 1
Recent updates on immunotherapy in neurodegenerative diseases
Salunkhe, J., & Ugale, R. R. (2024) · Brain Research · doi:10.1016/j.brainres.2024.149205 · Cited by 2
Exploring LRRK2-dependent Mechanisms in Parkinson’s Disease Therapy
Sharma, V., Sharma, S., Singh, S., & Singh, T. G. (2025) · CNS & Neurological Disorders - Drug Targets · doi:10.2174/0118715273377507250320035243 · Cited by 1
Parkinson's disease: A chronic systemic inflammatory disorder
Khan, H., & Benskey, M. J. (2025) · Handbook of behavioral neuroscience · doi:10.1016/b978-0-443-21992-4.00006-3 · Cited by 1
Metadata
- Authors
- Fellner, L., Irschick, R., Schanda, K., Reindl, M., Klimaschewski, L., Poewe, W., Wenning, G. K., & Stefanova, N.
- Affiliations
- Innsbruck Medical University (AT)
- Corresponding author
- Stefanova, Nadia
- ORCID
- Venue
- Glia
- Publisher
- Wiley
- Published
- 2012-10-25
- Volume
- 61
- Issue
- 3
- Pages
- 349-360
- ISSN
- 0894-1491 (ISSN-L)
- 1098-1136
- PMC
- PMC3568908
- OpenAlex
- W2019863741
- Cited by
- 697
- References
- 64
- Citations by year
- 2026: 31 · 2025: 45 · 2024: 80 · 2023: 54 · 2022: 59 · 2021: 89 · 2020: 79 · 2019: 54 · 2018: 53 · 2017: 42 · 2016: 31 · 2015: 34 · 2014: 31 · 2013: 14
- FWCI
- 12.70
- Type
- journal article
- Language
- en
- Open access
- bronze
- doi.org
- Locations
- Glia (publishedVersion)
- Europe PMC (PubMed Central) (publishedVersion, cc-by)
- PubMed Central (publishedVersion, cc-by)
- PubMed (publishedVersion)
- Funders
- Austrian Science Fund (F4404, P19989)
- Topics
- Life Sciences › Neuroscience › Neurology › Neuroinflammation and Neurodegeneration Mechanisms
- Health Sciences › Medicine › Clinical Neurology › Parkinson's Disease Mechanisms and Treatments
- Life Sciences › Immunology and Microbiology › Immunology › Immune Response and Inflammation
- Keywords
- TLR4, alpha-synuclein, synucleinopathies, microglial activation, astroglial activation, microglial phagocytosis, reactive oxygen species, inflammatory cytokines, NF-κB nuclear translocation, glial activation, neuroinflammation
- MeSH terms
- Animals, Astrocytes, Cells, Cultured, Gliosis, Inflammation, Phagocytosis, Tumor Necrosis Factor-alpha, Interleukin-6, NF-kappa B, Reactive Oxygen Species, Microglia, Mice, Knockout, Protein Transport, Toll-Like Receptor 4, Mice, alpha-Synuclein, Chemokine CXCL1
About these checks
Registry, retraction, Cites and statistics results are computed, not judged, with one exception: a printed reference that no index lists is read once by a model before it counts as a citation error. Claims are extracted by a model and kept only when their quote appears verbatim in the text; each cited source is then checked, with a model’s help, for whether it says what the claim relies on. Those verdicts can be wrong — read the claim’s quote and the cited source before relying on one.
Statistics and arithmetic are recomputed, not judged.
Confidence bands are shown only for fields calibrated on our annotated test set. None is calibrated yet, so no band is shown.
What counts as a claim ›How we measure confidence ›How we check this ›
Are you an author, or do you see a problem with this page? Request a review
