

The DOI matches its Crossref record; 73 of the 73 references it cites were found in a registry or an index; none of the 61 sources its claims cite is checked for support yet.
Bimodal expression of RHOH during myelomonocytic differentiation: Implications for the expansion of AML differentiation therapy
Open accessAbstract
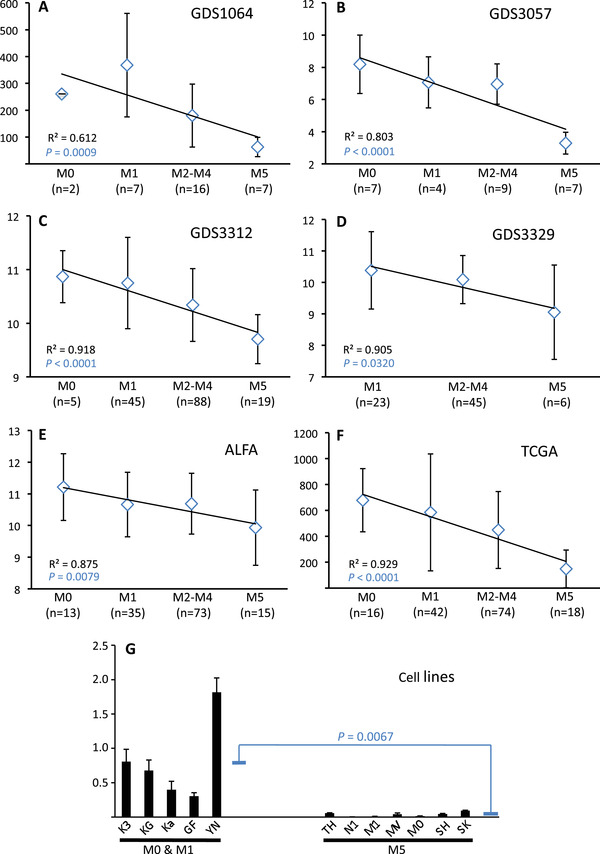
RhoH is an unusual member of the Rho family of small GTP‐binding proteins in that it lacks GTPase activity. Since the RhoH protein is constantly bound by GTP, it is constitutively active and controlled predominantly by changes in quantitative expression. Abnormal levels of RHOH gene transcripts have been linked to a range of malignancies including acute myeloid leukemia (AML). One of the hallmarks of AML is a block in the normal program of myeloid differentiation. Here we investigate how myeloid differentiation is controlled by the quantitative expression of RHOH. Our analysis demonstrates that increasingly mature myeloid cells express progressively lower levels of RHOH. However, as monocytic myeloid cells terminally differentiate into macrophages, RHOH expression is up‐regulated. This up‐regulation is not apparent in AML where myeloid differentiation is blocked at stages of low RHOH expression. Nevertheless, when the up‐regulation of RHOH is forced, then terminal macrophage differentiation is induced and the Cdc42 and Wnt intracellular signalling pathways are repressed. These results indicate that RHOH induction is a driver of terminal differentiation and might represent a means of effecting AML differentiation therapy. The potential of this therapeutic strategy is supported by forced up‐regulation of RHOH reducing the ability of AML cells to produce tumours in vivo.
Overview
CoChat Summary
Written by AI from the paper’s full text.
TL;DR
RHOH expression is bimodal during myelomonocytic differentiation: it declines through early/intermediate stages but is induced during terminal monocyte-to-macrophage differentiation. Forced RHOH expression in AML cells drives terminal differentiation, represses Cdc42/Wnt signalling, and reduces tumour growth in a xenograft model.
Key findings
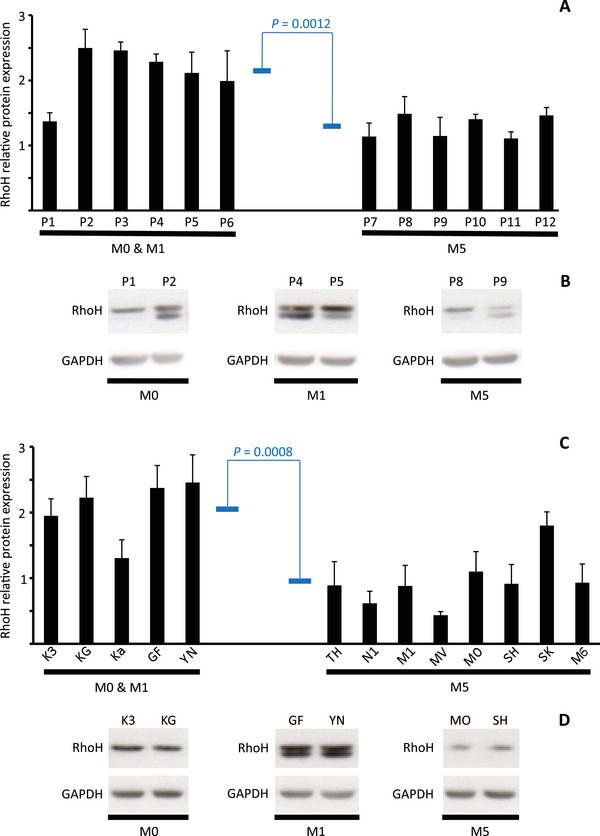
- RHOH mRNA and protein progressively decline with myeloid maturation: M0/M1 vs M5 mRNA was 0.802 ± SD 0.603 vs 0.037 ± SD 0.033 (21.7-fold, P = 0.0067); patient protein was 2.12 ± SD 0.42 vs 1.29 ± SD 0.18 (P = 0.0012); cell-line protein was 2.06 ± SD 0.46 vs 0.94 ± SD 0.40 (P = 0.0008).
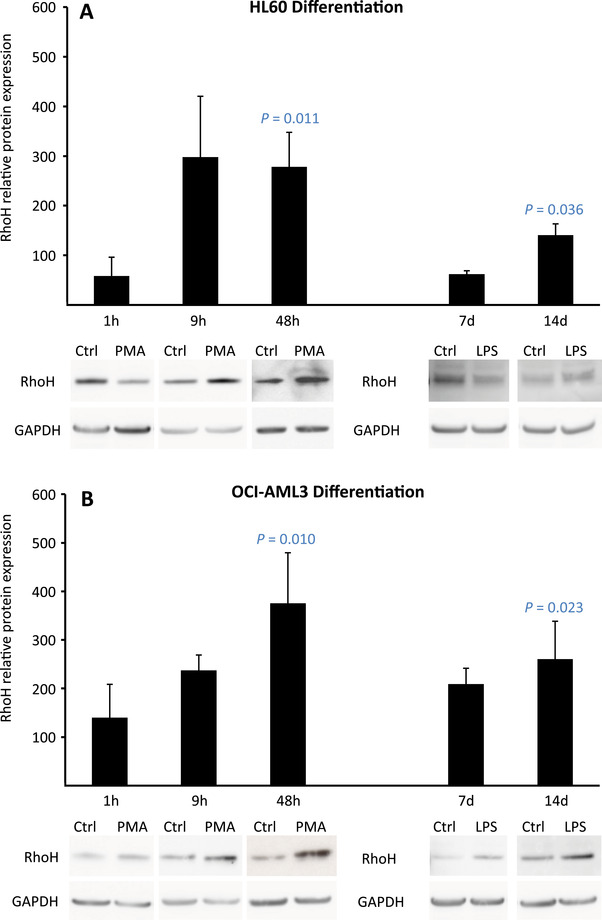
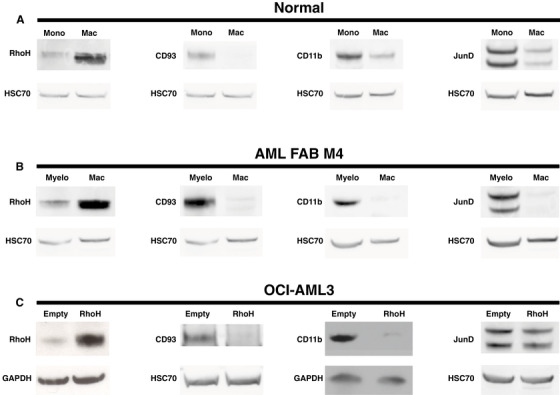
- Terminal differentiation induces RHOH: PMA or LPS treatment of HL60/OCI-AML3, and PMA treatment of primary monocytes and AML FAB M4 myeloblasts, increased RhoH protein while JunD was down-regulated.
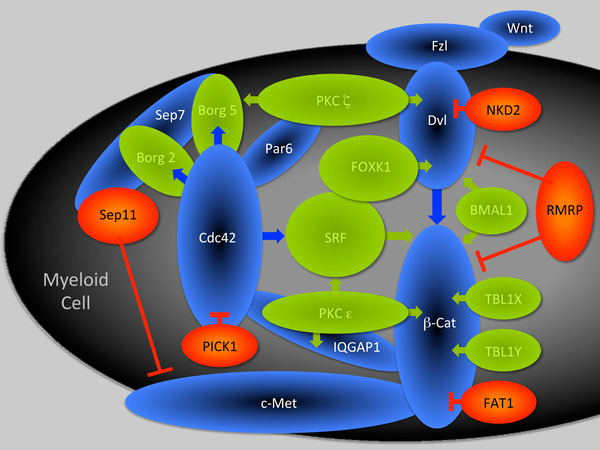
- Forced RHOH in OCI-AML3 (OCI-RhoH vs OCI-Empty) reduced CD93 and CD11b and altered 72 transcripts; 42 were linked to mature myeloid functions, with 9 down-regulated Cdc42/Wnt-positive effectors and 4 up-regulated negative effectors plus RMRP.
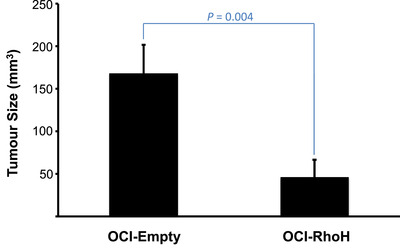
- In xenografts, tumours developed in 12/13 mice injected with OCI-Empty vs 5/12 with OCI-RhoH; OCI-RhoH tumours had average volumes 3.6-fold smaller (P = 0.004).
Methods
- RHOH expression was analysed in FAB-subtyped de novo AML transcriptomes from five microarray datasets and one RNA-seq dataset (ALFA-0701, GEO GDS1064/GDS3057/GDS3312/GDS3329, TCGA), plus AML cell lines, primary monocytes, and primary AML blasts using Q-RT-PCR and Western blotting.
- OCI-AML3 daughter lines stably expressing empty vector (OCI-Empty) or RHOH (OCI-RhoH) were compared by Western blot and Agilent whole-human-genome microarray; 72 genes differed significantly (P ≤ 0.05; GEO GSE138479).
- OCI-Empty or OCI-RhoH cells (5 or 10 × 10^6) were injected subcutaneously into SHrNTM Hairless NOD.SCID mice; tumour volumes were measured 3 weeks later and compared by Mann-Whitney test.
Limitations
- The paper has no dedicated limitations section. It notes that cell lines may not mimic in vivo biology, so key findings were verified in primary monocytes and AML myeloblasts.
- Evident from the text: the in vivo therapeutic evidence comes from a single AML cell line (OCI-AML3) in immunocompromised mice, with small groups (13 OCI-Empty and 12 OCI-RhoH injected; tumour volume analysis n = 12 vs n = 11 after outlier removal) and a short 3-week endpoint.
- The conflict-of-interest statement notes that Carl S. Shelley is President and CEO of Leukemia Therapeutics, LLC, which is developing AML treatments based on targeting consequences of aberrant RHOH repression.
Model-written summary. Check it against the paper before relying on it.
Integrity signals
Registry
Cites
Statistics
Figures
Verification
Claims the paper makes
20 Own result · 15 Own interpretation · 12 Not checked yet · 10 No full text of the sources · 8 Check pending · 7 Own method · 2 Sources not found
None of the sources cited for this claim have been checked yet.
In the paper
“These monocytes and myeloblasts were treated with phorbol ester for 48 h and terminal differentiation into macrophages confirmed by their acquisition of a strong adhesive phenotype, morphological spreading, and characteristic down‐regulation of CD11b and CD93 protein expression (Figure 4A, B, Supplemental Figure S1) [54, 55].”
§ Bimodal expression of RHOH during myelomonocytic differentiation: Implications for the expansion of AML differentiation therapy > RESULTS > RHOH expression is induced during the terminal stages of myeloid differentiation
What the sources say
- Not checked yetcites [54] Park H, Shelley CS, Arnaout MA. The zinc finger transcription factor ZBP‐89 is a repressor of the human β2‐integrin CD11b gene. Blood. 2003; 101: 894‐ 902. 12393719 source
- Not checked yetcites [55] Pilling D, Fan T, Huang D, Kaul B, Gomer RH. Identification of markers that distinguish monocyte‐derived fibrocytes from monocytes, macrophages, and fibroblasts. PLoS One. 2009; 4: e7475. 19834619 PMC2759556 source
plainstates a cause- Asserted: passes — The authors put it forward as true.
- Checkable: passes — It can be checked against evidence.
- Load-bearing: passes — The paper’s conclusions depend on it.
- Based: passes — The paper gives a reason why it holds.
A result the paper reports from its own data — it cites no other source for it, so there is none to check. The quote shows it is in the paper.
In the paper
“Furthermore, when the AML cell line HL60 was induced to differentiate, with either phorbol ester for 1 hour or lipopolysaccharide for 7 days, RhoH protein levels were again repressed (Figure 3A).”
§ Bimodal expression of RHOH during myelomonocytic differentiation: Implications for the expansion of AML differentiation therapy > RESULTS > RHOH expression progressively declines during the early and intermediate stages of myeloid differentiation
plainstates a cause- Asserted: passes — The authors put it forward as true.
- Checkable: passes — It can be checked against evidence.
- Load-bearing: passes — The paper’s conclusions depend on it.
- Based: passes — The paper gives a reason why it holds.
A result the paper reports from its own data — it cites no other source for it, so there is none to check. The quote shows it is in the paper.
In the paper
“Literature searches revealed that 42 of these 72 transcripts encode proteins or represent long non‐coding RNAs implicated in regulating functions characteristic of mature myeloid cells (Table 1).”
- Also stated in: § Induction of RHOH expression limits tumour growth in a xenograft model of AML · plain
“Transcriptome analysis implicates RHOH induction in regulating 42 genes controlling the function of mature myeloid cells.”
§ Bimodal expression of RHOH during myelomonocytic differentiation: Implications for the expansion of AML differentiation therapy > RESULTS > RHOH induction is associated with acquisition of a mature myeloid phenotype and alters expression of genes controlling Cdc42 and Wnt signalling
plainstates an association- Asserted: passes — The authors put it forward as true.
- Checkable: passes — It can be checked against evidence.
- Load-bearing: passes — The paper’s conclusions depend on it.
- Based: passes — The paper gives a reason why it holds.
- Also stated in: § Induction of RHOH expression limits tumour growth in a xenograft model of AML · plain
None of the sources cited for this claim have been checked yet.
In the paper
“In addition, RHOH induction is demonstrated to cause the down‐regulation of CD11b and CD93 protein expression characteristic of monocytes terminally differentiating into macrophages (Figure 4C) [54, 55].”
- Also stated in: § DISCUSSION · boosted
“We demonstrate here that as monocytes terminally differentiate into macrophages RHOH expression is induced and that this induction causes a down‐regulation in the levels of both CD93 and CD11b protein.”
§ Bimodal expression of RHOH during myelomonocytic differentiation: Implications for the expansion of AML differentiation therapy > RESULTS > Induction of RHOH expression limits tumour growth in a xenograft model of AML
What the sources say
- Not checked yetcites [54] Park H, Shelley CS, Arnaout MA. The zinc finger transcription factor ZBP‐89 is a repressor of the human β2‐integrin CD11b gene. Blood. 2003; 101: 894‐ 902. 12393719 source
- Not checked yetcites [55] Pilling D, Fan T, Huang D, Kaul B, Gomer RH. Identification of markers that distinguish monocyte‐derived fibrocytes from monocytes, macrophages, and fibroblasts. PLoS One. 2009; 4: e7475. 19834619 PMC2759556 source
boostedstates a cause- Asserted: passes — The authors put it forward as true.
- Checkable: passes — It can be checked against evidence.
- Load-bearing: passes — The paper’s conclusions depend on it.
- Based: passes — The paper gives a reason why it holds.
- Also stated in: § DISCUSSION · boosted
A result the paper reports from its own data — it cites no other source for it, so there is none to check. The quote shows it is in the paper.
In the paper
“In total, the tumours produced by RHOH differentiated AML cells had average volumes 3.6 fold smaller than those produced by their non‐differentiated counterparts (Figure 6).”
§ Bimodal expression of RHOH during myelomonocytic differentiation: Implications for the expansion of AML differentiation therapy > RESULTS > Induction of RHOH expression limits tumour growth in a xenograft model of AML
plainstates an associationn = 12- Asserted: passes — The authors put it forward as true.
- Checkable: passes — It can be checked against evidence.
- Load-bearing: passes — The paper’s conclusions depend on it.
- Based: passes — The paper gives a reason why it holds.
- It may state two separate claims as one. 14
- The quote only partly states this claim. 1
- Probably not a substantial claim. 11
Create a free account to see these claims.
Create a free account to see these assumptions.
46 more claims
Create a free account to see all 74 claims and to verify the 35 references still open.
Claims other papers make about this one
Each is checked against this paper’s own text: does it say what the citing paper says it does?
In the citing paper
“Collectively, RhoH activity in the myeloid cell is critical in promoting macrophage terminal differentiation by the repression of the interlinked Cdc42 and Wnt intracellular signalling pathways and inflammatory effector proteins, CD11b and CD93.”
From The Role of RhoH in TCR Signalling and Its Involvement in Diseases (2021) · cites this paper as [63]
In the citing paper
“In the case of AML, lack of RhoH is presumed to contribute to AML pathogenesis by inhibiting terminal myeloid differentiation [63].”
From The Role of RhoH in TCR Signalling and Its Involvement in Diseases (2021) · cites this paper as [63]
In the citing paper
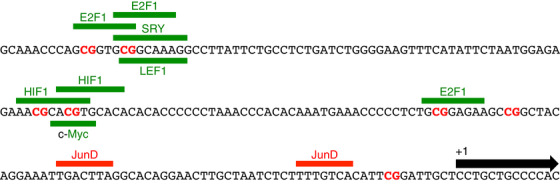
“Consistent with this finding, overexpression of JunD was found to repress RhoH gene in AML [61,63], indicating that regulation of RhoH mRNA expression by a transcriptional repressor may affect RhoH anti-tumour activity.”
From The Role of RhoH in TCR Signalling and Its Involvement in Diseases (2021) · cites this paper as [63]
In the citing paper
“Interestingly, RhoH-induced terminal myeloid differentiation may require Cdc42 and/or Wnt signalling inhibition because 13 affected genes were identified following RHOH induction.”
From The Role of RhoH in TCR Signalling and Its Involvement in Diseases (2021) · cites this paper as [63]
Citations
Cites
RSEM: accurate transcript quantification from RNA-Seq data with or without a reference genome
Li, B., & Dewey, C. N. (2011) · BMC Bioinformatics · doi:10.1186/1471-2105-12-323 · Cited by 22,179
Genomic and Epigenomic Landscapes of Adult De Novo Acute Myeloid Leukemia
The Cancer Genome Atlas Research Network (2013) · New England Journal of Medicine · doi:10.1056/nejmoa1301689 · Cited by 5,078
Martinez, F. O., Gordon, S., Locati, M., & Mantovani, A. (2006) · The Journal of Immunology · doi:10.4049/jimmunol.177.10.7303 · Cited by 2,125
PROMO: detection of known transcription regulatory elements using species-tailored searches
Messeguer, X., Escudero, R., Farré, D., Núñez, Ó., Martı́nez, J., & Albà, M. M. (2002) · Bioinformatics · doi:10.1093/bioinformatics/18.2.333 · Cited by 1,371
Gabert, J., Beillard, E., van der Velden, V. H. J., Bi, W., Grimwade, D., Pallisgaard, N., Barbany, G., Cazzaniga, G., Cayuela, J. M., Cavé, H., et al. (2003) · Leukemia · doi:10.1038/sj.leu.2403135 · Cited by 1,284
Identification of patterns in biological sequences at the ALGGEN server: PROMO and MALGEN
Farré, D. (2003) · Nucleic Acids Research · doi:10.1093/nar/gkg605 · Cited by 1,057
Hypermutation of multiple proto-oncogenes in B-cell diffuse large-cell lymphomas
Pasqualucci, L., Neumeister, P., Goossens, T., Nanjangud, G., Chaganti, R. S. K., Küppers, R., & Dalla-Favera, R. (2001) · Nature · doi:10.1038/35085588 · Cited by 1,032
Castaigné, S., Pautas, C., Terré, C., Raffoux, E., Bordessoule, D., Bastie, J.-N., Legrand, O., Thomas, X., Turlure, P., Reman, O., et al. (2012) · The Lancet · doi:10.1016/s0140-6736(12)60485-1 · Cited by 1,017
A 17-gene stemness score for rapid determination of risk in acute leukaemia
Ng, S. W. K., Mitchell, A., Kennedy, J. A., Chen, W. C., McLeod, J., Ibrahimova, N., Arruda, A., Popescu, A., Gupta, V., Schimmer, A. D., et al. (2016) · Nature · doi:10.1038/nature20598 · Cited by 912
Self-citationDifferentiation therapy revisited
de Thé, H. (2018) · Nature reviews. Cancer · doi:10.1038/nrc.2017.103 · Cited by 462
Cited by
The Role of RhoH in TCR Signalling and Its Involvement in Diseases
Ahmad Mokhtar, A. M., Hashim, I. F., Mohd Zaini Makhtar, M., Salikin, N. H., & Amin-Nordin, S. (2021) · Cells · doi:10.3390/cells10040950 · Cited by 25
Elucidating the risk factors and oncogene drivers of acute myeloid leukemia
Sanya, D. R. A., & Onésime, D. (2025) · Human Cell · doi:10.1007/s13577-025-01294-9 · Cited by 1
Full-length RNA-Seq of the RHOH gene in human B cells reveals new exons and splicing patterns
Leprêtre, F., Meneboo, J., Villenet, C., Delestré, L., Quesnel, B., Shelley, C. S., Figeac, M., & Galiègue‐Zouitina, S. (2024) · Scientific Reports · doi:10.1038/s41598-024-79307-0 · Cited by 1
Self-citationShelley, C. S., Galiègue‐Zouitina, S., Andritsos, L. A., Epperla, N., & Troussard, X. (2024) · Leukemia & lymphoma/Leukemia and lymphoma · doi:10.1080/10428194.2024.2438800
Self-citationВакилевна, Ш. Ю., Enikeeva, K., Korobeynikov, V., Shmelkova, P., Gainullina, D. K., Ринатовна, А. Э., & Павлов, В. Н. (2026) · Medical Immunology (Russia) · doi:10.15789/1563-0625-tho-3299
Metadata
- Authors
- Galiègue‐Zouitina, S., Fu, Q., Carton‐Latreche, C., Poret, N., Cheok, M., Leprêtre, F., Figeac, M., Quesnel, B., El Bouazzati, H., & Shelley, C. S.
- Affiliations
- Inserm (FR)
- California Institute for Biomedical Research (US)
- JPARC UMRS 1172 Inserm Lille University Lille France
- Centre National de la Recherche Scientifique (FR)
- Université de Lille (FR)
- LLC Leukaemia Therapeutics Hull Massachusetts USA
- Corresponding author
- Galiègue‐Zouitina, Sylvie
- Shelley, Carl S
- ORCID
- Venue
- eJHaem
- Publisher
- Wiley
- Published
- 2021-01-20
- Volume
- 2
- Issue
- 2
- Pages
- 196-210
- ISSN
- 2688-6146 (ISSN-L)
- PMC
- PMC9175762
- OpenAlex
- W3122045750
- Semantic Scholar
- 15fe3a033339383a91c14d85f9077b30e17446da
- Cited by
- 7
- References
- 73
- Citations by year
- 2026: 3 · 2025: 1 · 2024: 2 · 2021: 1
- FWCI
- 0.49
- Type
- journal article
- Language
- en
- Open access
- gold
- doi.org
- Licence
- Locations
- eJHaem (publishedVersion, cc-by)
- PubMed (publishedVersion)
- PubMed Central (publishedVersion, cc-by)
- HAL (submittedVersion)
- DOAJ (DOAJ: Directory of Open Access Journals) (submittedVersion)
- Funders
- Institut National de la Santé et de la Recherche Médicale
- Topics
- Health Sciences › Medicine › Hematology › Acute Myeloid Leukemia Research
- Life Sciences › Biochemistry, Genetics and Molecular Biology › Molecular Biology › Retinoids in leukemia and cellular processes
- Life Sciences › Biochemistry, Genetics and Molecular Biology › Molecular Biology › Protein Kinase Regulation and GTPase Signaling
- Keywords
- RhoH, acute myeloid leukemia, myelomonocytic differentiation, macrophage differentiation, terminal differentiation, Cdc42 signaling, Wnt signaling, differentiation therapy
About these checks
Registry, retraction, Cites and statistics results are computed, not judged, with one exception: a printed reference that no index lists is read once by a model before it counts as a citation error. Claims are extracted by a model and kept only when their quote appears verbatim in the text; each cited source is then checked, with a model’s help, for whether it says what the claim relies on. Those verdicts can be wrong — read the claim’s quote and the cited source before relying on one.
A language model drew the claims from the paper on 2026-11-12, under version 3 of the claim definition (model deepseek-v4.1-flash, prompt extract-v3).
A second model labelled each claim on 2026-11-12 (model jev-1.13-20260917, definition revision gold-guideline-v0.2).
Statistics and arithmetic are recomputed, not judged.
Confidence bands are shown only for fields calibrated on our annotated test set. None is calibrated yet, so no band is shown.
What counts as a claim ›How we measure confidence ›How we check this ›
Are you an author, or do you see a problem with this page? Request a review
How to cite
Cite CoChat for the checks on this page, and the paper for its own findings.
- This page
- CoChat. (2026). Citation check: Bimodal expression of RHOH during myelomonocytic differentiation: Implications for the expansion of AML differentiation therapy. https://app.cochat.ai/papers/10.1002/jha2.128
- The paper
- Galiègue‐Zouitina, S., Fu, Q., Carton‐Latreche, C., Poret, N., Cheok, M., Leprêtre, F., Figeac, M., Quesnel, B., El Bouazzati, H., & Shelley, C. S. (2021). Bimodal expression of RHOH during myelomonocytic differentiation: Implications for the expansion of AML differentiation therapy. eJHaem. https://doi.org/10.1002/jha2.128
