

The DOI matches its Crossref record; 26 of the 26 references it cites were found in a registry or an index.
Translational Pharmacokinetic/Pharmacodynamic Modeling of Tumor Growth Inhibition Supports Dose-Range Selection of the Anti-PD-1 Antibody Pembrolizumab
Open accessAbstract
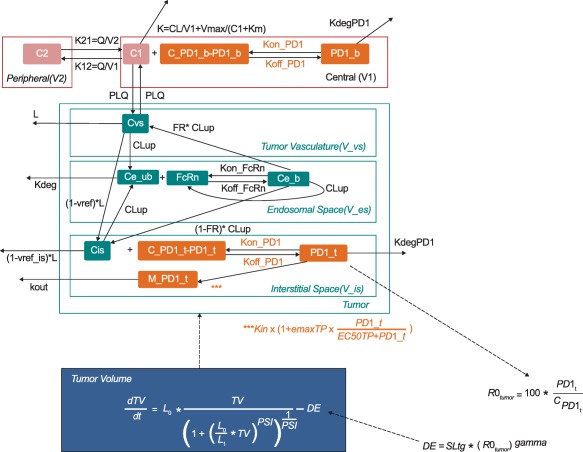
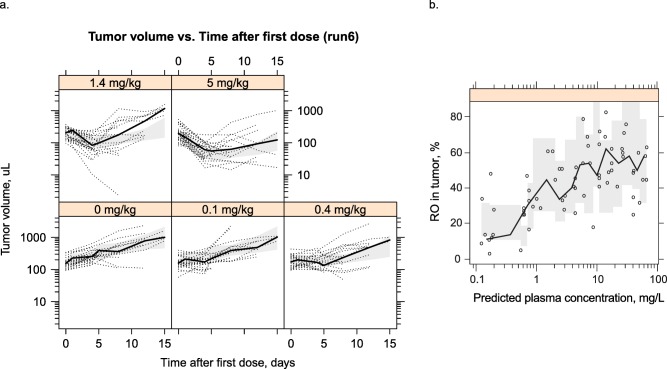
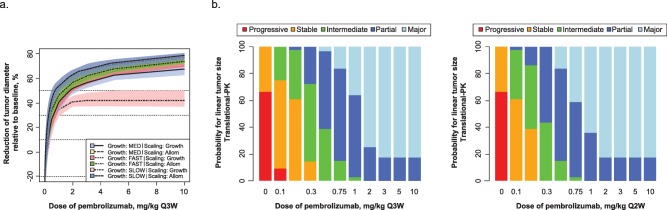
Pembrolizumab, a humanized monoclonal antibody against programmed death 1 (PD-1), has a manageable safety profile and robust clinical activity against advanced malignancies. The lowest effective dose for evaluation in further dose-ranging studies was identified by developing a translational model from preclinical mouse experiments. A compartmental pharmacokinetic model was combined with a published physiologically based tissue compartment, linked to receptor occupancy as the driver of observed tumor growth inhibition. Human simulations were performed using clinical pharmacokinetic data, literature values, and in vitro parameters for drug distribution and binding. Biological and mathematical uncertainties were included in simulations to generate expectations for dose response. The results demonstrated a minimal increase in efficacy for doses higher than 2 mg/kg. The findings of the translational model were successfully applied to select 2 mg/kg as the lowest dose for dose-ranging evaluations.
Overview
The claims and statistics of this paper haven’t been checked yet.
Run the check — free, no account needed. It reads the open-access text and checks the sources it cites.
Integrity signals
Registry
Cites
Statistics
Figures
Verification
Claims the paper makes
The claims and statistics of this paper haven’t been checked yet.
Run the check — free, no account needed. It reads the open-access text and checks the sources it cites.
Claims other papers make about this one
Each is checked against this paper’s own text: does it say what the citing paper says it does?
In the citing paper
“Lindauer et al. utilized physiologically based PK and systems pharmacology approaches combining in vitro binding data, mechanistic tumor growth inhibition models, and drug exposure‐time‐to‐event relationships to successfully identify the lowest effective dose for evaluation.82”
From Tutorial on monoclonal antibody pharmacokinetics and its considerations in early development (2018) · cites this paper as [82]
Self-check
Percentages, sums and reported differences re-computed from the paper’s own numbers.
The self-check needs the paper’s full text.
Citations
Cites
PD-1 and PD-L1 Immune Checkpoint Blockade to Treat Breast Cancer
Hartkopf, A. D., Taran, F., Wallwiener, M., Walter, C. B., Krämer, B., Grischke, E., & Brucker, S. Y. (2016) · Breast Care · doi:10.1159/000453569 · Cited by 30,989
New response evaluation criteria in solid tumours: revised RECIST guideline (version 1.1)
Eisenhauer, E. A., Therasse, P., Bogaerts, J., Schwartz, L. H., Sargent, D., Ford, R., Dancey, J., Arbuck, S., Gwyther, S., Mooney, M., et al. (2009) · European Journal of Cancer · doi:10.1016/j.ejca.2008.10.026 · Cited by 29,534
Adverse Renal Effects of Immune Checkpoint Inhibitors: A Narrative Review
Wanchoo, R., Karam, S., Uppal, N. N., Barta, V. S., Deray, G., Devoe, C., Launay‐Vacher, V., Jhaveri, K. D., & on behalf of Cancer and Kidney International Network Workgroup on Immune Checkpoint Inhibitors (2017) · American Journal of Nephrology · doi:10.1159/000455014 · Cited by 15,320
Improved Survival with Ipilimumab in Patients with Metastatic Melanoma
Hodi, F. S., O'Day, S. J., McDermott, D. F., Weber, R. W., Sosman, J. A., Haanen, J. B., Gonzalez, R., Robert, C., Schadendorf, D., Hassel, J. C., et al. (2010) · New England Journal of Medicine · doi:10.1056/nejmoa1003466 · Cited by 15,155
The blockade of immune checkpoints in cancer immunotherapy
Pardoll, D. M. (2012) · Nature Reviews Cancer · doi:10.1038/nrc3239 · Cited by 13,838
Safety and Tumor Responses with Lambrolizumab (Anti–PD-1) in Melanoma
Hamid, O., Robert, C., DAUD, A. I., Hodi, F. S., Hwu, W., Kefford, R. F., Wolchok, J. D., Hersey, P., Joseph, R. W., Weber, J. S., et al. (2013) · New England Journal of Medicine · doi:10.1056/nejmoa1305133 · Cited by 3,427
Self-citationRobert, C., Ribas, A., Wolchok, J. D., Hodi, F. S., Hamid, O., Kefford, R., Weber, J. S., Joshua, A. M., Hwu, W.-J., Gangadhar, T. C., et al. (2014) · The Lancet · doi:10.1016/s0140-6736(14)60958-2 · Cited by 1,774
Self-citationRibas, A., Puzanov, I. J., Dummer, R., Schadendorf, D., Hamid, O., Robert, C., Hodi, F. S., Schachter, J., Pavlick, A. C., Lewis, K. D., et al. (2015) · The Lancet Oncology · doi:10.1016/s1470-2045(15)00083-2 · Cited by 1,590
Okazaki, T., Chikuma, S., Iwai, Y., Fagarasan, S., & Honjo, T. (2013) · Nature Immunology · doi:10.1038/ni.2762 · Cited by 939
Patnaik, A., Kang, S. P., Rasco, D. W., Papadopoulos, K. P., Elassaiss‐Schaap, J., Beeram, M., Drengler, R. L., Chen, C., Smith, L. S., Espino, G., et al. (2015) · Clinical Cancer Research · doi:10.1158/1078-0432.ccr-14-2607 · Cited by 815
Self-citation
Research works printed but not linked: 1
- Chiu, 2013, Exposure-response analysis of the effect of trametinib, a MEK inhibitor, on tumor size in patients with V600 BRAF mutation positive melanoma, J. Pharmacokinet. Pharmacodyn., 40, S115
Cited by
Sorted by citations
Items 101–119 of 119
Baaz, M., Sjöberg, A., & Jirstrand, M. (2026) · CPT Pharmacometrics & Systems Pharmacology · doi:10.1002/psp4.70280 · Cited by 1
Model-informed drug development and discovery: an overview of current practices
Elmeliegy, M. A., & Ghobrial, O. G. (2020) · Elsevier eBooks · doi:10.1016/b978-0-12-820007-0.00014-3 · Cited by 2
Takimoto, C. H. M., Wick, M. J., Agoram, B. M., & Jin, D. (2021) · Elsevier eBooks · doi:10.1016/b978-0-12-819869-8.00031-8 · Cited by 1
A Minimal PBPK Model Describes the Differential Disposition of Silica Nanoparticles In VivoPreprint
Parrot, M., Cave, J., Peláez, M. J., Ghandehari, H., Dogra, P., & Yellepeddi, V. (2024) · medRxiv · doi:10.1101/2024.09.18.24313941 · Cited by 1
Voss, M. H., & Motzer, R. J. (2024) · European Urology · doi:10.1016/j.eururo.2024.09.018 · Cited by 1
Viala, M., & Tosi, D. (2019) · médecine/sciences · doi:10.1051/medsci/2019209
Development of Accounting Policies of Agricultural Enterprises
Dubinina, M., & Boyeva, O. (2014)
Song, X., Khan, A. A., Zhou, D., Elgeioushi, N., Walcott, F. L., Ren, S., & Gibbs, M. A. (2022) · Cancer Chemotherapy and Pharmacology · doi:10.1007/s00280-022-04396-5
[Application of MIDD in Clinical Research of Antitumor Drugs].
Yu, M., & Wang, H. (2022) · PubMed Central · doi:10.3779/j.issn.1009-3419.2022.101.38
Multifaceted perspectives of detecting and targeting solid tumors
Bhattacharya, A., & Dasgupta, A. K. (2024) · International review of cytology · doi:10.1016/bs.ircmb.2024.03.010
Novel biopharmaceuticals: Pharmacokinetics, pharmacodynamics, and bioanalytics
Bosgra, S., & Gupta, M. (2024) · Elsevier eBooks · doi:10.1016/b978-0-443-13344-2.00013-4
Development of a Multiscale Mechanistic Model for Predicting Tumor Response to Anti-miR-155
Dogra, P., Butner, J. D., Vittorio Cristini, C., & Wang, Z. (2024) · Annual International Conference of the IEEE Engineering in Medicine and Biology Society (EMBC) · doi:10.1109/embc53108.2024.10782406
Wijngaarden, J. E., Jauw, Y. W. S., Zwezerijnen, G. J. C., de Wit-van der Veen, B. J., Vugts, D. J., Zijlstra, J. M., van Dongen, G. A. M. S., Boellaard, R., van Oordt, C. W. M. D. H., & Huisman, M. C. (2024) · Figshare · doi:10.6084/m9.figshare.25231220
Truong, V. T., Lythe, G., Vicini, P., Yates, J. W. T., & Dubois, V. F. S. (2026) · Journal of Pharmacokinetics and Pharmacodynamics · doi:10.1007/s10928-026-10021-2
Vaidya, T. R., Geib, T., Lalezari, J. P., Bettacchi, C. J., Brinson, C. C., Ruane, P. J., Betman, H., Zhou, F., Krishnan, P., & Mostafa, N. M. (2026) · The Journal of Infectious Diseases · doi:10.1093/infdis/jiag142
Shi, Y., Gu, M., Yang, Y., Xu, S., He, Q., Li, P., Fu, Q., Yang, C., Xiang, X., Chen, J., et al. (2026) · Journal of Pharmacology and Experimental Therapeutics · doi:10.1016/j.jpet.2026.105025
Yamaguchi, D., Nogami, W., Sonoda, Y., Morihara, H., & Katsube, T. (2026) · CPT Pharmacometrics & Systems Pharmacology · doi:10.1002/psp4.70332
Karakousis, V. A., Sioga, A., Vizirianakis, I. S., Kesisoglou, I., Kosmidis, C. S., Pavlidis, L. C., & Papamitsou, T. (2026) · Cells · doi:10.3390/cells15191760
Metadata
- Authors
- Lindauer, A., Valiathan, C., Mehta, K., Sriram, V, de Greef, R., Elassaiss-Schaap, J., & de Alwis, D.
- Affiliations
- Merck & Co., Inc., Rahway, NJ, USA (United States) (US)
- Merck & Co., Inc.; Rahway New Jersey USA
- Venue
- CPT: Pharmacometrics & Systems Pharmacology
- Publisher
- Wiley
- Published
- 2016-11-08
- Volume
- 6
- Issue
- 1
- Pages
- 11-20
- ISSN
- 2163-8306 (ISSN-L)
- PMC
- PMC5270293
- OpenAlex
- W2554268745
- Cited by
- 120
- References
- 26
- Citations by year
- 2026: 8 · 2025: 6 · 2024: 18 · 2023: 5 · 2022: 20 · 2021: 11 · 2020: 14 · 2019: 16 · 2018: 11 · 2017: 7 · 2016: 3
- FWCI
- 6.64
- Type
- journal article
- Language
- en
- Open access
- gold
- doi.org
- Licence
- Locations
- CPT Pharmacometrics & Systems Pharmacology (publishedVersion, cc-by-nc-nd)
- Europe PMC (PubMed Central) (publishedVersion, cc-by-nc-nd)
- PubMed Central (publishedVersion, cc-by-nc-nd)
- PubMed (publishedVersion)
- Funders
- Gilead Sciences
- Topics
- Health Sciences › Medicine › Oncology › Cancer Immunotherapy and Biomarkers
- Life Sciences › Immunology and Microbiology › Immunology › Monoclonal and Polyclonal Antibodies Research
- Physical Sciences › Mathematics › Statistics and Probability › Statistical Methods in Clinical Trials
- Keywords
- pembrolizumab, PD-1 inhibitors, tumor growth inhibition, dose-ranging, receptor occupancy, compartmental pharmacokinetic model, monoclonal antibodies, cancer immunotherapy, dose-response relationship
- MeSH terms
- Animals, Antibodies, Monoclonal, Dose-Response Relationship, Drug, Humans, Mice, Inbred C57BL, Models, Biological, Tumor Burden, Mice, Rats, Translational Research, Biomedical, Programmed Cell Death 1 Receptor, Antibodies, Monoclonal, Humanized
About these checks
Registry, retraction, Cites and statistics results are computed, not judged, with one exception: a printed reference that no index lists is read once by a model before it counts as a citation error. Claims are extracted by a model and kept only when their quote appears verbatim in the text; each cited source is then checked, with a model’s help, for whether it says what the claim relies on. Those verdicts can be wrong — read the claim’s quote and the cited source before relying on one.
Statistics and arithmetic are recomputed, not judged.
Confidence bands are shown only for fields calibrated on our annotated test set. None is calibrated yet, so no band is shown.
What counts as a claim ›How we measure confidence ›How we check this ›
Are you an author, or do you see a problem with this page? Request a review
