

The DOI matches its Crossref record; 39 of the 39 references it cites were found in a registry or an index.
Prediction of liver toxicity and mode of action using metabolomics in vitro in HepG2 cells
Open accessAbstract
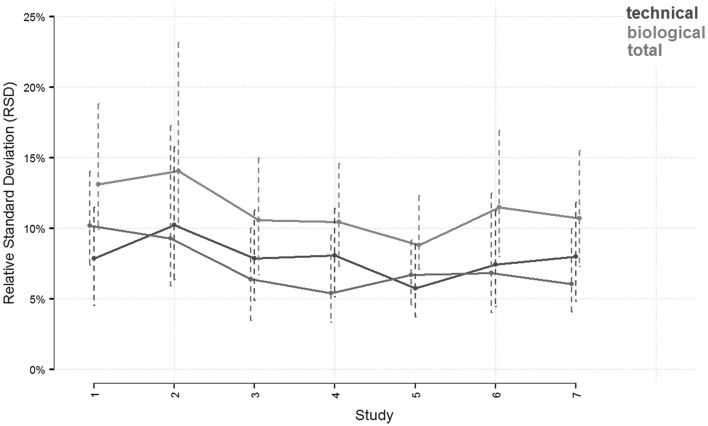
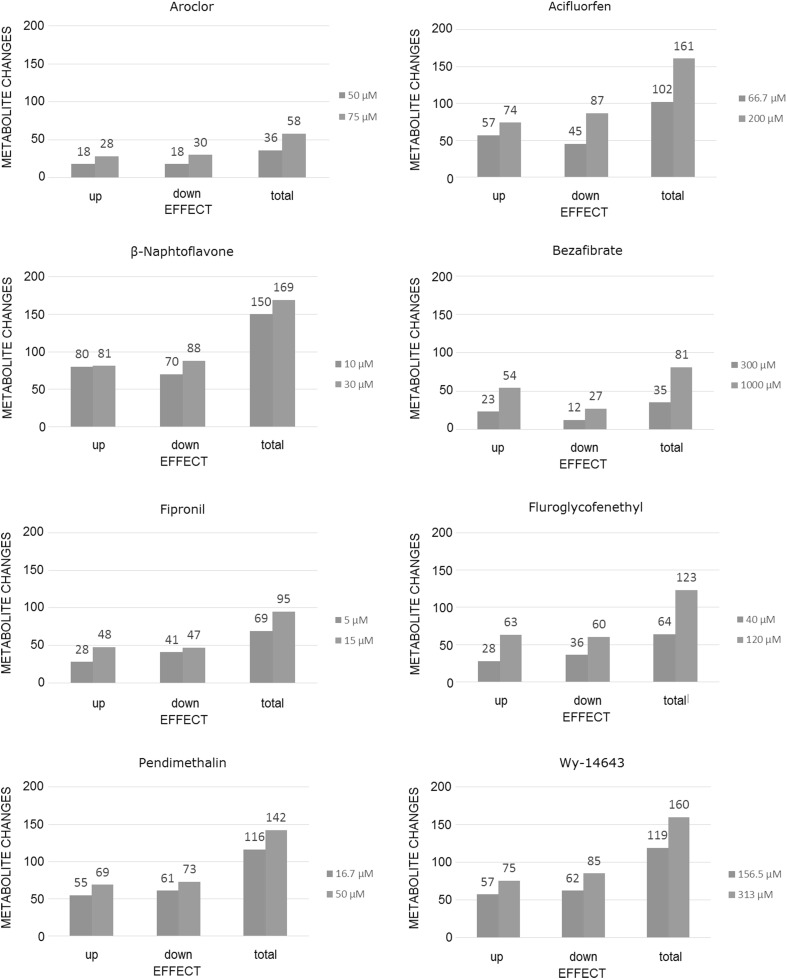
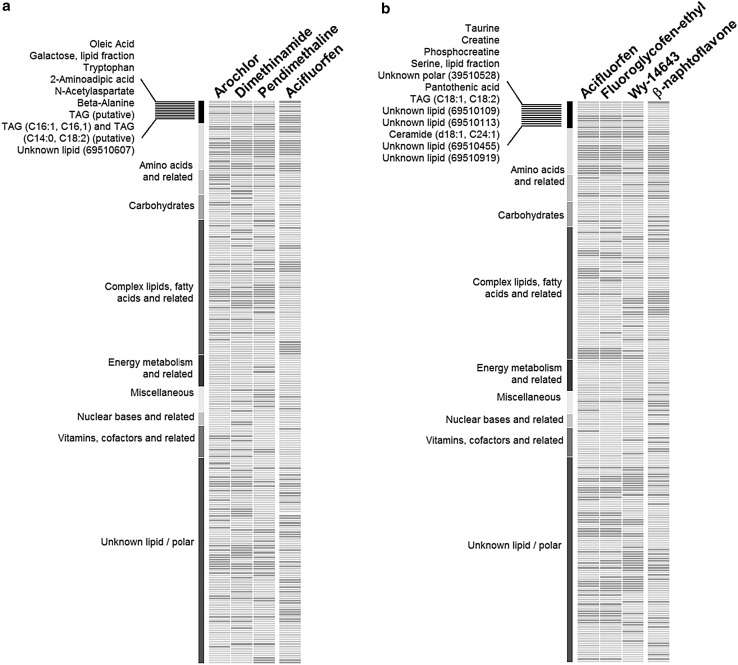
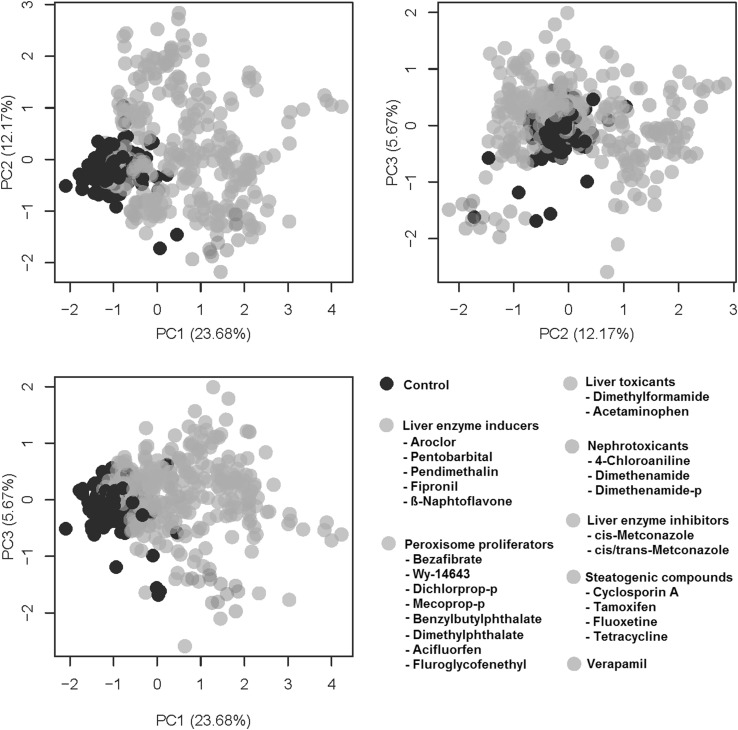
Liver toxicity is a leading systemic toxicity of drugs and chemicals demanding more human-relevant, high throughput, cost effective in vitro solutions. In addition to contributing to animal welfare, in vitro techniques facilitate exploring and understanding the molecular mechanisms underlying toxicity. New 'omics technologies can provide comprehensive information on the toxicological mode of action of compounds, as well as quantitative information about the multi-parametric metabolic response of cellular systems in normal and patho-physiological conditions. Here, we combined mass-spectroscopy metabolomics with an in vitro liver toxicity model. Metabolite profiles of HepG2 cells treated with 35 test substances resulted in 1114 cell supernatants and 3556 intracellular samples analyzed by metabolomics. Control samples showed relative standard deviations of about 10-15%, while the technical replicates were at 5-10%. Importantly, this procedure revealed concentration-response effects and patterns of metabolome changes that are consistent for different liver toxicity mechanisms (liver enzyme induction/inhibition, liver toxicity and peroxisome proliferation). Our findings provide evidence that identifying organ toxicity can be achieved in a robust, reliable, human-relevant system, representing a non-animal alternative for systemic toxicology.
Overview
The claims and statistics of this paper haven’t been checked yet.
Run the check — free, no account needed. It reads the open-access text and checks the sources it cites.
Integrity signals
Registry
Cites
Statistics
Figures

Verification
Claims the paper makes
The claims and statistics of this paper haven’t been checked yet.
Run the check — free, no account needed. It reads the open-access text and checks the sources it cites.
Claims other papers make about this one
Each is checked against this paper’s own text: does it say what the citing paper says it does?
The source backs part of the claim, not all of it — or backs it for a different population, condition or comparison.
In the citing paper
“Recent reviews and experimental studies directly interpret HepG2 as a model suitable for solving certain toxicological problems, in particular for studying general mechanisms of cytotoxicity and cellular stress response (e.g., activation of transcription factors activator protein-1 (AP1), p53, nuclear factor-erythroid 2 related factor 2 (Nrf2), and nuclear factor kappa B (NF-κB)) [109,110,111],”
From The HepG2 Cell Line as a Model for Studying Metabolic Dysfunction-Associated Steatotic Liver Disease (2026) · cites this paper as [110]
Experimental — accuracy not yet measured
Self-check
Percentages, sums and reported differences re-computed from the paper’s own numbers.
The self-check needs the paper’s full text.
Citations
Cites
Concordance of the toxicity of pharmaceuticals in humans and in animals
Olson, H., Betton, G., Robinson, D., Thomas, K., Monro, A., Kolaja, G., Lilly, P., Sanders, J., Sipes, G., Bracken, W., et al. (2000) · Regulatory Toxicology and Pharmacology · doi:10.1006/rtph.2000.1399 · Cited by 2,050
Wilkening, S., Stahl, F., & Bader, A. (2003) · Drug Metabolism and Disposition · doi:10.1124/dmd.31.8.1035 · Cited by 794
Gerets, H. H. J., Tilmant, K., Gerin, B., Chanteux, H., Depelchin, B. O., Dhalluin, S., & Atienzar, F. A. (2012) · Cell Biology and Toxicology · doi:10.1007/s10565-011-9208-4 · Cited by 698
Toxicology for the twenty-first century
Härtung, T. (2009) · Nature · doi:10.1038/460208a · Cited by 686
PPARα Agonist-Induced Rodent Tumors: Modes of Action and Human Relevance
Klaunig, J. E., Babich, M. A., Baetcke, K. P., Cook, J. C., Corton, J. C., David, R. M., DeLuca, J. G., Lai, D. Y., McKee, R. H., Peters, J. M., et al. (2003) · Critical Reviews in Toxicology · doi:10.1080/713608372 · Cited by 614
Acetaminophen activation by human liver cytochromes P450IIE1 and P450IA2
Raucy, J. L., Lasker, J. M., Lieber, C. S., & Black, M. (1989) · Archives of Biochemistry and Biophysics · doi:10.1016/0003-9861(89)90278-6 · Cited by 478
Regulation of bile acid synthesis
Chiang, J. Y. L. (1998) · Frontiers in bioscience · doi:10.2741/a273 · Cited by 400
Metabolomics in toxicology and preclinical research
Ramı́rez, T. (2013) · ALTEX · doi:10.14573/altex.2013.2.209 · Cited by 221
Self-citationThe use of metabolomics for the discovery of new biomarkers of effect
van Ravenzwaay, B., Cunha, G. C.-P., Leibold, E., Looser, R., Mellert, W., Prokoudine, A., Walk, T. B., & Wiemer, J. C. (2007) · Toxicology Letters · doi:10.1016/j.toxlet.2007.05.021 · Cited by 207
Self-citationBouhifd, M., Härtung, T., Högberg, H. T., Kleensang, A., & Zhao, L. (2013) · Journal of Applied Toxicology · doi:10.1002/jat.2874 · Cited by 200
Research works printed but not linked: 1
- HSE (1992) Evaluation on: fluoroglycofen-ethyl. May 1992. Issue No. 50. Department for Environment, Food and Rural Affairs. Pesticides Safety Directorate, UK
Cited by
Sorted by citations
Investigating landfill leachate toxicity in vitro: A review of cell models and endpoints
Baderna, D., Caloni, F., & Benfenati, E. (2018) · Environment International · doi:10.1016/j.envint.2018.11.024 · Cited by 148
The exposome – a new approach for risk assessment
Sillé, F. C. M. (2020) · ALTEX · doi:10.14573/altex.2001051 · Cited by 102
Alotaibi, A. M., Alsaleh, N. B., Aljasham, A. T., Tawfik, E. A., Almutairi, M. M., Almutairi, M. M., Alkholief, M. A., & Almutairi, M. M. (2022) · Antibiotics · doi:10.3390/antibiotics11091219 · Cited by 67
In vitro assessment of hepatotoxicity by metabolomics: a review
Cuykx, M., Rodrigues, R. M., Laukens, K., Vanhaecke, T., & Covaci, A. (2018) · Archives of Toxicology · doi:10.1007/s00204-018-2286-9 · Cited by 67
Moné, M. J., Pallocca, G., Escher, S. E., Exner, T. E., Herzler, M., Bennekou, S. H., Kamp, H., Kroese, E. D., Leist, M., Steger‐Hartmann, T., et al. (2020) · Archives of Toxicology · doi:10.1007/s00204-020-02866-4 · Cited by 62
Self-citationPalermo, A. (2022) · Drug Discovery Today · doi:10.1016/j.drudis.2022.103460 · Cited by 51
Zhang, L., Niu, M., Wei, A.-W., Tang, J.-F., Tu, C., Bai, Z.-F., Zou, Z.-S., Xiao, X.-H., Liu, Y.-P., & Wang, J.-B. (2020) · Archives of Toxicology · doi:10.1007/s00204-019-02595-3 · Cited by 49
Application of NMR metabolomics to search for human disease biomarkers in blood
Song, Z., Wang, H., Yin, X., Deng, P., & Jiang, W. (2018) · Clinical Chemistry and Laboratory Medicine (CCLM) · doi:10.1515/cclm-2018-0380 · Cited by 52
Behrends, V., Giskeødegård, G. F., Bravo-Santano, N., Letek, M., & Keun, H. C. (2018) · Archives of Toxicology · doi:10.1007/s00204-018-2371-0 · Cited by 45
Zhang, R., Yao, Y., Tu, L., Luan, T., & Chen, B. (2020) · Journal of Hazardous Materials · doi:10.1016/j.jhazmat.2020.125017 · Cited by 45
Wu, X., Jiang, D., Yang, Y. A., Li, S., & Ding, Q. (2023) · Cell Regeneration · doi:10.1186/s13619-022-00148-1 · Cited by 48
Lackmann, C., Velki, M., Bjedov, D., Ečimović, S., Seiler, T., & Hollert, H. (2021) · Environmental Sciences Europe · doi:10.1186/s12302-021-00455-5 · Cited by 43
Analytical and Omics-Based Advances in the Study of Drug-Induced Liver Injury
Kralj, T., Brouwer, K. L. R., & Creek, D. J. (2021) · Toxicological Sciences · doi:10.1093/toxsci/kfab069 · Cited by 43
HPLC analysis, cytotoxicity, and safety study ofMoringa oleiferaLam. (wild type) leaf extract
Saleem, A., Saleem, M., Akhtar, M. F., Baig, M. M. F. A., & Rasul, A. (2020) · Journal of Food Biochemistry · doi:10.1111/jfbc.13400 · Cited by 42
In vitro and in silico liver models: Current trends, challenges and opportunities
Poloznikov, A. A. (2018) · ALTEX · doi:10.14573/altex.1803221 · Cited by 41
Remya, C., Dileep, K. V., Reddy, E. K., Mantosh, K., Kesavan, L., Jacob, R. S., Sajith, A. M., Variyar, E. J., Anwar, S., Zhang, K. Y. J., et al. (2021) · Computational and Structural Biotechnology Journal · doi:10.1016/j.csbj.2021.07.041 · Cited by 42
Smart, D. J., & Phillips, G. J. (2020) · Journal of Applied Toxicology · doi:10.1002/jat.4064 · Cited by 39
Metabolomics based comprehensive investigation of Gardeniae Fructus induced hepatotoxicity
Luo, Y., Gao, F., Chang, R., Zhang, X., Zhong, J., Wen, J., Wu, J., & Zhou, T. (2021) · Food and Chemical Toxicology · doi:10.1016/j.fct.2021.112250 · Cited by 39
Metabolomics in Preclinical Drug Safety Assessment: Current Status and Future Trends
Sillé, F. C. M., & Härtung, T. (2024) · Metabolites · doi:10.3390/metabo14020098 · Cited by 38
Fahy, K. M., Eiken, M. K., Baumgartner, K. V., Leung, K. Q., Anderson, S. E., Berggren, E., Bouzos, E., Schmitt, L. R., Asuri, P., & Wheeler, K. E. (2023) · ACS Omega · doi:10.1021/acsomega.2c06882 · Cited by 37
Mizoi, K., Arakawa, H., Yano, K., Koyama, S., Kojima, H., & Ogihara, T. (2020) · Biomedicines · doi:10.3390/biomedicines8100374 · Cited by 37
Bowen, T. J., Southam, A. D., Hall, A. R., Weber, R. J. M., Lloyd, G. R., Macdonald, R., Wilson, A., Pointon, A., & Viant, M. R. (2023) · Nature Communications · doi:10.1038/s41467-023-40333-7 · Cited by 36
Yang, J., Khorsandi, D., Trabucco, L., Ahmed, M., Khademhosseini, A., Dokmeci, M. R., Ye, J. Y., & Jucaud, V. (2024) · Small · doi:10.1002/smll.202403560 · Cited by 35
Modeling drug-induced liver injury: current status and future prospects
Zeo-Sánchez, D. E. D., Segovia‐Zafra, A., Matilla‐Cabello, G., Pinazo-Bandera, J. M., Andrade, R. J., Lucena, M. I., & Paz, M. V. (2022) · Expert Opinion on Drug Metabolism & Toxicology · doi:10.1080/17425255.2022.2122810 · Cited by 33
Proteomic responses of HepG2 cell monolayers and 3D spheroids to selected hepatotoxins
Hurrell, T., Lilley, K. S., & Cromarty, D. (2018) · Toxicology Letters · doi:10.1016/j.toxlet.2018.10.030 · Cited by 32
Martínez-Sena, T., Moro, E., Moreno‐Torres, M., Quintás‐Cardama, A., Hengstler, J. G., & Castell, J. V. (2023) · Archives of Toxicology · doi:10.1007/s00204-023-03474-8 · Cited by 31
Żyro, D., Radko, L., Śliwińska, A., Chęcińska, L., Kusz, J., Korona‐Głowniak, I., Przekora, A., Wójcik, M., Posyniak, A., & Ochocki, J. (2022) · Cancers · doi:10.3390/cancers14040900 · Cited by 30
Jiang, J., Pieterman, C., Ertaylan, G., Peeters, R., & de Kok, T. M. C. M. (2019) · Archives of Toxicology · doi:10.1007/s00204-019-02585-5 · Cited by 32
Malinowska, J. M., & Viant, M. R. (2019) · Current Opinion in Toxicology · doi:10.1016/j.cotox.2019.03.006 · Cited by 28
A Computational Workflow for Probabilistic Quantitative in Vitro to in Vivo Extrapolation
McNally, K., Hogg, A., & Loizou, G. D. (2018) · Frontiers in Pharmacology · doi:10.3389/fphar.2018.00508 · Cited by 27
Toxicogenomics of drug induced liver injury – from mechanistic understanding to early prediction.
Lauschke, V. M. (2021) · Drug Metabolism Reviews · doi:10.1080/03602532.2021.1894571 · Cited by 29
Integrating in vitro metabolomics with a 96-well high-throughput screening platform
Malinowska, J. M., Palosaari, T., Sund, J., Carpi, D., Bouhifd, M., Weber, R. J. M., Whelan, M., & Viant, M. R. (2022) · Metabolomics · doi:10.1007/s11306-021-01867-3 · Cited by 25
Moreno‐Torres, M., García-Llorens, G., Moro, E., Méndez, R., Quintás‐Cardama, A., & Castell, J. V. (2021) · Scientific Reports · doi:10.1038/s41598-021-01652-1 · Cited by 24
Wurm, K. W., Bartz, F., Schulig, L., Bodtke, A., Bednarski, P. J., & Link, A. (2022) · ACS Omega · doi:10.1021/acsomega.1c07103 · Cited by 24
Cabaton, N. J., Poupin, N., Canlet, C., Tremblay‐Franco, M., Audebert, M., Cravedi, J., Riu, A., Jourdan, F., & Zalko, D. (2018) · Frontiers in Endocrinology · doi:10.3389/fendo.2018.00571 · Cited by 24
Morad, H. M., Abou‐Elzahab, M. M., Aref, S., & El-Sokkary, A. M. A. (2022) · ACS Omega · doi:10.1021/acsomega.2c00083 · Cited by 25
Commentary: Novel strategies and new tools to curtail the health effects of pesticides
Benbrook, C., Perry, M. J., Belpoggi, F., Landrigan, P. J., Perro, M., Mandrioli, D., Antoniou, M. N., Winchester, P., & Mesnage, R. (2021) · Environmental Health · doi:10.1186/s12940-021-00773-4 · Cited by 24
Zhang, R., Chen, B., Lin, L., Zhang, H., & Luan, T. (2021) · The Science of The Total Environment · doi:10.1016/j.scitotenv.2021.145329 · Cited by 22
Acoustic Mist Ionization Mass Spectrometry for Ultrahigh-Throughput Metabolomics Screening
Smith, M. J., Ivanov, D. P., Weber, R. J. M., Wingfield, J. M., & Viant, M. R. (2021) · Analytical Chemistry · doi:10.1021/acs.analchem.1c01616 · Cited by 22
Toxicity prediction using target, interactome, and pathway profiles as descriptors
Füzi, B., Mathai, N., Kirchmair, J., & Ecker, G. F. (2023) · Toxicology Letters · doi:10.1016/j.toxlet.2023.04.005 · Cited by 22
Cuyàs, E., Verdura, S., Micol, V., Joven, J., Bosch‐Barrera, J., Encinar, J. A., & Menéndez, J. A. (2019) · Food and Chemical Toxicology · doi:10.1016/j.fct.2019.110645 · Cited by 23
Wurm, K. W., Bartz, F., Schulig, L., Bodtke, A., Bednarski, P. J., & Link, A. (2022) · ChemMedChem · doi:10.1002/cmdc.202200262 · Cited by 19
Malinowska, J. M., Palosaari, T., Sund, J., Carpi, D., Weber, R. J. M., Lloyd, G. R., Whelan, M., & Viant, M. R. (2023) · Archives of Toxicology · doi:10.1007/s00204-022-03439-3 · Cited by 20
The ligand exchange of citrates to thioabiraterone on gold nanoparticles for prostate cancer therapy
Stolarczyk, E. U., Leś, A., Łaszcz, M., Kubiszewski, M., Strzempek, W., Menaszek, E., Fusaro, M., Sidoryk, K., & Stolarczyk, K. (2020) · International Journal of Pharmaceutics · doi:10.1016/j.ijpharm.2020.119319 · Cited by 20
Stryjska, K., Radko, L., Chęcińska, L., Kusz, J., Posyniak, A., & Ochocki, J. (2020) · International Journal of Molecular Sciences · doi:10.3390/ijms21103629 · Cited by 20
The enantioselective study of the toxicity effects of chiral acetochlor in HepG2 cells
Wang, S., Zhang, Y., Gao, J., Zhang, J., Tao, L., & Xu, W. (2021) · Ecotoxicology and Environmental Safety · doi:10.1016/j.ecoenv.2021.112261 · Cited by 18
Olive Mill Wastewater Fermented with Microbial Pools as a New Potential Functional Beverage
Foti, P., Occhipinti, P. S., Russo, N., Scilimati, A., Miciaccia, M., Caggia, C., Perrone, M. G., Randazzo, C. L., & Romeo, F. V. (2023) · Molecules · doi:10.3390/molecules28020646 · Cited by 18
de Andrade, P., Dias, A. D. F., Figueiró, F., Torres, F., Kawano, D. F., Battastini, A. M. O., Carvalho, I., da Silva, C. H. T. D. P., & Rosa, J. M. C. (2020) · Future Medicinal Chemistry · doi:10.4155/fmc-2019-0227 · Cited by 18
Azevedo, L. F., Masiero, M. M., Cherkaoui, S., Carneiro, M. F. H., Barbosa, F., & Zamboni, N. (2022) · Food and Chemical Toxicology · doi:10.1016/j.fct.2022.113266 · Cited by 17
Guillon, J., Cohen, A., Boudot, C., Monic, S., Savrimoutou, S., Moreau, S., Albenque-Rubio, S., Lafon-Schmaltz, C., Dassonville‐Klimpt, A., Mergny, J., et al. (2022) · Pathogens · doi:10.3390/pathogens11111339 · Cited by 17
Pasqualetto, G., Schepelmann, M., Varricchio, C., Pileggi, E., Khogali, C., Morgan, S. R., Boostrom, I., Rôżanowska, M., Brancale, A., Ferla, S., et al. (2020) · Molecules · doi:10.3390/molecules25214904 · Cited by 17
Li, L., Zou, T., Liang, M., Mezhuev, Y. O., Tsatsakis, A. M., Djordjević, A. B., Lan, M., Liu, F., Cai, T., Gong, P., et al. (2021) · European Journal of Pharmaceutics and Biopharmaceutics · doi:10.1016/j.ejpb.2021.05.025 · Cited by 17
Ndlovu, S. S., Chuturgoon, A. A., & Ghazi, T. (2023) · Plants · doi:10.3390/plants12071541 · Cited by 15
Bian, G., Yang, J. B., Elango, J., Wu, W., Bao, B., & Bao, C. (2021) · Chemistry & Biodiversity · doi:10.1002/cbdv.202001030 · Cited by 16
Towards a clinical application of freeze-dried squalene-based nanomedicines
Rouquette, M., Roux, K. S., Polrot, M., Bourgaux, C., Michel, J., Testard, F., Gobeaux, F., & Lepêtre‐Mouelhi, S. (2019) · Journal of drug targeting · doi:10.1080/1061186x.2019.1566340 · Cited by 14
Influence of Antibiotics on Functionality and Viability of Liver Cells In Vitro
Doß, S., Blessing, C., Haller, K., Richter, G., & Sauer, M. (2022) · Current Issues in Molecular Biology · doi:10.3390/cimb44100317 · Cited by 13
Sun, J., Zhang, K., Yin, Y., Qi, Y., Li, S., Sun, H., Luo, M., Sun, Y., Yu, Z., Yang, J., et al. (2023) · Toxics · doi:10.3390/toxics11120984 · Cited by 13
Leão, T. K., Ribeiro, D. L., Machado, A. R. T., Costa, T. R., Sampaio, S. V., & Antunes, L. M. G. (2021) · Mutation Research/Genetic Toxicology and Environmental Mutagenesis · doi:10.1016/j.mrgentox.2021.503375 · Cited by 13
Hematopoietic effect of echinochrome on phenylhydrazine-induced hemolytic anemia in rats
El-Shehry, M. S. E. F., Amrymi, R. A., Atia, T. A., Lotfy, B. M. M., Ahmed, S. H. A.-F., Qutb, S. A., Ali, S. B., Mohamed, A. S., Mousa, M. R., Damanhory, A. A., et al. (2023) · PeerJ · doi:10.7717/peerj.16576 · Cited by 13
Fundamentals of environmental metabolomics
Kovacevic, V., & Simpson, M. J. (2020) · Elsevier eBooks · doi:10.1016/b978-0-12-818196-6.00001-7 · Cited by 15
Sun, S.-T., Wang, M., Yu, Y., Wang, S., Ding, H., Liang, C., Li, X., Fan, S., & Li, Y. (2022) · Toxicology Letters · doi:10.1016/j.toxlet.2022.05.002 · Cited by 13
Dynamic Metabolic and Transcriptional Responses of Proteasome-Inhibited Neurons
Suciu, I., Delp, J., Gutbier, S., Ückert, A.-K., Spreng, A.-S., Eberhard, P., Karreman, C., Schreiber, F., Madjar, K., Rahnenführer, J., et al. (2023) · Antioxidants · doi:10.3390/antiox12010164 · Cited by 11
A high-throughput metabolomics in vitro platform for the characterization of hepatotoxicity
Ramirez‐Hincapie, S., Birk, B., Ternes, P., Giri, V., Haake, V., Herold, M. J., Zickgraf, F. M., Verlohner, A., Huener, H.-A., Kamp, H., et al. (2023) · Cell Biology and Toxicology · doi:10.1007/s10565-023-09809-6 · Cited by 12
Self-citationvan Wyk, R. J., Serem, J. C., Oosthuizen, C. B., Semenya, D., Serian, M., Lorenz, C. D., Mason, A. J., Bester, M. J., & Gaspar, A. R. M. (2025) · Biochemistry · doi:10.1021/acs.biochem.4c00580 · Cited by 12
Low concentrations of 4-ABP promote liver carcinogenesis in human liver cells and a zebrafish model
Lin, H.-D., Tseng, Y., Yuh, C., & Chen, S. (2021) · Journal of Hazardous Materials · doi:10.1016/j.jhazmat.2021.126954 · Cited by 12
Federico, L. B., Silva, G. M., Dias, A. D. F., Figueiró, F., Battastini, A. M. O., Santos, C. B. R., da Costa, L. T., Rosa, J. M. C., & da Silva, C. H. T. D. P. (2020) · International Journal of Biological Macromolecules · doi:10.1016/j.ijbiomac.2020.10.136 · Cited by 13
Ramirez‐Hincapie, S., Birk, B., Ternes, P., Giri, V., Zickgraf, F. M., Haake, V., Herold, M. J., Kamp, H., Driemert, P., Landsiedel, R., et al. (2023) · Archives of Toxicology · doi:10.1007/s00204-023-03572-7 · Cited by 11
Self-citationSarkar, K., Chatterjee, A., Bankura, B., Bank, S., Paul, N., Chatterjee, S., Das, A., Dutta, K., Chakraborty, S., De, S., et al. (2024) · PLoS ONE · doi:10.1371/journal.pone.0307166 · Cited by 16
Wilhelmi, P., Giri, V., Zickgraf, F. M., Haake, V., Henkes, S., Driemert, P., Michaelis, P., Busch, W., Scholz, S., Flick, B., et al. (2023) · Chemico-Biological Interactions · doi:10.1016/j.cbi.2023.110565 · Cited by 11
Self-citationFan, S., Zhou, Y., Zhao, Y., Daglia, M., Zhang, J., Zhu, Y. G., Bai, J., Zhu, L., & Xiao, X. (2023) · International Journal of Biological Macromolecules · doi:10.1016/j.ijbiomac.2023.126861 · Cited by 11
Novel approaches to liver disease diagnosis and modeling
de Oliveira, A. G., & Fiorotto, R. (2020) · Translational Gastroenterology and Hepatology · doi:10.21037/tgh-20-109 · Cited by 10
Li, J., Xu, Z.-Y., Li, M., Zheng, W.-L., Huang, X., Xiao, F., Cui, Y., & Pan, H. (2020) · Chemico-Biological Interactions · doi:10.1016/j.cbi.2020.109212 · Cited by 11
Zahedi, M., Yousefi, M., Abounoori, M., Malekan, M., Tajik, F., Heydari, K., Mortazavi, P., Ghahramani, S., Ghazaeian, M., Sheydaee, F., et al. (2021) · PubMed Central · doi:10.30476/ijms.2021.87555.1793 · Cited by 11
Highlight report: Metabolomics in hepatotoxicity testing
Ghallab, A. (2017) · EXCLI journal · doi:10.17179/excli2017-1041 · Cited by 10
Kang, J., Jeong, Y., Ha, S. K., Lee, H. H., & Lee, K. (2023) · Molecular Biology Reports · doi:10.1007/s11033-022-08130-5 · Cited by 10
Abegg, V. F., Panajatovic, M. V., Mancuso, R. V., Allard, J. A., Duthaler, U., Odermatt, A., Krähenbühl, S., & Bouitbir, J. (2024) · Toxicology Letters · doi:10.1016/j.toxlet.2024.01.008 · Cited by 10
Zhang, H., Hao, H., Fan, W., Gao, W., & Liang, J. L. (2025) · Journal of Applied Toxicology · doi:10.1002/jat.4771 · Cited by 10
Cohn, W., Campagna, J. J., Wi, D., Lee, J. T., Beniwal, S., Elezi, G., Zhu, C., Jagodzinska, B. M., Whitelegge, J. P., Damoiseaux, R. D., et al. (2025) · npj Drug Discovery. · doi:10.1038/s44386-025-00009-2 · Cited by 11
Singh, V., Sandhir, R., & Singhal, N. K. (2020) · Materials Today Proceedings · doi:10.1016/j.matpr.2020.06.590 · Cited by 10
Kaiser, L., Weinschrott, H., Quint, I., Wenzel, F., Blaess, M. F., Jung, M., Kohl, M., & Deigner, H. (2020) · International Journal of Molecular Sciences · doi:10.3390/ijms21176092 · Cited by 10
Kwok, M. L., Li, Z. P., Law, T. Y. S., & Chan, K. M. (2020) · Toxicology Reports · doi:10.1016/j.toxrep.2020.11.005 · Cited by 10
LC–MS-Based Metabolomics in the Study of Drug-Induced Liver Injury
Lu, Y., Zhao, X., Hu, Z., Wang, L. A., & Li, F. (2018) · Current Pharmacology Reports · doi:10.1007/s40495-018-0144-3 · Cited by 11
Mitochondrial Respiratory Complexes as Targets of Drugs: The PPAR Agonist Example
Bottoni, P., Pontoglio, A., Scarà, S., Pieroni, L., Urbani, A., & Scatena, R. (2022) · Cells · doi:10.3390/cells11071169 · Cited by 10
Wurm, K. W., Bartz, F., Schulig, L., Bodtke, A., Bednarski, P. J., & Link, A. (2022) · Archiv der Pharmazie · doi:10.1002/ardp.202200473 · Cited by 10
Zhao, J., Li, J., Zhang, X., Shi, S., Wang, L., Yuan, M., Liu, Y., & Wang, Y. (2023) · Molecules · doi:10.3390/molecules28041932 · Cited by 9
Jacques, C., Jamin, E. L., Jouanin, I., Canlet, C., Tremblay‐Franco, M., Martin, J., Zalko, D., Brunel, Y., Bessou‐Touya, S., Debrauwer, L., et al. (2021) · Archives of Toxicology · doi:10.1007/s00204-021-03136-7 · Cited by 9
Štancl, P., Gršković, P., Držaić, S., Vičić, A., Karlić, R., & Korać, P. (2024) · Genes · doi:10.3390/genes15111460 · Cited by 9
Pasqualetto, G., Pileggi, E., Schepelmann, M., Varricchio, C., Rôżanowska, M., Brancale, A., & Bassetto, M. (2021) · European Journal of Medicinal Chemistry · doi:10.1016/j.ejmech.2021.113841 · Cited by 8
Alehashem, M. S., Mamet, S. D., Hogan, N., Hecker, M., Florou, D., Tsatsakis, A. M., & Siciliano, S. D. (2022) · Food and Chemical Toxicology · doi:10.1016/j.fct.2022.113502 · Cited by 10
Shin, B., Hong, S. H., Seo, S., Jeong, C. H., Kim, J., Bae, E., Lee, D., Shin, J. H., Shim, M., Han, S. B., et al. (2023) · Toxics · doi:10.3390/toxics11020101 · Cited by 8
Albenque-Rubio, S., Guillon, J., Cohen, A., Agnamey, P., Savrimoutou, S., Moreau, S., Mergny, J., Ronga, L., Kanavos, I., Moukha, S., et al. (2023) · Drugs and Drug Candidates · doi:10.3390/ddc2030033 · Cited by 7
Łysakowska, M., Głowacka, I. E., Honkisz-Orzechowska, E., Handzlik, J., & Piotrowska, D. G. (2024) · Molecules · doi:10.3390/molecules29133050 · Cited by 7
Fan, X., Wang, X., Lian, J., Pei, Z., Jiang, M., & Bai, M. (2022) · Evidence-based Complementary and Alternative Medicine · doi:10.1155/2022/8158699 · Cited by 7
Watafua, M., Ejiofor, J. I., Musa, A., & Ahmad, M. H. (2022) · Frontiers in Pharmacology · doi:10.3389/fphar.2022.959661 · Cited by 7
Multitargeting Histamine H3 Receptor Ligands among Acetyl- and Propionyl-Phenoxyalkyl Derivatives
Łażewska, D., Kaleta, M., Zaręba, P., Godyń, J., Dubiel, M., Honkisz-Orzechowska, E., Doroż-Płonka, A., Więckowska, A., Stark, H., & Kieć‐Kononowicz, K. (2023) · Molecules · doi:10.3390/molecules28052349 · Cited by 7
Radko, L., Śniegocki, T., Sell, B., & Posyniak, A. (2019) · Animals · doi:10.3390/ani10010030 · Cited by 7
Bellini, C., Atxabal, U., Bősze, S. E., Dobay, O., Horváth, A., Szigyártó, I. C., Beke‐Somfai, T., Jiménez‐Barbero, J., Puskás, I., & Horváti, K. (2025) · Aggregate · doi:10.1002/agt2.741 · Cited by 6
Siricilla, S., Hansen, C. J., Rogers, J. H., De, D., Simpson, C. L., Waterson, A. G., Sulikowski, G. A., Crockett, S. L., Boatwright, N., Reese, J., et al. (2023) · Pharmacological Research · doi:10.1016/j.phrs.2023.106876 · Cited by 6
Jabłońska‐Trypuć, A. (2021) · Environments · doi:10.3390/environments8060054 · Cited by 6
Bowen, T. J., Hall, A. R., Lloyd, G. R., Weber, R. J. M., Wilson, A., Pointon, A., & Viant, M. R. (2021) · Metabolites · doi:10.3390/metabo11090644 · Cited by 6
Metadata
- Authors
- Ramirez, T., Strigun, A., Verlohner, A., Huener, H.-A., Peter, E., Herold, M., Bordag, N., Mellert, W., Walk, T., Spitzer, M., Jiang, X., Sperber, S., Hofmann, T., Hartung, T., Kamp, H., & van Ravenzwaay, B.
- Affiliations
- BASF (Germany) (DE)
- Corresponding author
- Hofmann, Thomas
- ORCID
- Venue
- Archives of Toxicology
- Published
- 2017-09-30
- Volume
- 92
- Issue
- 2
- Pages
- 893-906
- ISSN
- 0340-5761 (ISSN-L)
- 1432-0738
- PMC
- PMC5818600
- OpenAlex
- W2759884959
- Cited by
- 164
- References
- 39
- Citations by year
- 2026: 14 · 2025: 13 · 2024: 14 · 2023: 26 · 2022: 25 · 2021: 25 · 2020: 23 · 2019: 13 · 2018: 10 · 2017: 1
- FWCI
- 13.67
- Type
- journal article
- Language
- en
- Open access
- hybrid
- doi.org
- Locations
- Archives of Toxicology (publishedVersion, cc-by)
- Europe PMC (PubMed Central) (publishedVersion, cc-by)
- PubMed Central (publishedVersion, cc-by)
- PubMed (publishedVersion)
- KOPS (University of Konstanz) (submittedVersion, cc-by)
- Topics
- Life Sciences › Pharmacology, Toxicology and Pharmaceutics › Pharmacology › Drug-Induced Hepatotoxicity and Protection
- Life Sciences › Biochemistry, Genetics and Molecular Biology › Molecular Biology › Metabolomics and Mass Spectrometry Studies
- Health Sciences › Veterinary › Small Animals › Animal testing and alternatives
- Keywords
- hepatotoxicity, metabolomics, HepG2 cells, in vitro toxicity models, mechanism of action, non-animal alternatives, liver enzyme induction, liver enzyme inhibition, peroxisome proliferation, concentration-dependent effects, intracellular metabolites, mass spectrometry metabolomics
- MeSH terms
- Animal Testing Alternatives, Enzyme Induction, Humans, Liver, Toxicity Tests, Metabolomics, Metabolome, Hep G2 Cells
About these checks
Registry, retraction, Cites and statistics results are computed, not judged, with one exception: a printed reference that no index lists is read once by a model before it counts as a citation error. Claims are extracted by a model and kept only when their quote appears verbatim in the text; each cited source is then checked, with a model’s help, for whether it says what the claim relies on. Those verdicts can be wrong — read the claim’s quote and the cited source before relying on one.
Statistics and arithmetic are recomputed, not judged.
Confidence bands are shown only for fields calibrated on our annotated test set. None is calibrated yet, so no band is shown.
What counts as a claim ›How we measure confidence ›How we check this ›
Are you an author, or do you see a problem with this page? Request a review
