

The DOI matches its Crossref record; 32 of the 33 references it cites were found in a registry or an index.
Harmonizing FDG PET quantification while maintaining optimal lesion detection: prospective multicentre validation in 517 oncology patients
Open accessAbstract
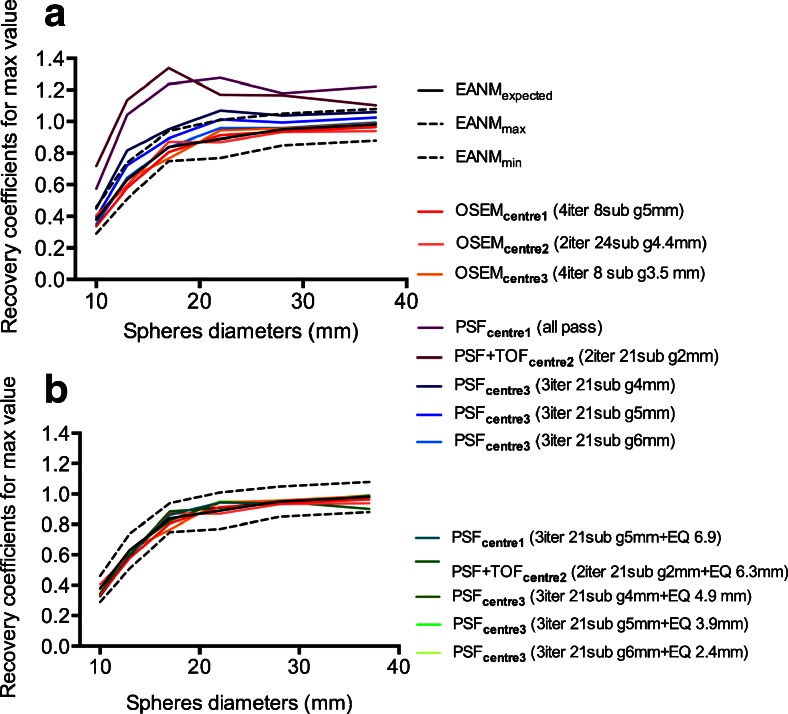
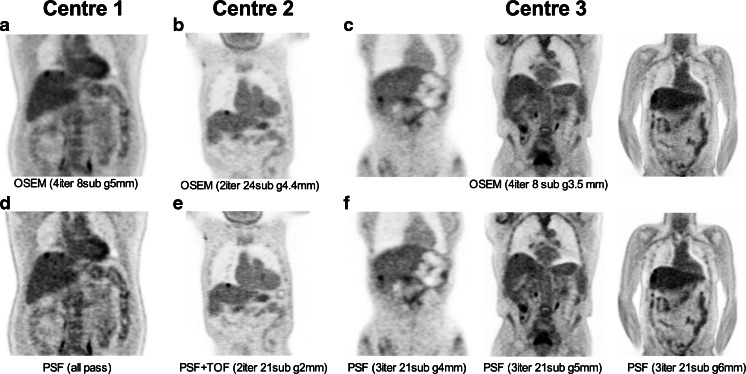
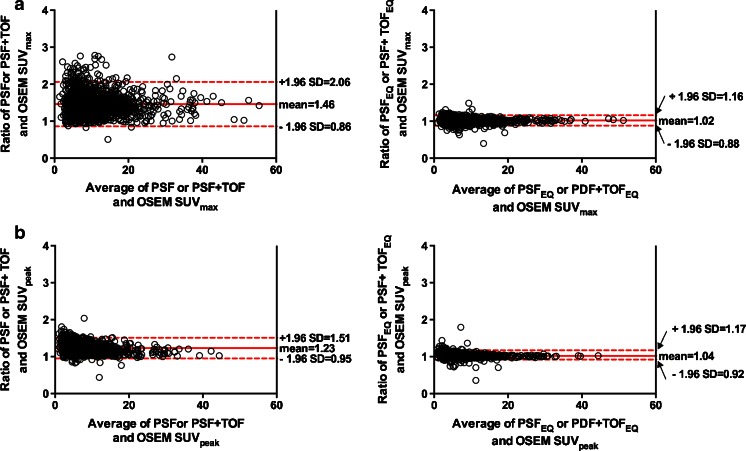
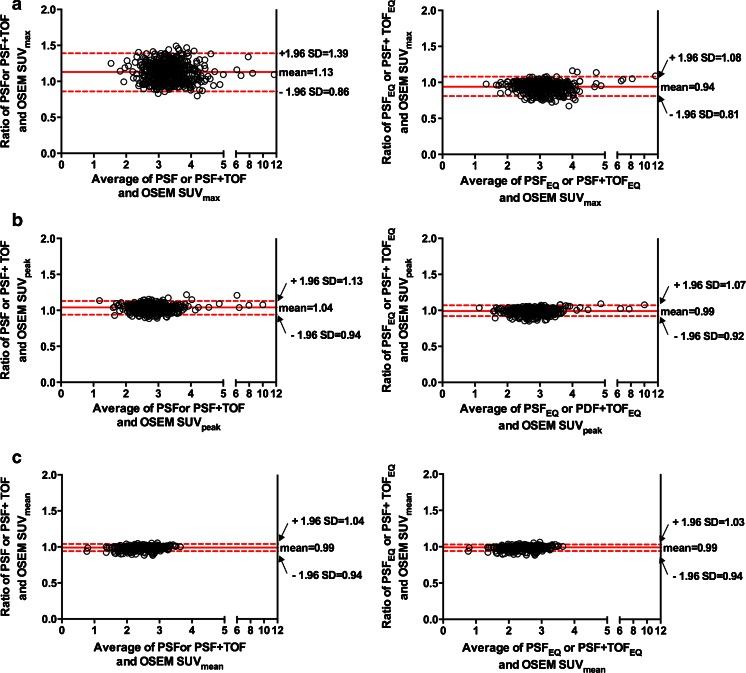
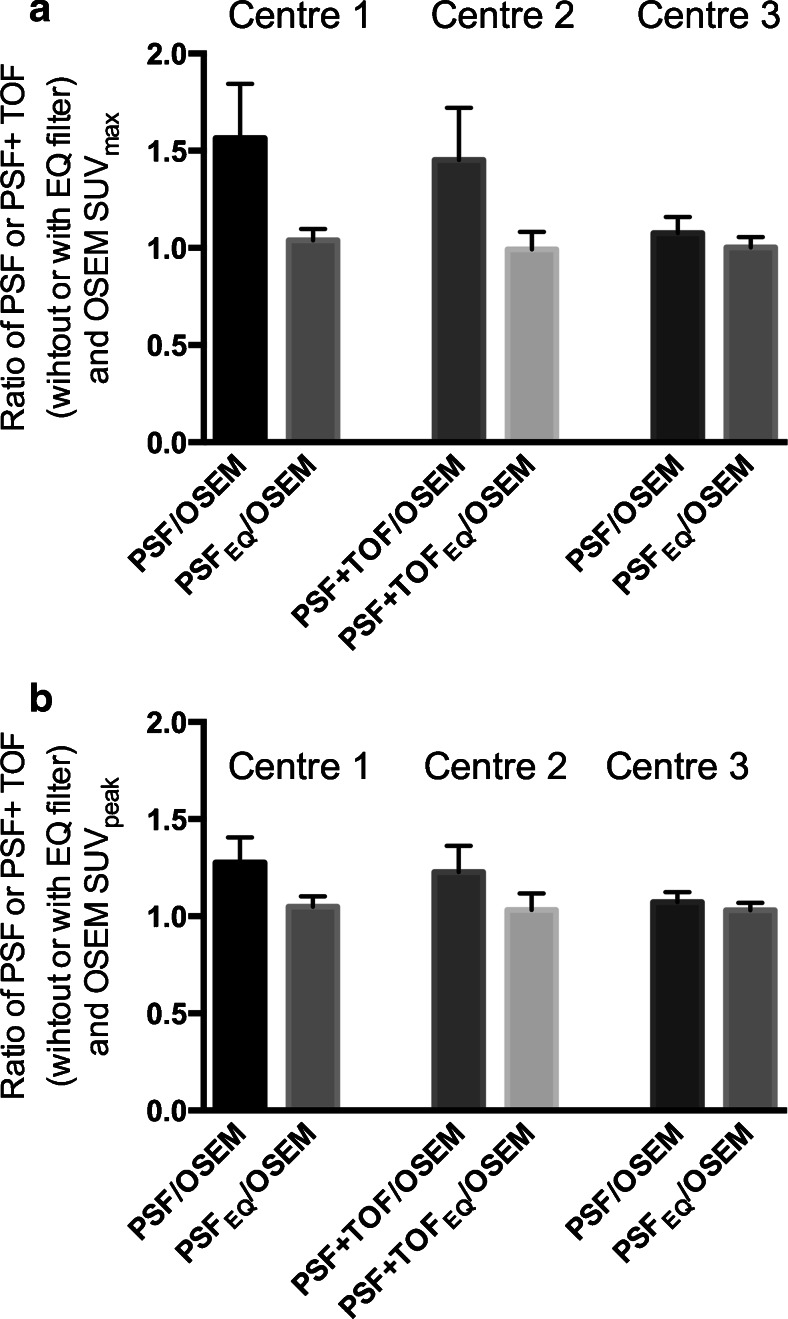
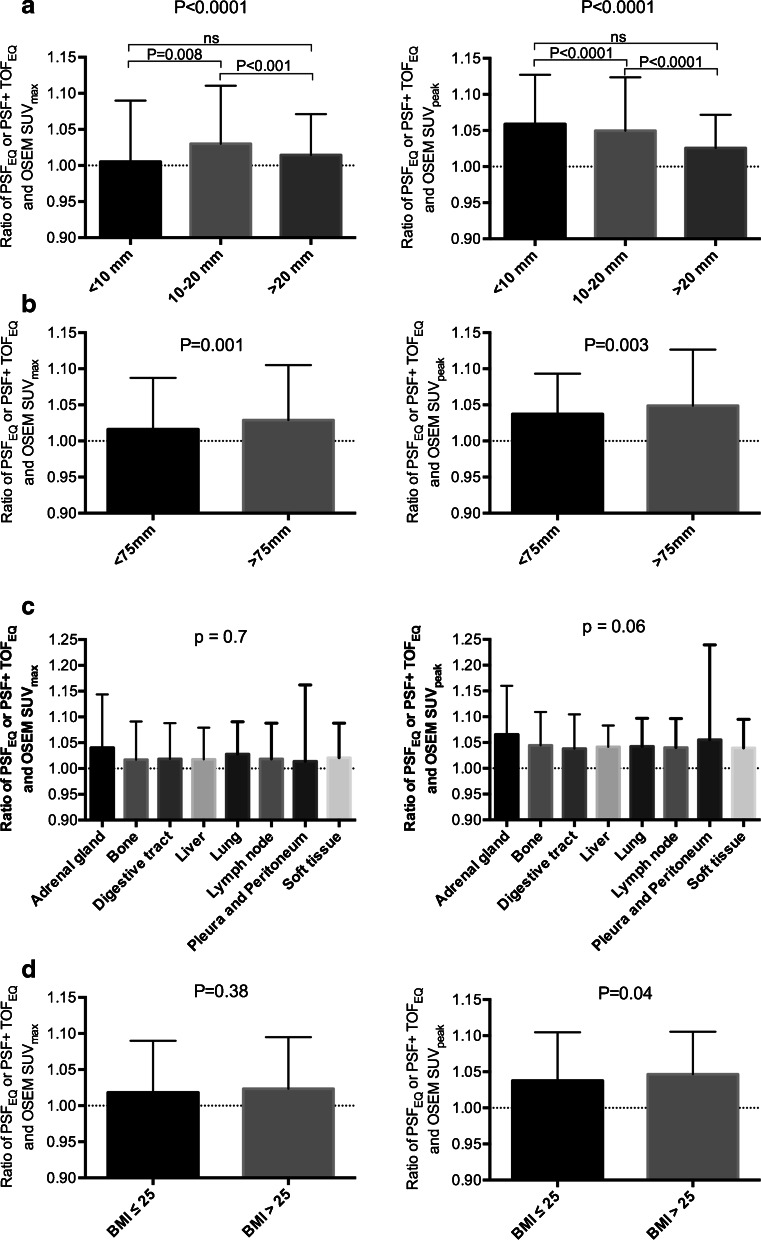
PURPOSE: Point-spread function (PSF) or PSF + time-of-flight (TOF) reconstruction may improve lesion detection in oncologic PET, but can alter quantitation resulting in variable standardized uptake values (SUVs) between different PET systems. This study aims to validate a proprietary software tool (EQ.PET) to harmonize SUVs across different PET systems independent of the reconstruction algorithm used. METHODS: NEMA NU2 phantom data were used to calculate the appropriate filter for each PSF or PSF+TOF reconstruction from three different PET systems, in order to obtain EANM compliant recovery coefficients. PET data from 517 oncology patients were reconstructed with a PSF or PSF+TOF reconstruction for optimal tumour detection and an ordered subset expectation maximization (OSEM3D) reconstruction known to fulfil EANM guidelines. Post-reconstruction, the proprietary filter was applied to the PSF or PSF+TOF data (PSFEQ or PSF+TOFEQ). SUVs for PSF or PSF+TOF and PSFEQ or PSF+TOFEQ were compared to SUVs for the OSEM3D reconstruction. The impact of potential confounders on the EQ.PET methodology including lesion and patient characteristics was studied, as was the adherence to imaging guidelines. RESULTS: For the 1380 tumour lesions studied, Bland-Altman analysis showed a mean ratio between PSF or PSF+TOF and OSEM3D of 1.46 (95%CI: 0.86-2.06) and 1.23 (95%CI: 0.95-1.51) for SUVmax and SUVpeak, respectively. Application of the proprietary filter improved these ratios to 1.02 (95%CI: 0.88-1.16) and 1.04 (95%CI: 0.92-1.17) for SUVmax and SUVpeak, respectively. The influence of the different confounding factors studied (lesion size, location, radial offset and patient's BMI) was less than 5%. Adherence to the European Association of Nuclear Medicine (EANM) guidelines for tumour imaging was good. CONCLUSION: These data indicate that it is not necessary to sacrifice the superior lesion detection and image quality achieved by newer reconstruction techniques in the quest for harmonizing quantitative comparability between PET systems.
Overview
The claims and statistics of this paper haven’t been checked yet.
Run the check — free, no account needed. It reads the open-access text and checks the sources it cites.
Integrity signals
Registry
Cites
Statistics
Figures
Verification
Claims the paper makes
The claims and statistics of this paper haven’t been checked yet.
Run the check — free, no account needed. It reads the open-access text and checks the sources it cites.
Claims other papers make about this one
Each is checked against this paper’s own text: does it say what the citing paper says it does?
The source backs part of the claim, not all of it — or backs it for a different population, condition or comparison.
In the citing paper
“Compared with non-PSF reconstructed images, this can increase lesion SUVmax, SUVmean and SUVpeak by up to 30% on average [100,101,102].”
From Influences on PET Quantification and Interpretation (2022) · cites this paper as [100]
Experimental — accuracy not yet measuredThe cited source says what the claim attributes to it.
In the citing paper
“With appropriate filter width (FWHM) based on sphere CR from standardized phantom measurements, PSF-induced SUV increases can be negated, resulting in comparable lesion SUVs to those in non-PSF data.”
From Influences on PET Quantification and Interpretation (2022) · cites this paper as [100]
The cited source says what the claim attributes to it.
In the citing paper
“This improves reconstructed spatial resolution [97,98] and increases lesion SUV [99,100] but can lead to overestimation of the true activity due to so-called Gibbs’ artifacts [92,93].”
From Influences on PET Quantification and Interpretation (2022) · cites this paper as [100]
Self-check
Percentages, sums and reported differences re-computed from the paper’s own numbers.
The self-check needs the paper’s full text.
Citations
Cites
STATISTICAL METHODS FOR ASSESSING AGREEMENT BETWEEN TWO METHODS OF CLINICAL MEASUREMENT
Martin Bland, J., & Altman, D. (1986) · The Lancet · doi:10.1016/s0140-6736(86)90837-8 · Cited by 47,965
Beckett, A. H., Rowland, M., & TURNER, P. (1965) · The Lancet · doi:10.1016/s0140-6736(65)91037-8 · Cited by 16,917
From RECIST to PERCIST: Evolving Considerations for PET Response Criteria in Solid Tumors
Wahl, R. L., Jacene, H., Kasamon, Y., & Lodge, M. A. (2009) · Journal of Nuclear Medicine · doi:10.2967/jnumed.108.057307 · Cited by 3,777
FDG PET/CT: EANM procedure guidelines for tumour imaging: version 2.0
Boellaard, R., Delgado-Bolton, R., Oyen, W. J. G., Giammarile, F., Tatsch, K., Eschner, W., Verzijlbergen, F. J., Barrington, S. F., Pike, L. C., Weber, W. A., et al. (2015) · European Journal of Nuclear Medicine and Molecular Imaging · doi:10.1007/s00259-014-2961-x · Cited by 3,303
Young, H. E., Baum, R. P., Cremerius, U., Herholz, K., Hoekstra, O. S., Lammertsma, A. A., Pruim, J., & Price, P. (1999) · European Journal of Cancer · doi:10.1016/s0959-8049(99)00229-4 · Cited by 1,740
Barrington, S. F., Mikhaeel, N. G., Kostakoğlu, L., Meignan, M. A., Hutchings, M., Müeller, S., Schwartz, L. H., Zucca, E., Fisher, R. I., Trotman, J., et al. (2014) · Journal of Clinical Oncology · doi:10.1200/jco.2013.53.5229 · Cited by 1,663
Self-citationFDG PET and PET/CT: EANM procedure guidelines for tumour PET imaging: version 1.0
Boellaard, R., O’Doherty, M. J., Weber, W., Mottaghy, F. M., Lonsdale, M. N., Stroobants, S. G., Oyen, W. J. G., Kotzerke, J., Hoekstra, O. S., Pruim, J., et al. (2009) · European Journal of Nuclear Medicine and Molecular Imaging · doi:10.1007/s00259-009-1297-4 · Cited by 1,329
Procedure guideline for tumor imaging with 18F-FDG PET/CT 1.0.
Delbeke, D., Coleman, R. E., Guiberteau, M. J., Brown, M. L., Royal, H. D., Siegel, B. A., Townsend, D. W., Berland, L. L., Parker, J. A., Hubner, K., et al. (2006) · PubMed · Cited by 689
Procedure guideline for tumor imaging with F-18 FDG PET/CT
Delbeke, D., Coleman, R. E., Guiberteau, M. J., Brown, M. L., Royal, H. D., Siegel, B. A., Townsend, D. W., Berland, L. L., Parker, J. A., Hübner, K. F., et al. (2006) · Cited by 620
Physical and clinical performance of the mCT time-of-flight PET/CT scanner
Jakoby, B., Bercier, Y., Conti, M., Casey, M. E., Bendriem, B., & Townsend, D. W. (2011) · Physics in Medicine and Biology · doi:10.1088/0031-9155/56/8/004 · Cited by 487
Cited by
Sorted by citations
Aide, N., Lasnon, C., Veit-Haibach, P., Sera, T., Sattler, B., & Boellaard, R. (2017) · European Journal of Nuclear Medicine and Molecular Imaging · doi:10.1007/s00259-017-3740-2 · Cited by 344
Self-citationMeignan, M. A., Cottereau, A., Versari, A., Chartier, L., Dupuis, J., Boussetta, S., Grassi, I., Casasnovas, O., Haïoun, C., Tilly, H., et al. (2016) · Journal of Clinical Oncology · doi:10.1200/jco.2016.66.9440 · Cited by 325
Quantification, improvement, and harmonization of small lesion detection with state-of-the-art PET
van der Vos, C. S., Koopman, D., Rijnsdorp, S., Arends, A. J., Boellaard, R., van Dalen, J. A., Lubberink, M., Willemsen, A. T. M., & Visser, E. P. (2017) · European Journal of Nuclear Medicine and Molecular Imaging · doi:10.1007/s00259-017-3727-z · Cited by 206
How We Read Oncologic FDG PET/CT
Hofman, M. S., & Hicks, R. J. (2016) · Cancer Imaging · doi:10.1186/s40644-016-0091-3 · Cited by 155
Self-citationRadiomics in Nuclear Medicine Applied to Radiation Therapy: Methods, Pitfalls, and Challenges
Reuzé, S., Schernberg, A., Orlhac, F., Sun, R., Chargari, C., Dercle, L., Deutsch, É., Buvat, I., & Robert, C. (2018) · International Journal of Radiation Oncology*Biology*Physics · doi:10.1016/j.ijrobp.2018.05.022 · Cited by 128
Metadata
- Authors
- Quak, E., Le Roux, P.-Y., Hofman, M. S., Robin, P., Bourhis, D., Callahan, J., Binns, D., Desmonts, C., Salaun, P.-Y., Hicks, R. J., & Aide, N.
- Affiliations
- Centre François Baclesse (FR)
- The University of Melbourne (AU)
- Centre Hospitalier Régional Universitaire de Brest (FR)
- Centre Hospitalier Universitaire de Caen Normandie (FR)
- Inserm (FR)
- Corresponding author
- Aide, Nicolas
- ORCID
- Venue
- European Journal of Nuclear Medicine and Molecular Imaging
- Published
- 2015-07-30
- Volume
- 42
- Issue
- 13
- Pages
- 2072-2082
- ISSN
- 1619-7070 (ISSN-L)
- 1619-7089
- PMC
- PMC4623085
- OpenAlex
- W941202616
- Cited by
- 107
- References
- 33
- Citations by year
- 2026: 2 · 2025: 4 · 2024: 7 · 2023: 6 · 2022: 12 · 2021: 16 · 2020: 8 · 2019: 9 · 2018: 12 · 2017: 16 · 2016: 11 · 2015: 4
- FWCI
- 11.62
- Type
- journal article
- Language
- en
- Open access
- hybrid
- doi.org
- Locations
- European Journal of Nuclear Medicine and Molecular Imaging (publishedVersion, cc-by)
- Europe PMC (PubMed Central) (publishedVersion, cc-by)
- PubMed Central (publishedVersion, cc-by)
- PubMed (publishedVersion)
- HAL (submittedVersion)
- Minerva Access (University of Melbourne) (submittedVersion, cc-by)
- Topics
- Health Sciences › Medicine › Radiology, Nuclear Medicine and Imaging › Medical Imaging Techniques and Applications
- Health Sciences › Medicine › Radiology, Nuclear Medicine and Imaging › Cardiac Imaging and Diagnostics
- Health Sciences › Medicine › Pulmonary and Respiratory Medicine › Lung Cancer Diagnosis and Treatment
- Keywords
- point spread function reconstruction, time-of-flight PET, SUVmax, SUVpeak, EANM guidelines, standardized uptake value, multicentre validation
- MeSH terms
- Aged, Carcinoma, Non-Small-Cell Lung, Female, Humans, Image Processing, Computer-Assisted, Liver Neoplasms, Lymphoma, Non-Hodgkin, Male, Melanoma, Middle Aged, Radiopharmaceuticals, Fluorodeoxyglucose F18, Positron-Emission Tomography
About these checks
Registry, retraction, Cites and statistics results are computed, not judged, with one exception: a printed reference that no index lists is read once by a model before it counts as a citation error. Claims are extracted by a model and kept only when their quote appears verbatim in the text; each cited source is then checked, with a model’s help, for whether it says what the claim relies on. Those verdicts can be wrong — read the claim’s quote and the cited source before relying on one.
Statistics and arithmetic are recomputed, not judged.
Confidence bands are shown only for fields calibrated on our annotated test set. None is calibrated yet, so no band is shown.
What counts as a claim ›How we measure confidence ›How we check this ›
Are you an author, or do you see a problem with this page? Request a review
