

The DOI matches its Crossref record; 231 of the 232 references it cites were found in a registry or an index.
Analyzing dendritic spine pathology in Alzheimer’s disease: problems and opportunities
Open accessAbstract
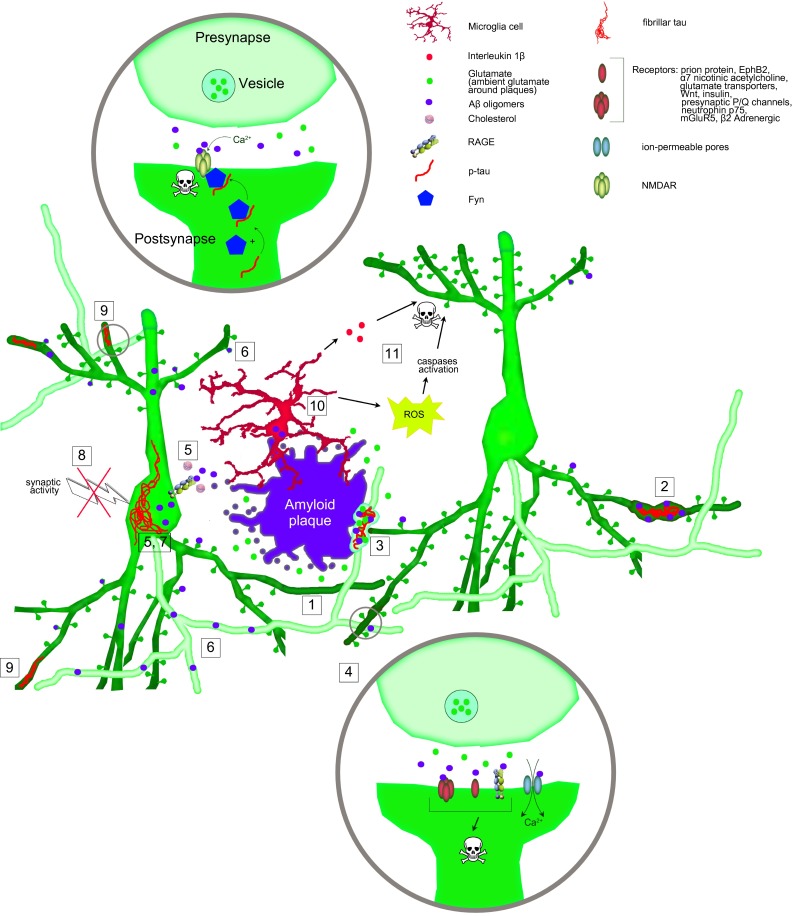
Synaptic failure is an immediate cause of cognitive decline and memory dysfunction in Alzheimer's disease. Dendritic spines are specialized structures on neuronal processes, on which excitatory synaptic contacts take place and the loss of dendritic spines directly correlates with the loss of synaptic function. Dendritic spines are readily accessible for both in vitro and in vivo experiments and have, therefore, been studied in great detail in Alzheimer's disease mouse models. To date, a large number of different mechanisms have been proposed to cause dendritic spine dysfunction and loss in Alzheimer's disease. For instance, amyloid beta fibrils, diffusible oligomers or the intracellular accumulation of amyloid beta have been found to alter the function and structure of dendritic spines by distinct mechanisms. Furthermore, tau hyperphosphorylation and microglia activation, which are thought to be consequences of amyloidosis in Alzheimer's disease, may also contribute to spine loss. Lastly, genetic and therapeutic interventions employed to model the disease and elucidate its pathogenetic mechanisms in experimental animals may cause alterations of dendritic spines on their own. However, to date none of these mechanisms have been translated into successful therapeutic approaches for the human disease. Here, we critically review the most intensely studied mechanisms of spine loss in Alzheimer's disease as well as the possible pitfalls inherent in the animal models of such a complex neurodegenerative disorder.
Overview
The claims and statistics of this paper haven’t been checked yet.
Run the check — free, no account needed. It reads the open-access text and checks the sources it cites.
Integrity signals
Registry
Cites
Statistics
Figures
Verification
Claims the paper makes
The claims and statistics of this paper haven’t been checked yet.
Run the check — free, no account needed. It reads the open-access text and checks the sources it cites.
Claims other papers make about this one
Each is checked against this paper’s own text: does it say what the citing paper says it does?
The cited source says what the claim attributes to it.
In the citing paper
“Dendritic spines serve as docking points for presynaptic axons, and healthy turnover of dendritic spines depends on cytoskeletal proteins [113].”
From Rlip76: An Unexplored Player in Neurodegeneration and Alzheimer’s Disease? (2022) · cites this paper as [113]
The cited source says what the claim attributes to it.
In the citing paper
“The loss of dendritic spines is a characteristic of the brains of AD patients, indicative of synaptic failure and a loss of robust neural networking [113].”
From Rlip76: An Unexplored Player in Neurodegeneration and Alzheimer’s Disease? (2022) · cites this paper as [113]
The cited source says what the claim attributes to it.
In the citing paper
“Dendritic spines serve as docking points for presynaptic axons, and healthy turnover of dendritic spines depends on cytoskeletal proteins [113].”
From Rlip76: An Unexplored Player in Neurodegeneration and Alzheimer’s Disease? (2022) · cites this paper as [113]
Self-check
Percentages, sums and reported differences re-computed from the paper’s own numbers.
The self-check needs the paper’s full text.
Citations
Cites
Neuropathological stageing of Alzheimer-related changes.
Braak, H., & Braak, E. (1991) · Acta Neuropathologica · doi:10.1007/bf00308809 · Cited by 16,123
The Amyloid Hypothesis of Alzheimer’s Disease: Progress and Problems on the Road to Therapeutics
Hardy, J., & Selkoe, D. J. (2002) · Science · doi:10.1126/science.1072994 · Cited by 13,864
Amyloid oligomers exacerbate tau pathology in a mouse model of tauopathy
Selenica, M.-L. B., Brownlow, M., Jimenez, J. P., Lee, D. C., Pena, G., Dickey, C. A., Gordon, M. N., & Morgan, D. (2013) · Neurodegenerative Diseases · doi:10.1159/000337230 · Cited by 10,359
Soluble protein oligomers in neurodegeneration: lessons from the Alzheimer's amyloid β-peptide
Haass, C., & Selkoe, D. J. (2007) · Nature Reviews Molecular Cell Biology · doi:10.1038/nrm2101 · Cited by 4,744
Terry, R. D., Masliah, E., Salmon, D. P., Butters, N., DeTeresa, R., Hill, R., Hansen, L. A., & Katzman, R. (1991) · Annals of Neurology · doi:10.1002/ana.410300410 · Cited by 4,397
Synaptic Pruning by Microglia Is Necessary for Normal Brain Development
Paolicelli, R. C., Bolasco, G., Pagani, F., Maggi, L., Scianni, M., Panzanelli, P., Giustetto, M., Ferreira, T. A., Guiducci, E., Dumas, L., et al. (2011) · Science · doi:10.1126/science.1202529 · Cited by 4,244
Oakley, H., Cole, S. L., Logan, S., Maus, E., Shao, P., Craft, J., Guillozet-Bongaarts, A., Ohno, M., Disterhoft, J., Van Eldik, L., et al. (2006) · The Journal of Neuroscience · doi:10.1523/jneurosci.1202-06.2006 · Cited by 3,530
Phases of Aβ-deposition in the human brain and its relevance for the development of AD
Thal, D. R., Rüb, U., Orantes, M., & Braak, H. (2002) · Neurology · doi:10.1212/wnl.58.12.1791 · Cited by 3,490
Braak, H., Alafuzoff, I., Arzberger, T., Kretzschmar, H., & Del Tredici, K. (2006) · Acta Neuropathologica · doi:10.1007/s00401-006-0127-z · Cited by 3,172
Microglia promote learning-dependent synapse formation through brain-derived neurotrophic factor
Parkhurst, C. N., Yang, G., Ninan, I., Savas, J. N., Yates, J. R., Lafaille, J. J., Hempstead, B. L., Littman, D. R., & Gan, W.-B. (2013) · Cell · doi:10.1016/j.cell.2013.11.030 · Cited by 2,599
Cited by
Sorted by citations
Synaptic basis of Alzheimer’s disease: Focus on synaptic amyloid beta, P-tau and mitochondria
John, A., & Reddy, P. H. (2021) · Ageing Research Reviews · doi:10.1016/j.arr.2020.101208 · Cited by 359
Yarjanli, Z., Ghaedi, K., Esmaeili, A., Rahgozar, S., & Zarrabi, A. (2017) · BMC Neuroscience · doi:10.1186/s12868-017-0369-9 · Cited by 303
Neuropathology of amyotrophic lateral sclerosis and its variants
Saberi, S., Stauffer, J. E., Schulte, D. J., & Ravits, J. (2015) · Neurologic Clinics · doi:10.1016/j.ncl.2015.07.012 · Cited by 282
Maestú, F., de Haan, W., Busche, M. A., & DeFelipe, J. (2021) · Ageing Research Reviews · doi:10.1016/j.arr.2021.101372 · Cited by 245
Poor sleep is associated with CSF biomarkers of amyloid pathology in cognitively normal adults
Sprecher, K. E., Koscik, R. L., Carlsson, C. M., Zetterberg, H., Blennow, K., Okonkwo, O. C., Sager, M. A., Asthana, S., Johnson, S. C., Benca, R. M., et al. (2017) · Neurology · doi:10.1212/wnl.0000000000004171 · Cited by 235
Role of p38/MAPKs in Alzheimer's Disease: Implications for Amyloid Beta Toxicity Targeted Therapy
Kheiri, G., Dolatshahi, M., Rahmani, F., & Rezaei, N. (2018) · Reviews in the Neurosciences · doi:10.1515/revneuro-2018-0008 · Cited by 211
de Pins, B., Cifuentes-Díaz, C., Farah, A. T., López-Molina, L., Montalban, E., Sancho‐Balsells, A., López, A. V., Ginés, S., Delgado-Garcia, J. M., Alberch, J., et al. (2019) · Journal of Neuroscience · doi:10.1523/jneurosci.2121-18.2019 · Cited by 197
Chronic 2P-STED imaging reveals high turnover of dendritic spines in the hippocampus in vivo
Pfeiffer, T., Poll, S., Bancelin, S., Angibaud, J., Inavalli, V. K., Keppler, K., Mittag, M., Fuhrmann, M., & Nägerl, U. V. (2018) · eLife · doi:10.7554/elife.34700 · Cited by 192
Structural and functional plasticity of dendritic spines – root or result of behavior?
Gipson, C. D., & Olive, M. F. (2016) · Genes Brain & Behavior · doi:10.1111/gbb.12324 · Cited by 214
Cellular mechanisms and treatments for chemobrain: insight from aging and neurodegenerative diseases
Nguyen, L. D., & Ehrlich, B. E. (2020) · EMBO Molecular Medicine · doi:10.15252/emmm.202012075 · Cited by 181
Bustamante-Barrientos, F. A., Méndez-Ruette, M., Ortloff, A., Luz‐Crawford, P., Rivera, F. J., Figueroa, C. D., Molina, L., & Bátiz, L. F. (2021) · Frontiers in Cellular Neuroscience · doi:10.3389/fncel.2021.636176 · Cited by 180
Mathematical model on Alzheimer’s disease
Hao, W., & Friedman, A. (2016) · BMC Systems Biology · doi:10.1186/s12918-016-0348-2 · Cited by 164
Contribution of Tau Pathology to Mitochondrial Impairment in Neurodegeneration
Maria Jose Perez, J., Jara, C., & Quintanilla, R. A. (2018) · Frontiers in Neuroscience · doi:10.3389/fnins.2018.00441 · Cited by 157
BDNF signaling during the lifetime of dendritic spines
Zagrebelsky, M., Tacke, C., & Korte, M. (2020) · Cell and Tissue Research · doi:10.1007/s00441-020-03226-5 · Cited by 147
Dendritic Spines as Tunable Regulators of Synaptic Signals
Tønnesen, J., & Nägerl, U. V. (2016) · Frontiers in Psychiatry · doi:10.3389/fpsyt.2016.00101 · Cited by 147
Tan, C., Lu, N., Wang, C., Chen, D.-Y., Sun, N.-H., Lyu, H., Körbelin, J., Shi, W., Fukunaga, K., Lu, Y., et al. (2019) · Neuron · doi:10.1016/j.neuron.2018.12.036 · Cited by 128
Piirainen, S., Youssef, A. M., Song, C., Kalueff, A. V., Landreth, G. E., Malm, T., & Tian, L. (2017) · Neuroscience & Biobehavioral Reviews · doi:10.1016/j.neubiorev.2017.01.046 · Cited by 130
Nand, S., Mishra, D., Singh, P., Vamanu, E., & Singh, M. P. (2021) · Biomedicine & Pharmacotherapy · doi:10.1016/j.biopha.2021.111377 · Cited by 118
Mukherjee, A., & Williams, D. W. (2017) · Cell Death and Differentiation · doi:10.1038/cdd.2017.64 · Cited by 98
Yang, L., Wu, C., Li, Y., Dong, Y., Wu, C. Y., Lee, R. H., Brann, D. W., Lin, H. W., & Zhang, Q. (2022) · GeroScience · doi:10.1007/s11357-022-00534-2 · Cited by 100
Apaijai, N., Moisescu, D. M., Palee, S., McSweeney, C. M., Saiyasit, N., Maneechote, C., Boonnag, C., Chattipakorn, N., & Chattipakorn, S. C. (2019) · Journal of the American Heart Association · doi:10.1161/jaha.118.010838 · Cited by 90
Montero‐Crespo, M., Domínguez-Álvaro, M., Alonso‐Nanclares, L., DeFelipe, J., & Blázquez‐Llorca, L. (2020) · Brain · doi:10.1093/brain/awaa406 · Cited by 89
Tauopathies: Deciphering Disease Mechanisms to Develop Effective Therapies
Silva, M. C., & Haggarty, S. J. (2020) · International Journal of Molecular Sciences · doi:10.3390/ijms21238948 · Cited by 89
Ongnok, B., Khuanjing, T., Chunchai, T., Pantiya, P., Kerdphoo, S., Arunsak, B., Nawara, W., Jaiwongkam, T., Apaijai, N., Chattipakorn, N., et al. (2021) · Neurotherapeutics · doi:10.1007/s13311-021-01092-9 · Cited by 86
The Impact of Estradiol on Neurogenesis and Cognitive Functions in Alzheimer’s Disease
Negah, S. S., Hajali, V., Moradi, H. R., & Gorji, A. (2019) · Cellular and Molecular Neurobiology · doi:10.1007/s10571-019-00733-0 · Cited by 83
Three-dimensional analysis of synapses in the transentorhinal cortex of Alzheimer’s disease patients
Domínguez-Álvaro, M., Montero-Crespo, M., Blazquez-Llorca, L., Insausti, R., DeFelipe, J., & Alonso-Nanclares, L. (2018) · Acta Neuropathologica Communications · doi:10.1186/s40478-018-0520-6 · Cited by 79
Dendritic Spine and Synaptic Plasticity in Alzheimer’s Disease: A Focus on MicroRNA
Reza-Zaldívar, E. E., Hernández-Sapiéns, M. A., Minjarez, B. D., Gómez‐Pinedo, U., Sánchez-González, V., Márquez-Aguirre, A. L., & Canales-Aguirre, A. A. (2020) · Frontiers in Cell and Developmental Biology · doi:10.3389/fcell.2020.00255 · Cited by 81
Krishtal, J., Bragina, O., Metsla, K., Palumaa, P., & Tõugu, V. (2017) · PLoS ONE · doi:10.1371/journal.pone.0186636 · Cited by 76
Geloso, M. C., & D’Ambrosi, N. (2021) · Cells · doi:10.3390/cells10030686 · Cited by 79
Cortese, G. P., & Bürger, C. (2016) · Behavioural Brain Research · doi:10.1016/j.bbr.2016.08.027 · Cited by 77
Reed, S., Taka, E., Darling‐Reed, S., & Soliman, K. F. A. (2025) · Cells · doi:10.3390/cells14141064 · Cited by 76
The Cognitive Effects of Radiotherapy for Brain Metastases
Lehrer, E. J., Jones, B. M., Dickstein, D. R., Green, S., Germano, I. M., Palmer, J. D., Laack, N. N., Brown, P. D., Gondi, V., Wefel, J. S., et al. (2022) · Frontiers in Oncology · doi:10.3389/fonc.2022.893264 · Cited by 70
van Nifterick, A. M., Gouw, A. A., van Kesteren, R. E., Scheltens, P., Stam, C. J., & de Haan, W. (2022) · Alzheimer s Research & Therapy · doi:10.1186/s13195-022-01041-4 · Cited by 72
Furcila, D., DeFelipe, J., & Alonso‐Nanclares, L. (2018) · Journal of Alzheimer s Disease · doi:10.3233/jad-180173 · Cited by 73
Lebouvier, T., Pasquier, F., & Buée, L. (2017) · Current Opinion in Neurology · doi:10.1097/wco.0000000000000502 · Cited by 77
Imaging Synaptic Density: The Next Holy Grail of Neuroscience?
Serrano, M. E., Kim, E., Petrinovic, M. M., Turkheimer, F., & Cash, D. (2022) · Frontiers in Neuroscience · doi:10.3389/fnins.2022.796129 · Cited by 67
Impact of Tau on Neurovascular Pathology in Alzheimer's Disease
Canepa, E., & Fossati, S. (2021) · Frontiers in Neurology · doi:10.3389/fneur.2020.573324 · Cited by 67
Psychedelic‐inspired approaches for treating neurodegenerative disorders
Saeger, H. N., & Olson, D. E. (2021) · Journal of Neurochemistry · doi:10.1111/jnc.15544 · Cited by 72
Domínguez-Álvaro, M., Montero‐Crespo, M., Blázquez‐Llorca, L., DeFelipe, J., & Alonso‐Nanclares, L. (2019) · eNeuro · doi:10.1523/eneuro.0140-19.2019 · Cited by 67
Fan, C., Zhu, X., Song, Q., Wang, P., Liu, Z., & Yu, S. Y. (2018) · Neuropharmacology · doi:10.1016/j.neuropharm.2018.01.009 · Cited by 63
Mitigating Alzheimer’s Disease with Natural Polyphenols: A Review
Gaudreault, R., & Mousseau, N. (2019) · Current Alzheimer Research · doi:10.2174/1567205016666190315093520 · Cited by 65
Compta, Y., & Révész, T. (2020) · Journal of Parkinson s Disease · doi:10.3233/jpd-202323 · Cited by 61
AbuelEzz, N. Z., Nasr, F. E., Abdulkader, M. A., Bassiouny, A. R., & Zaky, A. (2021) · Frontiers in Aging Neuroscience · doi:10.3389/fnagi.2021.743573 · Cited by 61
The Role of Mitochondrial Impairment in Alzheimer´s Disease Neurodegeneration: The Tau Connection
Quntanilla, R. A., & Tapia-Monsalves, C. (2020) · Current Neuropharmacology · doi:10.2174/1570159x18666200525020259 · Cited by 59
Pedrazzoli, M., Losurdo, M., Paolone, G., Medelin, M., Jaupaj, L., Cisterna, B., Slanzi, A., Malatesta, M., Coco, S., & Buffelli, M. (2019) · Neurobiology of Disease · doi:10.1016/j.nbd.2019.104568 · Cited by 58
Ongnok, B., Khuanjing, T., Chunchai, T., Kerdphoo, S., Jaiwongkam, T., Chattipakorn, N., & Chattipakorn, S. C. (2020) · Biochimica et Biophysica Acta (BBA) - Molecular Basis of Disease · doi:10.1016/j.bbadis.2020.165975 · Cited by 55
Dong, Q., Teng, S.-W., Wang, Y., Qin, F., Li, Y., Ai, L., & Yu, H. (2018) · Neuroscience Letters · doi:10.1016/j.neulet.2018.12.041 · Cited by 55
Singh, R., Bartók, Á., Paillard, M., Tyburski, A. L., Elliott, M. B., & Hajnóczky, G. (2022) · Science Advances · doi:10.1126/sciadv.abj4716 · Cited by 55
Ishii, T., Furuoka, H., Kaya, M., & Kuhara, T. (2021) · Biomedicines · doi:10.3390/biomedicines9020167 · Cited by 50
Shaw, A. E., & Bamburg, J. R. (2017) · Pharmacology & Therapeutics · doi:10.1016/j.pharmthera.2017.02.031 · Cited by 52
VEGF counteracts amyloid-β-induced synaptic dysfunction
Martin, L., Bouvet, P., Chounlamountri, N., Watrin, C., Besançon, R., Pinatel, D., Meyronet, D., Honnorat, J., Buisson, A., Salin, P. A., et al. (2021) · Cell Reports · doi:10.1016/j.celrep.2021.109121 · Cited by 52
Gong, W.-G., Wang, Y., Zhou, H., Li, X.-L., Bai, F., Ren, Q., & Zhang, Z. (2016) · Molecular Neurobiology · doi:10.1007/s12035-016-9781-x · Cited by 49
Chu, S., Liu, S., Duan, W., Cheng, Y., Jiang, X., Zhu, C., Tang, K. L., Wang, R., Xu, L., Wang, X., et al. (2016) · Pharmacology & Therapeutics · doi:10.1016/j.pharmthera.2016.01.002 · Cited by 50
siRNA drug delivery across the blood–brain barrier in Alzheimer's disease
Sajid, M. I., Sheikh, F. S., Anis, F., Nasim, N., Sumbria, R. K., Nauli, S. M., & Tiwari, R. K. (2023) · Advanced Drug Delivery Reviews · doi:10.1016/j.addr.2023.114968 · Cited by 50
Jiang, T., Handley, E. E., Brizuela, M., Dawkins, E., Lewis, K. E. A., Clark, R. M., Dickson, T. C., & Blizzard, C. A. (2019) · Disease Models & Mechanisms · doi:10.1242/dmm.038109 · Cited by 48
Actin Cytoskeleton Role in the Maintenance of Neuronal Morphology and Long-Term Memory
Lamprecht, R. (2021) · Cells · doi:10.3390/cells10071795 · Cited by 48
Neuronal sphingosine kinase 2 subcellular localization is altered in Alzheimer’s disease brain
Dominguez, G., Maddelein, M.-L., Pucelle, M., Nicaise, Y., Maurage, C.-A., Duyckaerts, C., Cuvillier, O., & Delisle, M.-B. (2018) · Acta Neuropathologica Communications · doi:10.1186/s40478-018-0527-z · Cited by 43
Ma, G., Liu, M., Du, K., Zhong, X., Gong, S., Jiao, L., & Wei, M. (2019) · BioMed Research International · doi:10.1155/2019/8179145 · Cited by 41
Corsetti, V., Borreca, A., Latina, V., Giacovazzo, G., Pignataro, A., Krashia, P., Natale, F., Cocco, S., Rinaudo, M., Malerba, F., et al. (2020) · Brain Communications · doi:10.1093/braincomms/fcaa039 · Cited by 42
Ouellette, A. R., Neuner, S. M., Dumitrescu, L. C., Anderson, L. C., Gatti, D. M., Mahoney, E. R., Bubier, J. A., Churchill, G. A., Peters, L. L., Huentelman, M. J., et al. (2020) · Cell Reports · doi:10.1016/j.celrep.2020.108091 · Cited by 42
Rudobeck, E., Bellone, J. A., Szűcs, A. L., Bonnick, K., Mehrotra, S., Badaut, J., Nelson, G. A., Hartman, R. E., & Vlkolinský, R. (2017) · PLoS ONE · doi:10.1371/journal.pone.0186168 · Cited by 42
Garcia, G., Pinto, S., Cunha, M., Fernandes, A., Koistinaho, J., & Brites, D. (2021) · Cells · doi:10.3390/cells10092424 · Cited by 39
Sreenivasmurthy, S. G., Iyaswamy, A., Krishnamoorthi, S., Reddi, R. N., Kammala, A. K., Vasudevan, K., Senapati, S., Zhu, Z., Su, C.-F., Liu, J., et al. (2022) · Frontiers in Molecular Biosciences · doi:10.3389/fmolb.2022.1030534 · Cited by 38
Lynx1 Limits Dendritic Spine Turnover in the Adult Visual Cortex
Sajo, M., Ellis‐Davies, G. C. R., & Morishita, H. (2016) · Journal of Neuroscience · doi:10.1523/jneurosci.0580-16.2016 · Cited by 39
DMSO modulates CNS function in a preclinical Alzheimer's disease model
Penazzi, L., Lorengel, J., Sündermann, F., Golovyashkina, N., Marre, S., Mathis, C., Lewejohann, L., Brandt, R., & Bakota, L. (2016) · Neuropharmacology · doi:10.1016/j.neuropharm.2016.10.020 · Cited by 40
Sengupta, U., Puangmalai, N., Bhatt, N. N., García, S., Zhao, Y., & Kayed, R. (2020) · Molecular Neurobiology · doi:10.1007/s12035-020-01913-6 · Cited by 38
In vivo coupling of dendritic complexity with presynaptic density in primary tauopathies
Mak, E., Holland, N., Jones, P. S., Savulich, G., Low, A., Malpetti, M., Kaalund, S. S., Passamonti, L., Rittman, T., Romero-García, R., et al. (2021) · Neurobiology of Aging · doi:10.1016/j.neurobiolaging.2021.01.016 · Cited by 39
Current druggable targets for therapeutic control of Alzheimer's disease
Gupta, G. L., & Samant, N. P. (2021) · Contemporary Clinical Trials · doi:10.1016/j.cct.2021.106549 · Cited by 38
Sanchez-Varo, R. M., Sánchez‐Mejías, E., Fernandez-Valenzuela, J. J., Castro, V. D., Mejias‐Ortega, M., Gómez-Arboledas, Á., Jiménez, S., Sanchez-Mico, M. V., Trujillo‐Estrada, L., Moreno‐González, I., et al. (2021) · Frontiers in Neuroscience · doi:10.3389/fnins.2021.752594 · Cited by 42
Schaefer, T. L., Davenport, M. H., Grainger, L. M., Robinson, C. K., Earnheart, A. T., Stegman, M., Lang, A. L., Ashworth, A. A., Molinaro, G., Huber, K. M., et al. (2017) · Journal of Neurodevelopmental Disorders · doi:10.1186/s11689-017-9184-y · Cited by 38
Dynamic presenilin 1 and synaptotagmin 1 interaction modulates exocytosis and amyloid β production
Zoltowska, K. M., Maesako, M., Lushnikova, I., Takeda, S., Keller, L. J., Skibo, G., Hyman, B. T., & Berezovska, O. (2017) · Molecular Neurodegeneration · doi:10.1186/s13024-017-0159-y · Cited by 36
Solis‐Gaspar, C., Vázquez‐Roque, R. A., Gómez-Villalobos, M. D. J., & Flores, G. (2016) · Synapse · doi:10.1002/syn.21912 · Cited by 36
Iron and Targeted Iron Therapy in Alzheimer’s Disease
Wang, J., Fu, J., Zhao, Y., Liu, Q., Yan, X., & Su, J. (2023) · International Journal of Molecular Sciences · doi:10.3390/ijms242216353 · Cited by 35
If Human Brain Organoids Are the Answer to Understanding Dementia, What Are the Questions?
Ooi, L., Dottori, M., Cook, A. L., Engel, M., Gautam, V., Grubman, A., Hernández, D., King, A. E., Maksour, S., Anastacio, H. T. D., et al. (2020) · The Neuroscientist · doi:10.1177/1073858420912404 · Cited by 35
Gender and Neurosteroids: Implications for Brain Function, Neuroplasticity and Rehabilitation
Raciti, L., Formica, C., Raciti, G., Quartarone, A., & Calabrò, R. S. (2023) · International Journal of Molecular Sciences · doi:10.3390/ijms24054758 · Cited by 33
Glennon, E. B. C., Lau, D. H. W., Gabriele, R. M. C., Taylor, M. F., Troakes, C., Opie-Martin, S., Elliott, C., Killick, R., Hanger, D. P., Perez‐Nievas, B. G., et al. (2020) · Brain Communications · doi:10.1093/braincomms/fcaa011 · Cited by 36
The effects of astaxanthin treatment on a rat model of Alzheimer’s disease
Chen, M.-H., Wang, T., Chen, L.-J., Jiang, M.-Y., Wang, Y., Tseng, G., & Chen, J. (2021) · Brain Research Bulletin · doi:10.1016/j.brainresbull.2021.04.020 · Cited by 33
Recent Insights into the Neurobiology of Alzheimer’s Disease and Advanced Treatment Strategies
Anitha, K., Singh, M. K., Kohat, K., Varshini, T. S., Chenchula, S., Padmavathi, R., Amerneni, L. S., Vishnu Vardhan, K., Mythili Bai, K., Chavan, M. R., et al. (2024) · Molecular Neurobiology · doi:10.1007/s12035-024-04384-1 · Cited by 35
Hernández‐Hernández, E. M., Hernandez, K. C., Vázquez‐Roque, R. A., Díaz, A., de la Cruz, F., Florán, B., & Flores, G. (2018) · Synapse · doi:10.1002/syn.22036 · Cited by 30
Ongnok, B., Maneechote, C., Chunchai, T., Pantiya, P., Arunsak, B., Nawara, W., Chattipakorn, N., & Chattipakorn, S. C. (2022) · FEBS Journal · doi:10.1111/febs.16474 · Cited by 30
Bello-Medina, P. C., Prado-Alcalá, R. A., & Rivas-Arancibia, S. (2019) · Neuroscience · doi:10.1016/j.neuroscience.2019.01.018 · Cited by 29
Heiss, J. K., Barrett, J., Yu, Z., Haas, L. T., Kostylev, M. A., & Strittmatter, S. M. (2016) · Cerebral Cortex · doi:10.1093/cercor/bhw188 · Cited by 30
Parajuli, L. K., Wako, K., Maruo, S., Kakuta, S., Taguchi, T., Ikuno, M., Yamakado, H., Takahashi, R., & Koike, M. (2020) · eNeuro · doi:10.1523/eneuro.0072-20.2020 · Cited by 29
Pin1 mediates Aβ 42 -induced dendritic spine loss
Stallings, N. R., O’Neal, M. A., Hu, J., Kavalali, E. T., Борисович, Б. И., & Malter, J. S. (2018) · Science Signaling · doi:10.1126/scisignal.aap8734 · Cited by 29
Ettcheto, M., Abad, S., Petrov, D., Pedrós, I., Busquets, O., Sánchez‐López, E., Casadesús, G., Beas‐Zárate, C., Carro, E., Auladell, C., et al. (2017) · Molecular Neurobiology · doi:10.1007/s12035-017-0690-4 · Cited by 28
Chae, S., Lee, H., Lee, H.-E., Kim, J., Jeong, Y. J., Lin, Y., Kim, H. Y., Leriche, G., Ehrlich, R. S., Lingl, S. C., et al. (2024) · Journal of Neuroinflammation · doi:10.1186/s12974-024-03180-x · Cited by 28
Expansion of the neocortex and protection from neurodegeneration by in vivo transient reprogramming
Shen, Y.-R., Zaballa, S., Bech, X., Sancho‐Balsells, A., Rodríguez-Navarro, I., Cifuentes-Díaz, C., Seyit-Bremer, G., Chun, S. H., Straub, T., Abante, J., et al. (2024) · Cell stem cell · doi:10.1016/j.stem.2024.09.013 · Cited by 26
Synapse vulnerability and resilience across the clinical spectrum of dementias
Taddei, R. N., & Duff, K. (2025) · Nature Reviews Neurology · doi:10.1038/s41582-025-01094-7 · Cited by 26
Ren, Q., Gong, W.-G., Zhou, H., Shu, H., Wang, Y., & Zhang, Z. (2018) · Neurotherapeutics · doi:10.1007/s13311-018-00698-w · Cited by 26
Villalobos-Acosta, D. M. Á., Chimal‐Vega, B., Correa‐Basurto, J., Morales, L. G. F., & Rosales‐Hernández, M. C. (2018) · International Journal of Molecular Sciences · doi:10.3390/ijms19082415 · Cited by 26
Vasilopoulou, F., Bellver‐Sanchís, A., Companys‐Alemany, J., Jarné‐Ferrer, J., Irisarri, A., Palomera‐Ávalos, V., González-Castillo, C., Ortuño‐Sahagún, D., Sanfeliu, C., Pallàs, M., et al. (2022) · Cells · doi:10.3390/cells11162603 · Cited by 25
Li, S., Li, W., Wu, X., Li, J., Yang, J., Tu, C., Ye, X., & Ling, S. (2019) · Brain Research Bulletin · doi:10.1016/j.brainresbull.2019.03.006 · Cited by 25
Rasia‐Filho, A. A., Guerra, K. T. K., Vásquez, C. E., Dall’Oglio, A., Reberger, R., Jung, C. R., & Calcagnotto, M. E. (2021) · Frontiers in Synaptic Neuroscience · doi:10.3389/fnsyn.2021.616607 · Cited by 24
Nazere, K., Takahashi, T., Hara, N., Muguruma, K., Nakamori, M., Yamazaki, Y., Morino, H., & Maruyama, H. (2022) · Frontiers in Molecular Neuroscience · doi:10.3389/fnmol.2022.804702 · Cited by 26
Cyclosporine A (CsA) prevents synaptic impairment caused by truncated tau by caspase-3
Tapia-Monsalves, C., Olesen, M. A., Villavicencio-Tejo, F., & Quintanilla, R. A. (2023) · Molecular and Cellular Neuroscience · doi:10.1016/j.mcn.2023.103861 · Cited by 24
Neuroinflammation and Alzheimer's disease: Unravelling the molecular mechanisms
Kakkar, A., Singh, H., Singh, B. K., Kumar, A., Mishra, A. K., & Chopra, H. (2025) · Journal of Alzheimer s Disease · doi:10.1177/13872877251374353 · Cited by 26
Stachowicz, K. (2018) · Acta Neurobiologiae Experimentalis · doi:10.21307/ane-2018-019 · Cited by 23
NODDI in gray matter is a sensitive marker of aging and early AD changes
Yu, X., Przybelski, S. A., Reid, R. I., Lesnick, T. G., Raghavan, S., Graff‐Radford, J., Lowe, V. J., Kantarci, K., Knopman, D. S., Petersen, R. C., et al. (2024) · Alzheimer's & Dementia: Diagnosis, Assessment & Disease Monitoring · doi:10.1002/dad2.12627 · Cited by 23
Neurogranin Levels in Cerebrospinal Fluid
Zetterberg, H., & Blennow, K. (2015) · JAMA Neurology · doi:10.1001/jamaneurol.2015.2075 · Cited by 22
Lu, J., Florio, D. N. D., Boya, P., Maday, S., Springer, W., & Chu, C. T. (2025) · Autophagy · doi:10.1080/15548627.2025.2581217 · Cited by 22
Metadata
- Authors
- Dorostkar, M. M., Zou, C., Blazquez-Llorca, L., & Herms, J.
- Affiliations
- Institut für Neuropathologie (DE)
- German Center for Neurodegenerative Diseases (DE)
- Corresponding author
- Herms, Jochen
- Venue
- Acta Neuropathologica
- Published
- 2015-06-11
- Volume
- 130
- Issue
- 1
- Pages
- 1-19
- ISSN
- 0001-6322 (ISSN-L)
- 1432-0533
- PMC
- PMC4469300
- OpenAlex
- W622376569
- Cited by
- 235
- References
- 232
- Citations by year
- 2026: 15 · 2025: 30 · 2024: 34 · 2023: 20 · 2022: 25 · 2021: 29 · 2020: 23 · 2019: 19 · 2018: 13 · 2017: 13 · 2016: 12 · 2015: 2
- FWCI
- 1.59
- Type
- journal article
- Language
- en
- Open access
- hybrid
- doi.org
- Locations
- Acta Neuropathologica (publishedVersion, cc-by)
- PubMed Central (publishedVersion, cc-by)
- PubMed (publishedVersion)
- DZNE Pub (submittedVersion, cc-by)
- Topics
- Life Sciences › Neuroscience › Cellular and Molecular Neuroscience › Alzheimer's disease research and treatments
- Life Sciences › Neuroscience › Cellular and Molecular Neuroscience › Neuroscience and Neuropharmacology Research
- Life Sciences › Neuroscience › Neurology › Neuroinflammation and Neurodegeneration Mechanisms
- Keywords
- dendritic spine loss, Alzheimer's disease, synaptic dysfunction, amyloid-beta, amyloid oligomers, tau hyperphosphorylation, microglial activation, animal models of Alzheimer's disease, cognitive decline, memory impairment
- MeSH terms
- Alzheimer Disease, Amyloid, Animals, Brain, Humans, Dendritic Spines
About these checks
Registry, retraction, Cites and statistics results are computed, not judged, with one exception: a printed reference that no index lists is read once by a model before it counts as a citation error. Claims are extracted by a model and kept only when their quote appears verbatim in the text; each cited source is then checked, with a model’s help, for whether it says what the claim relies on. Those verdicts can be wrong — read the claim’s quote and the cited source before relying on one.
Statistics and arithmetic are recomputed, not judged.
Confidence bands are shown only for fields calibrated on our annotated test set. None is calibrated yet, so no band is shown.
What counts as a claim ›How we measure confidence ›How we check this ›
Are you an author, or do you see a problem with this page? Request a review
