

Morphological and functional variability in central and subcentral motor cortex of the human brain
Open accessPublished version of a preprint
The DOI matches its Crossref record; 75 of the 78 references it cites were found in a registry or an index.
Abstract
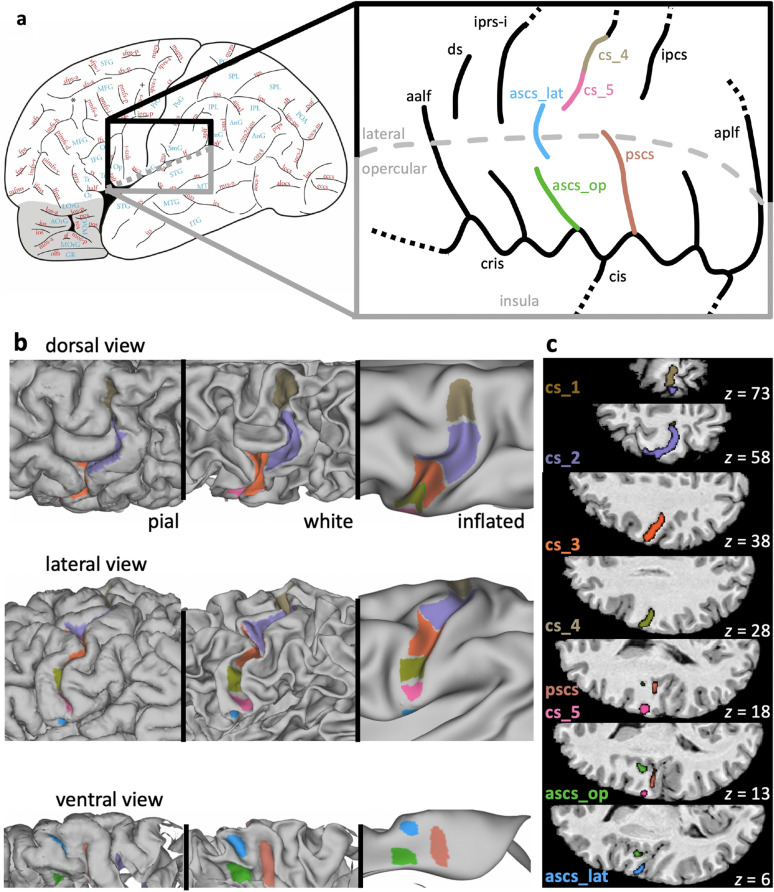
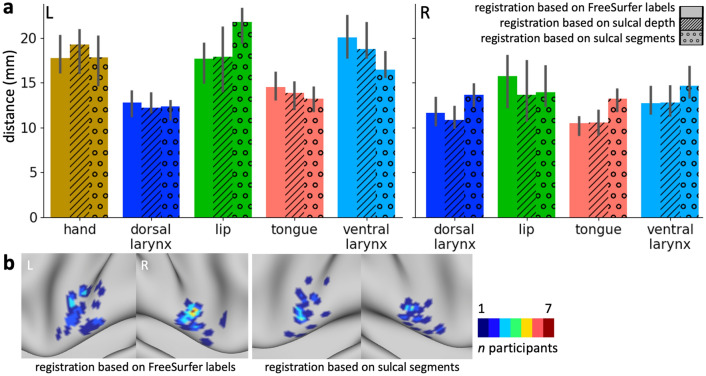
There is a long-established link between anatomy and function in the somatomotor system in the mammalian cerebral cortex. The morphology of the central sulcus is predictive of the location of functional activation peaks relating to movement of different effectors in individuals. By contrast, morphological variation in the subcentral region and its relationship to function is, as yet, unknown. Investigating the subcentral region is particularly important in the context of speech, since control of the larynx during human speech production is related to activity in this region. Here, we examined the relationship between morphology in the central and subcentral region and the location of functional activity during movement of the hand, lips, tongue, and larynx at the individual participant level. We provide a systematic description of the sulcal patterns of the subcentral and adjacent opercular cortex, including the inter-individual variability in sulcal morphology. We show that, in the majority of participants, the anterior subcentral sulcus is not continuous, but consists of two distinct segments. A robust relationship between morphology of the central and subcentral sulcal segments and movement of different effectors is demonstrated. Inter-individual variability of underlying anatomy might thus explain previous inconsistent findings, in particular regarding the ventral larynx area in subcentral cortex. A surface registration based on sulcal labels indicated that such anatomical information can improve the alignment of functional data for group studies.
Overview
The claims and statistics of this paper haven’t been checked yet.
Free: it reads the open-access text and checks the first 5 claims that cite a source we can check. Create a free account to check every claim.
Integrity signals
Registry
Cites
Statistics
Figures


Verification
Claims the paper makes
The claims and statistics of this paper haven’t been checked yet.
Free: it reads the open-access text and checks the first 5 claims that cite a source we can check. Create a free account to check every claim.
Claims other papers make about this one
Each is checked against this paper’s own text: does it say what the citing paper says it does?
The source backs part of the claim, not all of it — or backs it for a different population, condition or comparison.
In the citing paper
“suggesting that they may record cortical activity from the sub-central gyrus36 or production-specific sites within the temporal lobe37.”
From A high-performance neuroprosthesis for speech decoding and avatar control (2023) · cites this paper as [36]
Experimental — accuracy not yet measured
Self-check
Percentages, sums and reported differences re-computed from the paper’s own numbers.
The self-check needs the paper’s full text.
Citations
Cites
Jenkinson, M., Bannister, P., Brady, M., & Smith, S. (2002) · NeuroImage · doi:10.1006/nimg.2002.1132 · Cited by 11,888
A global optimisation method for robust affine registration of brain images
Jenkinson, M., & Smith, S. (2001) · Medical Image Analysis · doi:10.1016/s1361-8415(01)00036-6 · Cited by 6,872
Cortical Surface-Based Analysis
Fischl, B., Sereno, M. I., & Dale, A. M. (1999) · NeuroImage · doi:10.1006/nimg.1998.0396 · Cited by 6,147
Measuring the thickness of the human cerebral cortex from magnetic resonance images
Fischl, B., & Dale, A. M. (2000) · Proceedings of the National Academy of Sciences · doi:10.1073/pnas.200033797 · Cited by 5,818
The WU-Minn Human Connectome Project: An overview
Van Essen, D. C., Smith, S. M., Barch, D. M., Behrens, T. E. J., Yacoub, E., & Ugurbil, K. (2013) · NeuroImage · doi:10.1016/j.neuroimage.2013.05.041 · Cited by 5,651
The minimal preprocessing pipelines for the Human Connectome Project
Glasser, M. F., Sotiropoulos, S. N., Wilson, J. A., Coalson, T. S., Fischl, B., Andersson, J. L., Xu, J., Jbabdi, S., Webster, M., Polimeni, J. R., et al. (2013) · NeuroImage · doi:10.1016/j.neuroimage.2013.04.127 · Cited by 5,253
PENFIELD, W., & BOLDREY, E. (1937) · Brain · doi:10.1093/brain/60.4.389 · Cited by 4,188
NODDI: Practical in vivo neurite orientation dispersion and density imaging of the human brain
Zhang, H., Schneider, T., Wheeler-Kingshott, C. A., & Alexander, D. C. (2012) · NeuroImage · doi:10.1016/j.neuroimage.2012.03.072 · Cited by 3,288
Temporal Autocorrelation in Univariate Linear Modeling of FMRI Data
Woolrich, M. W., Ripley, B. D., Brady, M., & Smith, S. M. (2001) · NeuroImage · doi:10.1006/nimg.2001.0931 · Cited by 2,852
Unbiased average age-appropriate atlases for pediatric studies
Fonov, V., Evans, A. C., Botteron, K., Almli, C. R., McKinstry, R. C., & Collins, D. L. (2011) · NeuroImage · doi:10.1016/j.neuroimage.2010.07.033 · Cited by 2,290 · cited 1×
“A linear transformation (12 degrees of freedom) from the high-resolution T1w anatomical scans to standard MNI space (nonlinear 6th generation atlas, Fonov et al. 2011) was derived using FSL’s FLIRT (Jenkinson and Smith 2001; Jenkinson et al. 2002) and further refined using FNIRT nonlinear…”
Method
Research works printed but not linked: 4
- Broca P (1861) Remarques sur le siège de la faculté du langage articulé suivies d’une observation d’aphemie. Bull Soc Anthropol 6:330–357
- Jackson J (1863) Convulsive spasms of the right hand and arm preceding epileptic seizures. Med Times Gaz 1:110–111
- McCarthy P (2020) FSLeyes (Version 0.33.0). Zenodo http://doi.org/105281/zenodo3858136
- Petrides M (2019) Atlas of the morphology of the human cerebral cortex on the average MNI brain. Academic Press, New York
Cited by
A high-performance neuroprosthesis for speech decoding and avatar control
Metzger, S. L., Littlejohn, K. T., Silva, A. B., Moses, D. A., Seaton, M. P., Wang, R., Dougherty, M. E., Liu, J. R., Wu, P., Berger, M. A., et al. (2023) · Nature · doi:10.1038/s41586-023-06443-4 · Cited by 522
White matter variability, cognition, and disorders: a systematic review
Forkel, S. J., Friedrich, P., de Schotten, M. T., & Howells, H. (2021) · Brain Structure and Function · doi:10.1007/s00429-021-02382-w · Cited by 155
Beyond Broca: neural architecture and evolution of a dual motor speech coordination system
Hickok, G. S., Venezia, J. H., & Teghipco, A. (2022) · Brain · doi:10.1093/brain/awac454 · Cited by 95
Mapping Human Laryngeal Motor Cortex during Vocalization
Eichert, N., Papp, D., Mars, R. B., & Watkins, K. E. (2020) · Cerebral Cortex · doi:10.1093/cercor/bhaa182 · Cited by 89
Self-citationSulcal depth in prefrontal cortex: a novel predictor of working memory performance
Yao, J. K., Voorhies, W. I., Miller, J. A., Bunge, S. A., & Weiner, K. S. (2022) · Cerebral Cortex · doi:10.1093/cercor/bhac173 · Cited by 68
Metadata
- Authors
- Eichert, N., Watkins, K. E., Mars, R. B., & Petrides, M.
- Affiliations
- John Radcliffe Hospital (GB)
- University of Oxford (GB)
- Radboud University Nijmegen (NL)
- Montreal Neurological Institute and Hospital (CA)
- Corresponding author
- Eichert, Nicole
- Venue
- Brain Structure and Function
- Published
- 2020-12-23
- Volume
- 226
- Issue
- 1
- Pages
- 263-279
- ISSN
- 1863-2653 (ISSN-L)
- 1863-2661
- PMC
- PMC7817568
- OpenAlex
- W3012321363
- Cited by
- 58
- References
- 78
- Citations by year
- 2026: 4 · 2025: 12 · 2024: 9 · 2023: 6 · 2022: 12 · 2021: 13 · 2020: 2
- FWCI
- 4.43
- Type
- journal article
- Language
- en
- Open access
- hybrid
- doi.org
- Licence
- cc-by
- creativecommons.org/licenses/by/4.0 (tdm)
- creativecommons.org/licenses/by/4.0 (vor)
- Locations
- Brain Structure and Function (publishedVersion, cc-by)
- bioRxiv (Cold Spring Harbor Laboratory) (acceptedVersion, cc-by-nc)
- PubMed Central (publishedVersion, cc-by)
- PubMed (publishedVersion)
- Radboud Repository (Radboud University) (submittedVersion)
- Radboud Repository (Radboud University) (submittedVersion, other-oa)
- Funders
- Wellcome Trust (203730/Z/16/Z, 203139/Z/16/Z)
- Biotechnology and Biological Sciences Research Council (BB/N019814/1)
- Nederlandse Organisatie voor Wetenschappelijk Onderzoek (452-13-015)
- Lazlo and Etelka Kollar Brain@McGill Travel Grant (--)
- University of Oxford
- Topics
- Life Sciences › Neuroscience › Cognitive Neuroscience › Motor Control and Adaptation
- Life Sciences › Neuroscience › Cognitive Neuroscience › Neurobiology of Language and Bilingualism
- Life Sciences › Neuroscience › Cognitive Neuroscience › Tactile and Sensory Interactions
- Keywords
- central sulcus, sulcal morphology, interindividual variability, laryngeal movement, speech production, hand movement, surface registration
- MeSH terms
- Adolescent, Adult, Brain Mapping, Female, Hand, Humans, Larynx, Lip, Magnetic Resonance Imaging, Male, Motor Cortex, Movement, Speech, Tongue, Young Adult
About these checks
Registry, retraction, Cites and statistics results are computed, not judged, with one exception: a printed reference that no index lists is read once by a model before it counts as a citation error. Claims are extracted by a model and kept only when their quote appears verbatim in the text; each cited source is then checked, with a model’s help, for whether it says what the claim relies on. Those verdicts can be wrong — read the claim’s quote and the cited source before relying on one.
Statistics and arithmetic are recomputed, not judged.
Confidence bands are shown only for fields calibrated on our annotated test set. None is calibrated yet, so no band is shown.
What counts as a claim ›How we measure confidence ›How we check this ›
Are you an author, or do you see a problem with this page? Request a review
How to cite
Cite CoChat for the checks on this page, and the paper for its own findings.
- This page
- CoChat. (2026). Citation check: Morphological and functional variability in central and subcentral motor cortex of the human brain. https://app.cochat.ai/papers/10.1007/s00429-020-02180-w
- The paper
- Eichert, N., Watkins, K. E., Mars, R. B., & Petrides, M. (2021). Morphological and functional variability in central and subcentral motor cortex of the human brain. Brain Structure and Function. https://doi.org/10.1007/s00429-020-02180-w
Data sources
Bibliographic data: Semantic Scholar, OpenAlex, Crossref.
Contains information from the Semantic Scholar Academic Graph Datasets, made available under the ODC Attribution License (ODC-BY 1.0).
Semantic Scholar’s data is described in: Kinney, R., et al. (2023). The Semantic Scholar Open Data Platform. arXiv:2301.10140.
