

The DOI matches its Crossref record; 103 of the 103 references it cites were found in a registry or an index.
Mapping Human Laryngeal Motor Cortex during Vocalization
Open accessPublished version of a preprint
Abstract
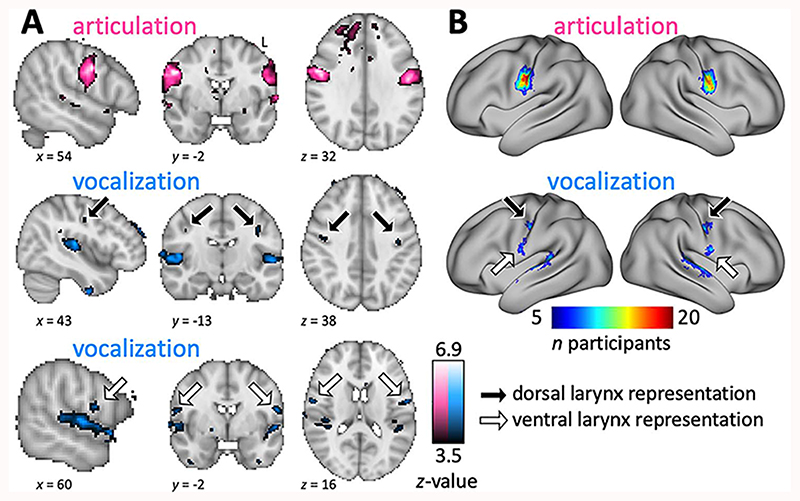
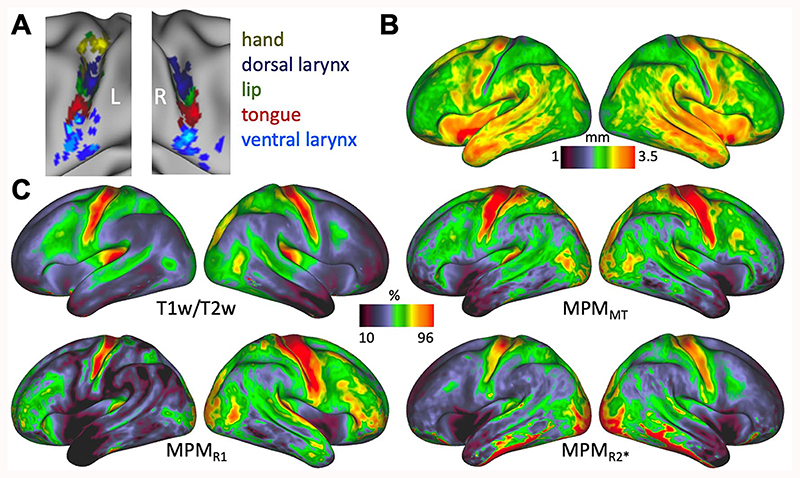
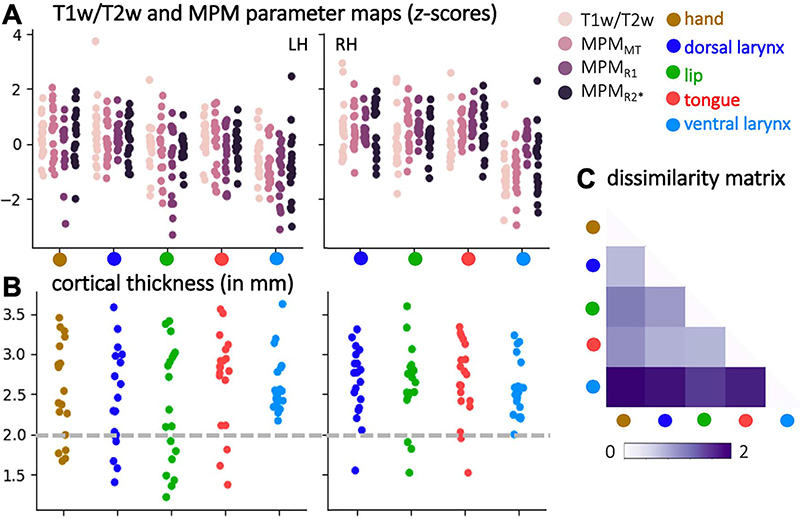
The representations of the articulators involved in human speech production are organized somatotopically in primary motor cortex. The neural representation of the larynx, however, remains debated. Both a dorsal and a ventral larynx representation have been previously described. It is unknown, however, whether both representations are located in primary motor cortex. Here, we mapped the motor representations of the human larynx using functional magnetic resonance imaging and characterized the cortical microstructure underlying the activated regions. We isolated brain activity related to laryngeal activity during vocalization while controlling for breathing. We also mapped the articulators (the lips and tongue) and the hand area. We found two separate activations during vocalization—a dorsal and a ventral larynx representation. Structural and quantitative neuroimaging revealed that myelin content and cortical thickness underlying the dorsal, but not the ventral larynx representation, are similar to those of other primary motor representations. This finding confirms that the dorsal larynx representation is located in primary motor cortex and that the ventral one is not. We further speculate that the location of the ventral larynx representation is in premotor cortex, as seen in other primates. It remains unclear, however, whether and how these two representations differentially contribute to laryngeal motor control.
Overview
The claims and statistics of this paper haven’t been checked yet.
Free: it reads the open-access text and checks the first 5 claims that cite a source we can check. Create a free account to check every claim.
Integrity signals
Registry
Cites
Statistics
Figures


Verification
Claims the paper makes
The claims and statistics of this paper haven’t been checked yet.
Free: it reads the open-access text and checks the first 5 claims that cite a source we can check. Create a free account to check every claim.
Claims other papers make about this one
Each is checked against this paper’s own text: does it say what the citing paper says it does?
The source backs part of the claim, not all of it — or backs it for a different population, condition or comparison.
In the citing paper
“Subsequent work discovered that SMC populations encode articulatory kinematic trajectories and vocal-tract configurations43 during continuous speech24,39,44,45 (Fig. 1; Mugler et al. 2018, Chartier et al. 2018 and Dichter et al. 2018).”
From The speech neuroprosthesis (2024) · cites this paper as [39]
Experimental — accuracy not yet measuredThe cited source says what the claim attributes to it.
In the citing paper
“In healthy speakers, neural representations in the SMC (comprising the precentral and postcentral gyri) encode articulatory movements of the orofacial musculature22,24,30.”
From A high-performance neuroprosthesis for speech decoding and avatar control (2023) · cites this paper as [30]
Experimental — accuracy not yet measuredThe cited source says what the claim attributes to it.
In the citing paper
“many studies have already found that multiple myelin markers can provide complementary information (Callaghan, Freund, Draganski, Anderson, Cappelletti, Chowdhury, Diedrichsen, Fitzgerald, Smittenaar, Helms, Lutti, Weiskopf, 2014, Eichert et al., 2020, Kolind, Laule, Vavasour, Li, Traboulsee, Mädler, Moore, Mackay, 2008, Lipp, Jones, Bells, Sgarlata, Foster, Stickland, Davidson, Tallantyre, Rober”
From Can MRI measure myelin? Systematic review, qualitative assessment, and meta-analysis of studies validating microstructural imaging with myelin histology (2021) · cites this paper as Eichert et al., 2020
Self-check
Percentages, sums and reported differences re-computed from the paper’s own numbers.
The self-check needs the paper’s full text.
Citations
Cites
Fitting Linear Mixed-Effects Models Using lme4
Bates, D., Mächler, M., Bolker, B., & Walker, S. (2015) · Journal of Statistical Software · doi:10.18637/jss.v067.i01 · Cited by 86,835
Jenkinson, M., Bannister, P., Brady, M., & Smith, S. (2002) · NeuroImage · doi:10.1006/nimg.2002.1132 · Cited by 11,888
Jenkinson, M., Beckmann, C. F., Behrens, T. E. J., Woolrich, M. W., & Smith, S. M. (2012) · NeuroImage · doi:10.1016/j.neuroimage.2011.09.015 · Cited by 11,314
Fast robust automated brain extraction
Smith, S. M. (2002) · Human Brain Mapping · doi:10.1002/hbm.10062 · Cited by 10,496
Fischl, B. (2012) · NeuroImage · doi:10.1016/j.neuroimage.2012.01.021 · Cited by 9,526
The organization of the human cerebellum estimated by intrinsic functional connectivity
Buckner, R. L., Krienen, F. M., Castellanos, A., Diaz, J. C., & Yeo, B. T. T. (2011) · Journal of Neurophysiology · doi:10.1152/jn.00339.2011 · Cited by 7,304
A global optimisation method for robust affine registration of brain images
Jenkinson, M., & Smith, S. (2001) · Medical Image Analysis · doi:10.1016/s1361-8415(01)00036-6 · Cited by 6,872
Measuring the thickness of the human cerebral cortex from magnetic resonance images
Fischl, B., & Dale, A. M. (2000) · Proceedings of the National Academy of Sciences · doi:10.1073/pnas.200033797 · Cited by 5,818
The minimal preprocessing pipelines for the Human Connectome Project
Glasser, M. F., Sotiropoulos, S. N., Wilson, J. A., Coalson, T. S., Fischl, B., Andersson, J. L., Xu, J., Jbabdi, S., Webster, M., Polimeni, J. R., et al. (2013) · NeuroImage · doi:10.1016/j.neuroimage.2013.04.127 · Cited by 5,253
PENFIELD, W., & BOLDREY, E. (1937) · Brain · doi:10.1093/brain/60.4.389 · Cited by 4,188
Research works printed but not linked: 4
- Bailey, 1950, The isocortex of the chimpanzee
- Brodmann, 1905, Beitrage zur histologischen Lokalisation der Grosshirnrinde: III. Mitteilung. Die Rindenfelder der niederen Affen, J Psychol Neurol, 4, 177
- Fiez, 1997, The Cerebellum and Cognition (International Review of Neurobiology), 233
- Foerster, 1936, Symptomatologie der Erkrankungen des Grosshirns. Motorische Felder und Bahnen. Sensible corticale Felder, Handbuch der Neurologie 6
Cited by
A somato-cognitive action network alternates with effector regions in motor cortex
Gordon, E. M., Chauvin, R. J., Van, A. N., Rajesh, A., Nielsen, A., Newbold, D. J., Lynch, C. J., Seider, N. A., Krimmel, S. R., Scheidter, K. M., et al. (2023) · Nature · doi:10.1038/s41586-023-05964-2 · Cited by 592
A high-performance neuroprosthesis for speech decoding and avatar control
Metzger, S. L., Littlejohn, K. T., Silva, A. B., Moses, D. A., Seaton, M. P., Wang, R., Dougherty, M. E., Liu, J. R., Wu, P., Berger, M. A., et al. (2023) · Nature · doi:10.1038/s41586-023-06443-4 · Cited by 522
Lazari, A., & Lipp, I. (2021) · NeuroImage · doi:10.1016/j.neuroimage.2021.117744 · Cited by 197
A Neurosurgical Functional Dissection of the Middle Precentral Gyrus during Speech Production
Silva, A. B., Liu, J. R., Zhao, L., Levy, D. F., Scott, T. L., & Chang, E. F. (2022) · The Journal of Neuroscience · doi:10.1523/jneurosci.1614-22.2022 · Cited by 111
“Notably, the functional localization of the dLMC and vLMC has been confirmed by a recent fMRI study that used novel analysis techniques to account for individual variation and breathing that may have complicated earlier imaging attempts (Eichert et al., 2020).”
ResultSilva, A. B., Littlejohn, K. T., Liu, J. R., Moses, D. A., & Chang, E. F. (2024) · Nature Reviews Neuroscience · doi:10.1038/s41583-024-00819-9 · Cited by 103
“Phonemes are defined as the smallest perceptually distinct units of sound that form a language (39 unstressed phonemes exist in English) 32,33 .”
Influential
Metadata
- Authors
- Eichert, N., Papp, D., Mars, R. B., & Watkins, K. E.
- Affiliations
- John Radcliffe Hospital (GB)
- Radboud University Nijmegen (NL)
- University of Oxford (GB)
- Corresponding author
- Eichert, Nicole
- Venue
- Cerebral Cortex
- Publisher
- Oxford University Press (OUP)
- Published
- 2020-07-30
- Volume
- 30
- Issue
- 12
- Pages
- 6254-6269
- ISSN
- 1047-3211 (ISSN-L)
- 1460-2199
- PMC
- PMC7610685
- OpenAlex
- W3036586088
- Semantic Scholar
- 9b3730b3f7f1b6da87f00543aaf66a2274f0418a
- Cited by
- 89
- References
- 102
- Citations by year
- 2026: 15 · 2025: 15 · 2024: 13 · 2023: 24 · 2022: 8 · 2021: 10 · 2020: 4
- FWCI
- 6.18
- Type
- journal article
- Language
- en
- Open access
- hybrid
- doi.org
- Licence
- Locations
- Cerebral Cortex (publishedVersion, cc-by)
- bioRxiv (Cold Spring Harbor Laboratory) (acceptedVersion, cc-by-nc)
- PubMed (publishedVersion)
- PubMed Central (acceptedVersion, cc-by)
- Radboud Repository (Radboud University) (submittedVersion)
- Radboud Repository (Radboud University) (submittedVersion, other-oa)
- Funders
- Neuroscience at the University of Oxford (203730/Z/16/Z)
- Wellcome Centre for Integrative Neuroimaging
- Wellcome Trust (203139/Z/16/Z)
- Biotechnology and Biological Sciences Research Council (BB/N019814/1)
- Netherlands Organization for Scientific Research NWO (452-13-015)
- Topics
- Life Sciences › Neuroscience › Cognitive Neuroscience › Neurobiology of Language and Bilingualism
- Life Sciences › Neuroscience › Cognitive Neuroscience › Tactile and Sensory Interactions
- Social Sciences › Psychology › Experimental and Cognitive Psychology › Phonetics and Phonology Research
- Keywords
- larynx, primary motor cortex, vocalizations, somatotopic mapping, myelin content, cortical thickness, premotor cortex, speech articulators, laryngeal motor control
- MeSH terms
- Adolescent, Adult, Brain Mapping, Female, Humans, Larynx, Magnetic Resonance Imaging, Male, Motor Cortex, Speech, Young Adult
About these checks
Registry, retraction, Cites and statistics results are computed, not judged, with one exception: a printed reference that no index lists is read once by a model before it counts as a citation error. Claims are extracted by a model and kept only when their quote appears verbatim in the text; each cited source is then checked, with a model’s help, for whether it says what the claim relies on. Those verdicts can be wrong — read the claim’s quote and the cited source before relying on one.
Statistics and arithmetic are recomputed, not judged.
Confidence bands are shown only for fields calibrated on our annotated test set. None is calibrated yet, so no band is shown.
What counts as a claim ›How we measure confidence ›How we check this ›
Are you an author, or do you see a problem with this page? Request a review
How to cite
Cite CoChat for the checks on this page, and the paper for its own findings.
- This page
- CoChat. (2026). Citation check: Mapping Human Laryngeal Motor Cortex during Vocalization. https://app.cochat.ai/papers/10.1093/cercor/bhaa182
- The paper
- Eichert, N., Papp, D., Mars, R. B., & Watkins, K. E. (2020). Mapping Human Laryngeal Motor Cortex during Vocalization. Cerebral Cortex. https://doi.org/10.1093/cercor/bhaa182
Data sources
Bibliographic data: Semantic Scholar, OpenAlex, Crossref.
Contains information from the Semantic Scholar Academic Graph Datasets, made available under the ODC Attribution License (ODC-BY 1.0).
Semantic Scholar’s data is described in: Kinney, R., et al. (2023). The Semantic Scholar Open Data Platform. arXiv:2301.10140.
