

The DOI matches its Crossref record; 65 of the 65 references it cites were found in a registry or an index.
Using an Automated Speech Recognition Approach to Differentiate Between Normal and Aspirating Swallowing Sounds Recorded from Digital Cervical Auscultation in Children
Open accessAbstract
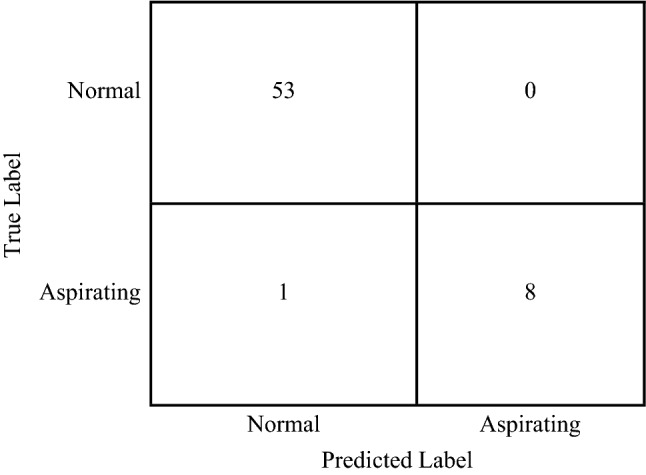
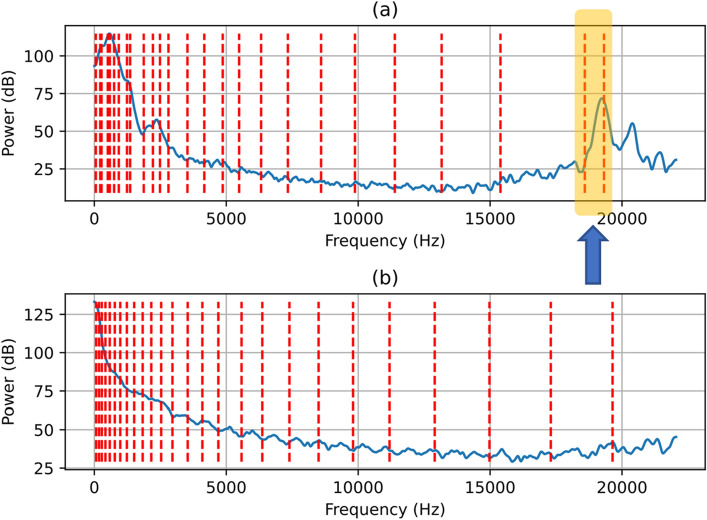
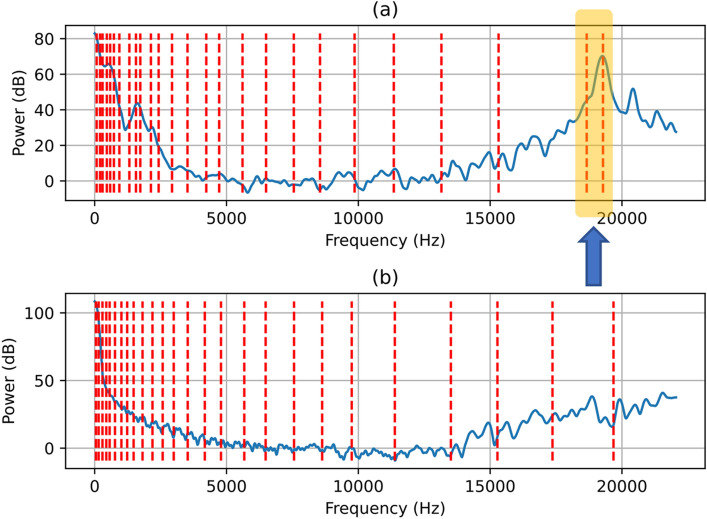
Use of machine learning to accurately detect aspirating swallowing sounds in children is an evolving field. Previously reported classifiers for the detection of aspirating swallowing sounds in children have reported sensitivities between 79 and 89%. This study aimed to investigate the accuracy of using an automatic speaker recognition approach to differentiate between normal and aspirating swallowing sounds recorded from digital cervical auscultation in children. We analysed 106 normal swallows from 23 healthy children (median 13 months; 52.1% male) and 18 aspirating swallows from 18 children (median 10.5 months; 61.1% male) who underwent concurrent videofluoroscopic swallow studies with digital cervical auscultation. All swallowing sounds were on thin fluids. A support vector machine classifier with a polynomial kernel was trained on feature vectors that comprised the mean and standard deviation of spectral subband centroids extracted from each swallowing sound in the training set. The trained support vector machine was then used to classify swallowing sounds in the test set. We found high accuracy in the differentiation of aspirating and normal swallowing sounds with 98% overall accuracy. Sensitivity for the detection of aspiration and normal swallowing sounds were 89% and 100%, respectively. There were consistent differences in time, power spectral density and spectral subband centroid features between aspirating and normal swallowing sounds in children. This study provides preliminary research evidence that aspirating and normal swallowing sounds in children can be differentiated accurately using machine learning techniques.
Overview
The claims and statistics of this paper haven’t been checked yet.
Free: it reads the open-access text and checks the first 5 claims that cite a source we can check. Create a free account to check every claim.
Integrity signals
Registry
Cites
Statistics
Figures





Verification
Claims the paper makes
The claims and statistics of this paper haven’t been checked yet.
Free: it reads the open-access text and checks the first 5 claims that cite a source we can check. Create a free account to check every claim.
Claims other papers make about this one
Each is checked against this paper’s own text: does it say what the citing paper says it does?
The source backs part of the claim, not all of it — or backs it for a different population, condition or comparison.
In the citing paper
“In the pediatric population, cerebral palsy was the most cited condition in studies focusing on this age group(20,37,49).”
From Artificial intelligence in the diagnosis and management of dysphagia: a scoping review (2025) · cites this paper as [20]
Experimental — accuracy not yet measured
Self-check
Percentages, sums and reported differences re-computed from the paper’s own numbers.
The self-check needs the paper’s full text.
Citations
Cites
Scikit-learn: Machine Learning in Python
Pedregosa, F., Varoquaux, G., Gramfort, A., Michel, V., Thirion, B., Grisel, O., Blondel, M., Müller, A., Nothman, J., Louppe, G., et al. (2012) · arXiv · doi:10.48550/arxiv.1201.0490 · Cited by 71,016
The Nature of Statistical Learning Theory
Vapnik, V. N. (1995) · doi:10.1007/978-1-4757-2440-0 · Cited by 39,138
Fundamentals of speech recognition
Rabiner, L. R., & Juang, B.-H. F. (1993) · Cited by 7,680
Davis, S., & Mermelstein, P. (1980) · IEEE Transactions on Acoustics, Speech, and Signal Processing · doi:10.1109/tassp.1980.1163420 · Cited by 5,465
A penetration-aspiration scale
Rosenbek, J. C., Robbins, J. A., Roecker, E. B., Coyle, J. L., & Wood, J. L. (1996) · Dysphagia · doi:10.1007/bf00417897 · Cited by 2,803 · cited 1×
“Conferral on the presence/absence of aspiration was jointly completed by a paediatric speech pathologist and radiologist; and objectively rated by a speech pathologist post-VFSS, using the Penetration–Aspiration Scale [47].”
MethodPattern recognition and machine learning
(2007) · Choice Reviews Online · doi:10.5860/choice.44-5091 · Cited by 2,650
Perceptual linear predictive (PLP) analysis of speech
Hermansky, H. (1990) · The Journal of the Acoustical Society of America · doi:10.1121/1.399423 · Cited by 2,536
Machine learning in medicine: a practical introduction
Sidey-Gibbons, J. A. M., & Sidey-Gibbons, C. J. (2019) · BMC Medical Research Methodology · doi:10.1186/s12874-019-0681-4 · Cited by 1,271
Speech Analysis and Synthesis by Linear Prediction of the Speech Wave
Atal, B. S., & Hanauer, S. L. (1971) · The Journal of the Acoustical Society of America · doi:10.1121/1.1912679 · Cited by 1,209
Ethical Machine Learning in Healthcare
Chen, I. Y., Pierson, E., Rose, S., Joshi, S., Ferryman, K., & Ghassemi, M. (2021) · Annual Review of Biomedical Data Science · doi:10.1146/annurev-biodatasci-092820-114757 · Cited by 645
Research works printed but not linked: 1
- Vieira AMS. Machine learning. Cambridge: Academic Press; 2019.
Cited by
Lai, D. K.-H., Cheng, E. S.-W., Lim, H.-J., So, B. P.-H., Lam, W., Cheung, D. S. K., Wong, D. W., & Cheung, J. C. (2023) · Frontiers in Bioengineering and Biotechnology · doi:10.3389/fbioe.2023.1205009 · Cited by 22
Konradi, J., Zajber, M., Betz, U., Drees, P., Gerken, A., & Meine, H. (2022) · Sensors · doi:10.3390/s22239468 · Cited by 12
Artificial Intelligence and Pediatric Otolaryngology
Huang, A. E., & Valdez, T. A. (2024) · Otolaryngologic Clinics of North America · doi:10.1016/j.otc.2024.04.011 · Cited by 10
Kimura, S., Emoto, T., Suzuki, Y., Shinkai, M., Shibagaki, A., & Shichijo, F. (2024) · Sensors · doi:10.3390/s24103057 · Cited by 7
Cron, A. C., David, M., Orbell‐Smith, J., Chang, A. B., Weir, K. A., & Frakking, T. T. (2024) · Clinical Otolaryngology · doi:10.1111/coa.14202 · Cited by 8
Self-citation
Metadata
- Authors
- Frakking, T. T., Chang, A. B., Carty, C., Newing, J., Weir, K. A., Schwerin, B., & So, S.
- Affiliations
- Queensland Health (AU)
- Queensland University of Technology (AU)
- Griffith University (AU)
- Corresponding author
- Frakking, Thuy T.
- Venue
- Dysphagia
- Published
- 2022-01-29
- Volume
- 37
- Issue
- 6
- Pages
- 1482-1492
- ISSN
- 0179-051X (ISSN-L)
- 1432-0460
- PMC
- PMC9643257
- OpenAlex
- W4210547799
- Cited by
- 23
- References
- 65
- Citations by year
- 2026: 7 · 2025: 6 · 2024: 4 · 2023: 3 · 2022: 2
- FWCI
- 4.72
- Type
- journal article
- Language
- en
- Open access
- hybrid
- doi.org
- Licence
- cc-by
- creativecommons.org/licenses/by/4.0 (tdm)
- creativecommons.org/licenses/by/4.0 (vor)
- Locations
- Dysphagia (publishedVersion, cc-by)
- PubMed Central (publishedVersion, cc-by)
- PubMed (publishedVersion)
- QUT ePrints (Queensland University of Technology) (submittedVersion, cc-by)
- Minerva Access (University of Melbourne) (submittedVersion, cc-by)
- Griffith Research Online (submittedVersion, cc-by)
- Funders
- national health and medical research council (1058213)
- metro north hospital and health service (CRF-145-2021)
- The University of Queensland
- Topics
- Health Sciences › Health Professions › Speech and Hearing › Dysphagia Assessment and Management
- Health Sciences › Health Professions › Speech and Hearing › Voice and Speech Disorders
- Health Sciences › Medicine › Pulmonary and Respiratory Medicine › Phonocardiography and Auscultation Techniques
- Keywords
- aspiration detection, children, support vector machine, power spectral density, swallowing sounds, videofluoroscopic swallowing study
- MeSH terms
- Auscultation, Child, Deglutition, Deglutition Disorders, Female, Humans, Male, Sound, Speech Perception
About these checks
Registry, retraction, Cites and statistics results are computed, not judged, with one exception: a printed reference that no index lists is read once by a model before it counts as a citation error. Claims are extracted by a model and kept only when their quote appears verbatim in the text; each cited source is then checked, with a model’s help, for whether it says what the claim relies on. Those verdicts can be wrong — read the claim’s quote and the cited source before relying on one.
Statistics and arithmetic are recomputed, not judged.
Confidence bands are shown only for fields calibrated on our annotated test set. None is calibrated yet, so no band is shown.
What counts as a claim ›How we measure confidence ›How we check this ›
Are you an author, or do you see a problem with this page? Request a review
How to cite
Cite CoChat for the checks on this page, and the paper for its own findings.
- This page
- CoChat. (2026). Citation check: Using an Automated Speech Recognition Approach to Differentiate Between Normal and Aspirating Swallowing Sounds Recorded from Digital Cervical Auscultation in Children. https://app.cochat.ai/papers/10.1007/s00455-022-10410-y
- The paper
- Frakking, T. T., Chang, A. B., Carty, C., Newing, J., Weir, K. A., Schwerin, B., & So, S. (2022). Using an Automated Speech Recognition Approach to Differentiate Between Normal and Aspirating Swallowing Sounds Recorded from Digital Cervical Auscultation in Children. Dysphagia. https://doi.org/10.1007/s00455-022-10410-y
Data sources
Bibliographic data: Semantic Scholar, OpenAlex, Crossref.
Contains information from the Semantic Scholar Academic Graph Datasets, made available under the ODC Attribution License (ODC-BY 1.0).
Semantic Scholar’s data is described in: Kinney, R., et al. (2023). The Semantic Scholar Open Data Platform. arXiv:2301.10140.
