

The DOI matches its Crossref record; 69 of the 69 references it cites were found in a registry or an index; none of the 21 sources its claims cite is checked for support yet.
Acute and chronic hypopituitarism following traumatic brain injury: a systematic review and meta-analysis
Open accessAbstract
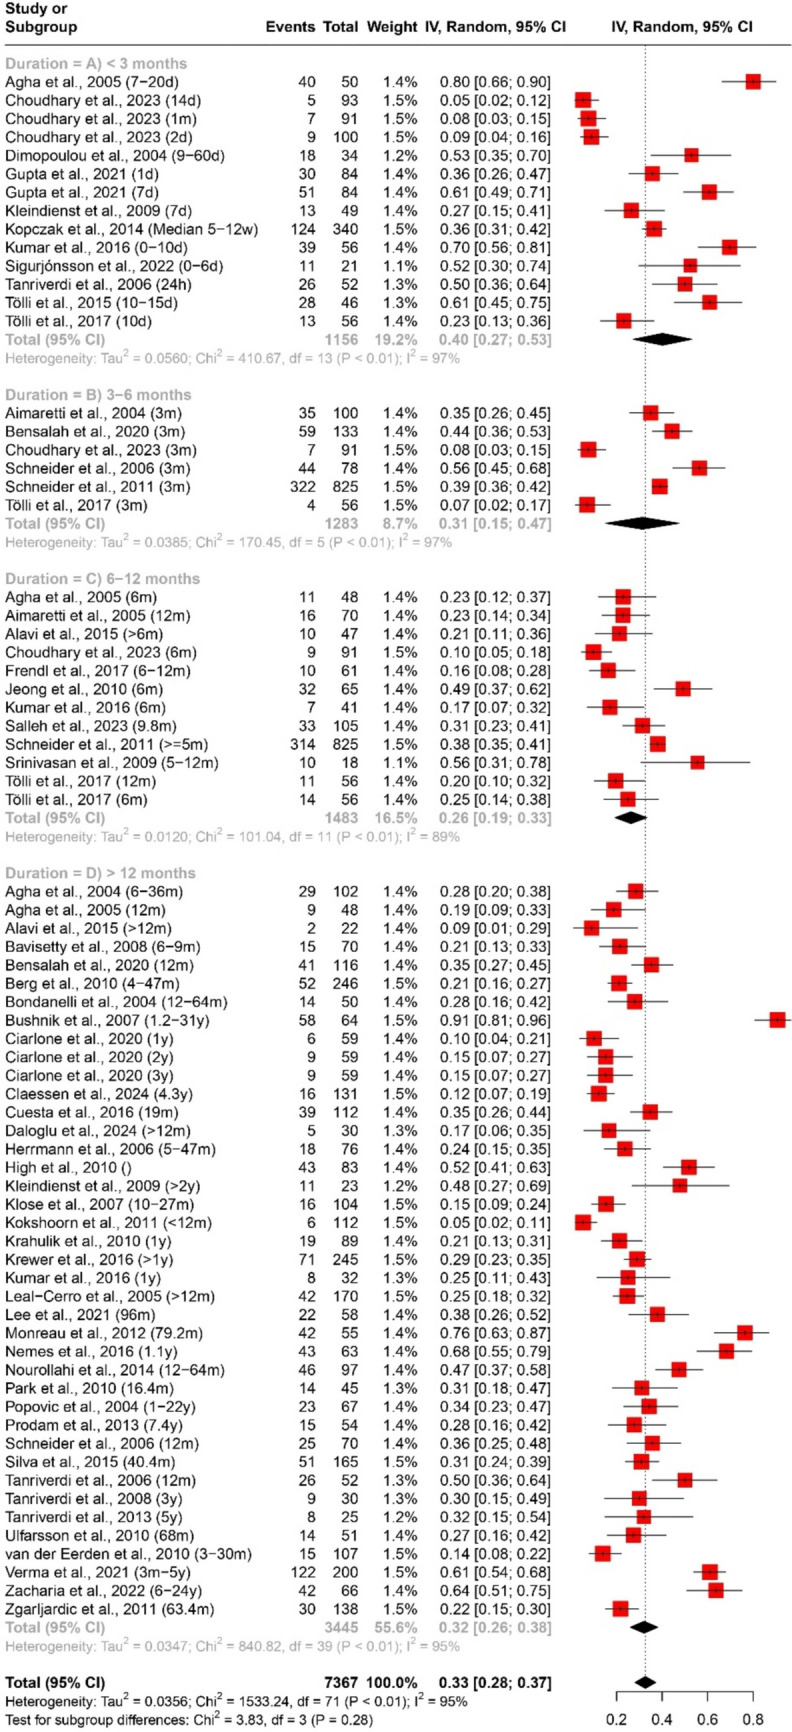
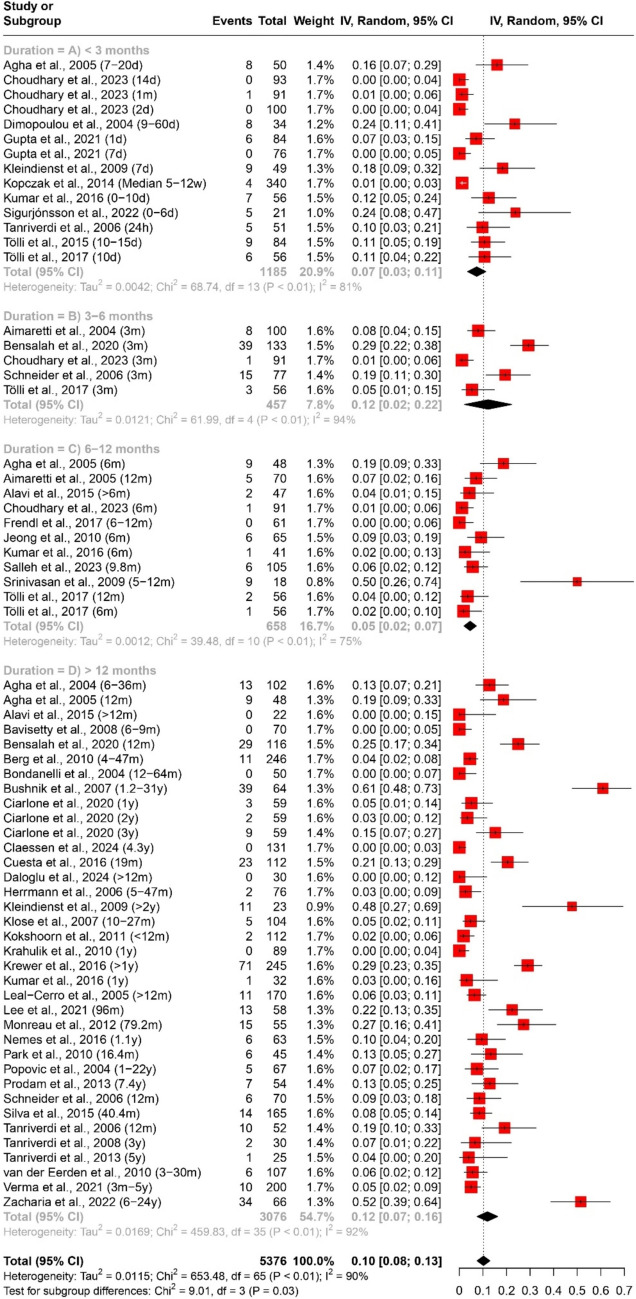
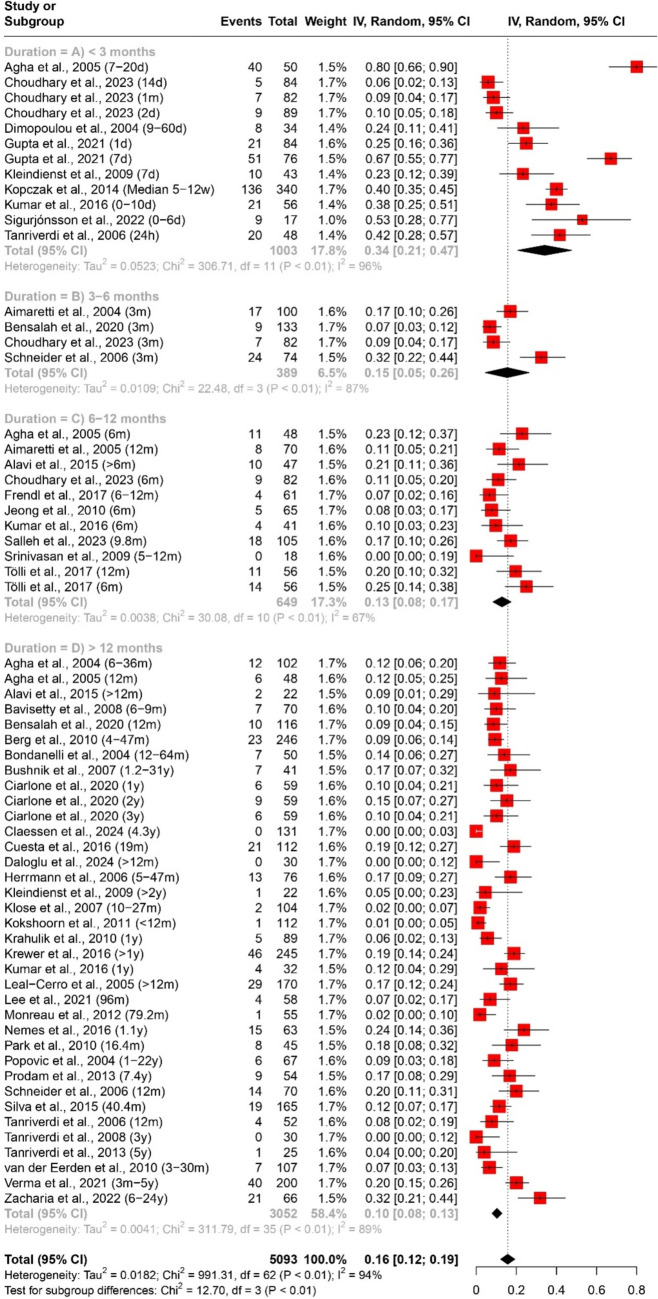
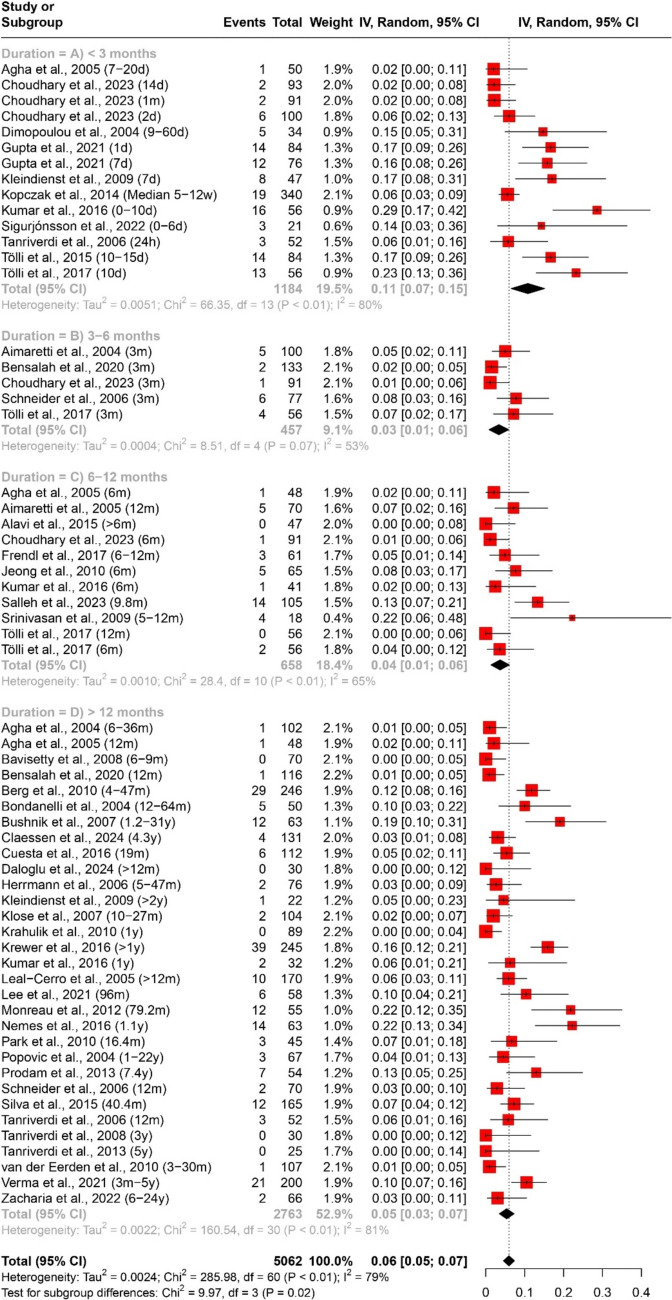
Traumatic brain injury (TBI) is associated with various endocrine abnormalities, including pituitary axis dysfunction. Understanding the prevalence and temporal patterns of these dysfunctions is crucial for effective clinical management. This study aimed to systematically review the literature and conduct a meta-analysis to determine the prevalence of pituitary axis dysfunction following TBI, assess temporal patterns across different post-injury durations, and identify potential contributing factors. A comprehensive search was conducted across multiple electronic databases between 1st of January 2000 until 31st March 2024. Studies reporting the prevalence of pituitary axis dysfunction post-TBI were included. Pooled estimates with 95% confidence intervals (CIs) were calculated using random-effects models in the R statistical software. Subgroup analyses were performed based on duration post-TBI (< 3 months, 3–6 months, 6–12 months, > 12 months) to explore temporal variations. Heterogeneity was assessed using the I^2 statistic. A total of 52 studies were included in the meta-analysis, encompassing 7367 participants. The pooled estimate for the prevalence of any pituitary axis dysfunction post-TBI was 33% (95% CI [28%; 37%]). Subgroup analysis by duration revealed varying prevalence rates: < 3 months (40%, 95% CI [27%; 53%]), 3–6 months (31%, 95% CI [15%; 47%]), 6–12 months (26%, 95% CI [19%; 33%]), and > 12 months (32%, 95% CI [26%; 38%]). Prevalence of multiple axes affection was 7% (95% CI [6%; 9%]), with varying rates across durations. Specific axes affection varied: Growth Hormone (GH) deficiency was 18% (95% CI [14%; 21%]), adrenocorticotropic hormone (ACTH) deficiency was 10% (95% CI [8%; 13%]), pituitary–gonadal axis hormones deficiency was 16% (95% CI [12%; 19%]), and thyroid-stimulating hormone (TSH) deficiency was 6% (95% CI [5%; 7%]). This meta-analysis highlights a significant prevalence of pituitary axis dysfunction following TBI, with temporal variations observed across different post-injury durations. The findings underscore the importance of tailored clinical management strategies based on the duration and type of dysfunction. Further research addressing potential contributing factors is warranted to enhance understanding and management of these conditions.
Overview
CoChat Summary
TL;DR
This systematic review and meta-analysis of 52 studies and 7367 participants found that the pooled prevalence of any pituitary axis dysfunction after traumatic brain injury was 33% (95% CI [28%; 37%]). Prevalence varied by time since injury and by specific pituitary axis, with growth hormone deficiency being the most common.
Key findings
- Pooled prevalence of any pituitary axis dysfunction post-TBI was 33% (95% CI [28%; 37%]); by duration, it was 40% (95% CI [27%; 53%]) at <3 months, 31% (95% CI [15%; 47%]) at 3–6 months, 26% (95% CI [19%; 33%]) at 6–12 months, and 32% (95% CI [26%; 38%]) at >12 months.
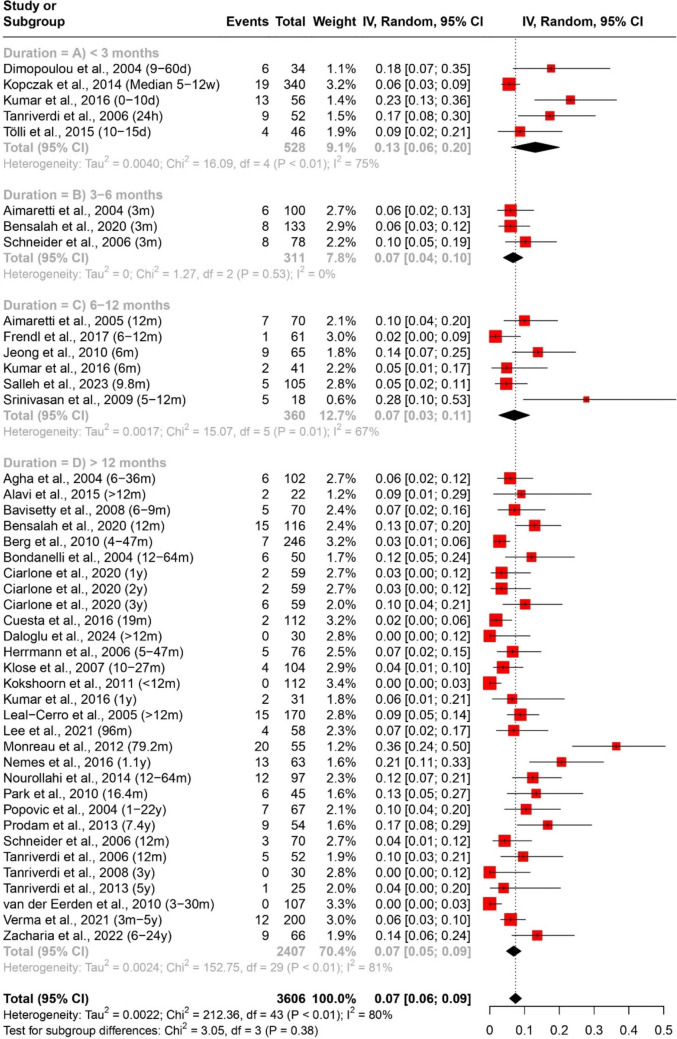
- Multiple axes affection had an overall pooled prevalence of 7% (95% CI [6%; 9%]), with 13% (95% CI [6%; 20%]) at <3 months and 7% at later intervals.
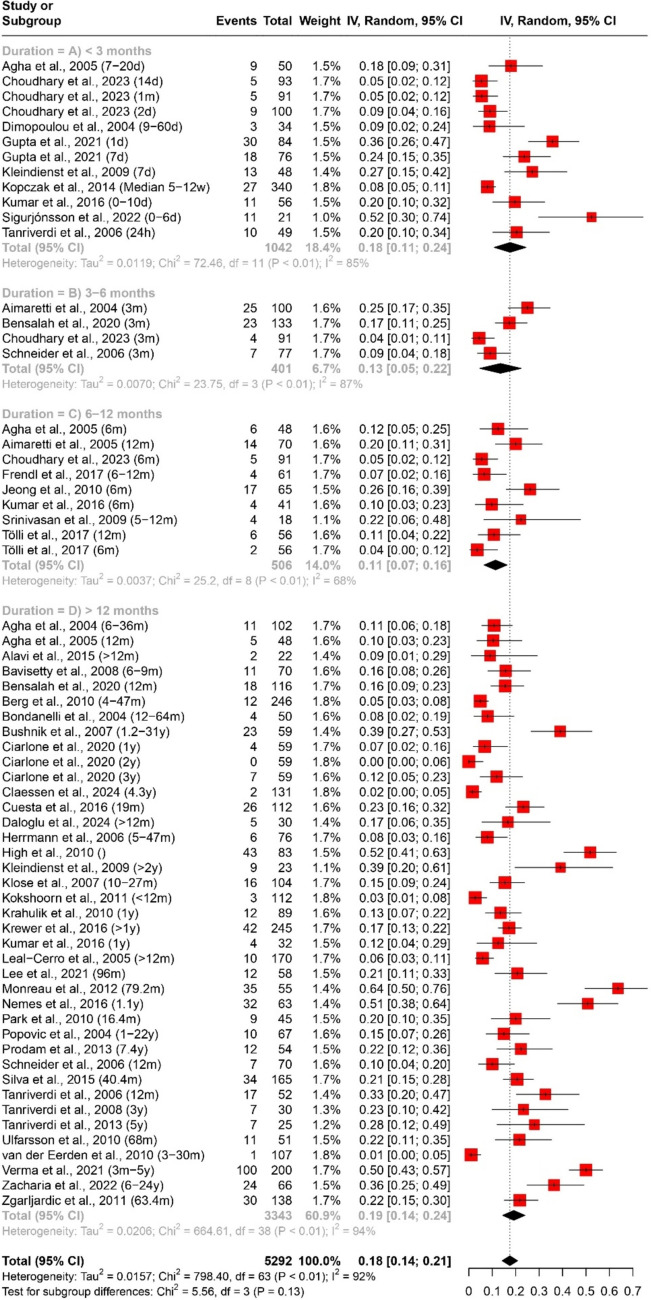
- Specific axis deficiencies: GH deficiency 18% (95% CI [14%; 21%]), pituitary–gonadal axis hormones deficiency 16% (95% CI [12%; 19%]), ACTH deficiency 10% (95% CI [8%; 13%]), and TSH deficiency 6% (95% CI [5%; 7%]).
- Pituitary–gonadal axis deficiency was highest within the first 3 months at 34% (95% CI [21%; 47%]), while GH deficiency was highest beyond 12 months at 19% (95% CI [14%; 24%]).
Methods
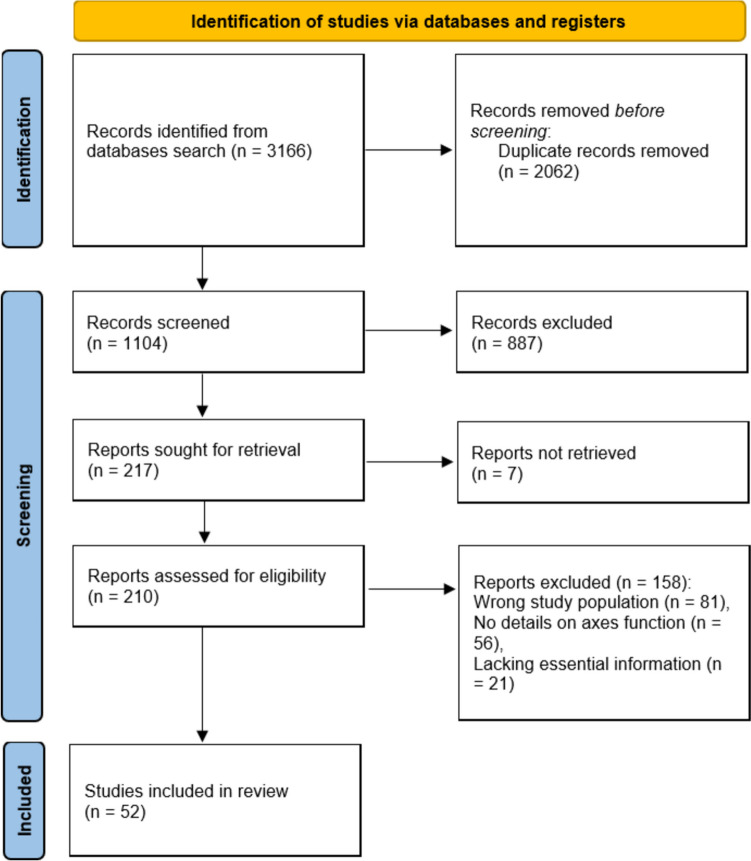
- Systematic review and meta-analysis following PRISMA; searched PubMed, Web of Science, Scopus, Medline, Cochrane Library, and Google Scholar for English-language studies published from 1 January 2000 to 31 March 2024.
- Included observational, cohort, case–control, and cross-sectional studies of adults with TBI, requiring clear diagnostic criteria, prevalence data, sample size ≥10, and Newcastle–Ottawa Scale score ≥7; 52 studies with 7367 participants were included.
- Pooled prevalence estimates used random-effects models in R with the DerSimonian–Laird method; subgroup analyses were by duration post-TBI (<3, 3–6, 6–12, >12 months), with heterogeneity assessed by I² and publication bias by funnel plots.
Limitations
- The paper states that potential risk factors remain unclear, publication bias is possible, English-language restriction may limit generalizability, incomplete reporting challenged data extraction/quality assessment, and some relevant recent studies may have been overlooked.
- The text makes evident substantial heterogeneity: overall I² was 95% for any axis affection, 89–97% across duration subgroups, and up to 96% for specific axes, so pooled estimates should be interpreted cautiously.
- The text also makes evident variability across included study designs (28 prospective, 9 retrospective, 15 cross-sectional) and diagnostic/time definitions, which likely contributes to inconsistent prevalence estimates.
Model-written summary. Check it against the paper before relying on it.
Integrity signals
Registry
Cites
Statistics
Figures
Verification
Claims the paper makes
0 Valid · 0 Not valid · 12 Not checked · 72 Own results and interpretations
A result the paper reports from its own data — it cites no other source for it, so there is none to check. The quote shows it is in the paper.
In the paper
“The overall prevalence was 10% (95% CI [8%; 13%]).”
§ Acute and chronic hypopituitarism following traumatic brain injury: a systematic review and meta-analysis > Characteristics of the included studies > Quantitative data synthesis
plainn = 5,376- Asserted: passes — The authors put it forward as true.
- Checkable: passes — It can be checked against evidence.
- Load-bearing: unclear — It is unclear whether the paper’s conclusions depend on it.
- Based: passes — The paper gives a reason why it holds.
A result the paper reports from its own data — it cites no other source for it, so there is none to check. The quote shows it is in the paper.
In the paper
“our analysis revealed an overall prevalence of 7% (95% CI [6%; 9%])”
§ Acute and chronic hypopituitarism following traumatic brain injury: a systematic review and meta-analysis > Discussion
plain- Asserted: passes — The authors put it forward as true.
- Checkable: passes — It can be checked against evidence.
- Load-bearing: unclear — It is unclear whether the paper’s conclusions depend on it.
- Based: passes — The paper gives a reason why it holds.
A result the paper reports from its own data — it cites no other source for it, so there is none to check. The quote shows it is in the paper.
In the paper
“Notably, heterogeneity levels varied across these subgroups, ranging from 0 to 81%.”
§ Acute and chronic hypopituitarism following traumatic brain injury: a systematic review and meta-analysis > Characteristics of the included studies > Quantitative data synthesis
plain- Asserted: passes — The authors put it forward as true.
- Checkable: passes — It can be checked against evidence.
- Load-bearing: unclear — It is unclear whether the paper’s conclusions depend on it.
- Based: passes — The paper gives a reason why it holds.
- Rests on an assumption not shown here.
A result the paper reports from its own data — it cites no other source for it, so there is none to check. The quote shows it is in the paper.
In the paper
“7% (95% CI [3%; 11%]) for < 3 months”
§ Acute and chronic hypopituitarism following traumatic brain injury: a systematic review and meta-analysis > Characteristics of the included studies > Quantitative data synthesis
plainn = 5,376- Asserted: passes — The authors put it forward as true.
- Checkable: passes — It can be checked against evidence.
- Load-bearing: unclear — It is unclear whether the paper’s conclusions depend on it.
- Based: passes — The paper gives a reason why it holds.
A result the paper reports from its own data — it cites no other source for it, so there is none to check. The quote shows it is in the paper.
In the paper
“Prevalence of multiple axes affection was 7% (95% CI [6%; 9%])”
- Also stated in: § Quantitative data synthesis · plain
“the overall prevalence of multiple axes affection was 7% (95% CI [6%; 9%]), as depicted in Fig. 3.”
§ Acute and chronic hypopituitarism following traumatic brain injury: a systematic review and meta-analysis > Abstract
plainn = 36- Asserted: passes — The authors put it forward as true.
- Checkable: passes — It can be checked against evidence.
- Load-bearing: unclear — It is unclear whether the paper’s conclusions depend on it.
- Based: passes — The paper gives a reason why it holds.
- Rests on 4 assumptions not shown here.
- Also stated in: § Quantitative data synthesis · plain
54 more claims
Create a free account to see all 84 claims and to verify the 21 references still open.
- It may state two separate claims as one. 10
- The quote only partly states this claim. 2
- Probably not a substantial claim. 15
Claims other papers make about this one
Each is checked against this paper’s own text: does it say what the citing paper says it does?
In the citing paper
“A 2024 international meta-analysis, encompassing 72 datasets from 52 studies and 7,367 subjects, reported an overall prevalence of approximately 33% for PTHP involving any hormonal axis [27].”
From Pediatric osmotic demyelination syndrome triggered by post-traumatic pituitary stalk injury: a case report (2026) · cites this paper as [27]
Self-check
Percentages, sums and reported differences re-computed from the paper’s own numbers.
Each contradiction between two passages listed here was confirmed by an independent check.
Rated minor: it would not touch a result — a value no result rests on, a p-value that stays on the same side of the significance level, or a conflict that is clerical, resolved elsewhere in the paper, or outside its own findings.
In the paper
“| van der Eerden et al., 2010 [66] | Netherlands | Cross-sectional | 107 | 65.4% | 45 (22–63) | 3-30 m | NR | 77 | 30 | 30 | 8 |”
§ Acute and chronic hypopituitarism following traumatic brain injury: a systematic review and meta-analysis > Results > Search results
Reported 107 · recomputed 137
Rated minor: it would not touch a result — a value no result rests on, a p-value that stays on the same side of the significance level, or a conflict that is clerical, resolved elsewhere in the paper, or outside its own findings.
In the paper
§ Acute and chronic hypopituitarism following traumatic brain injury: a systematic review and meta-analysis > Characteristics of the included studies > Quality assessment (NOS)
“Studies like Choudhary et al. (2023) and Tanriverdi et al. (2006, 2008) obtained NOS scores of 9”
§ Acute and chronic hypopituitarism following traumatic brain injury: a systematic review and meta-analysis > Results > Search results
“| Tanriverdi et al., 2008 [62] | Turkey | Prospective | 30 | 83.3% | 37.2 ± 2.4 | 3y | NR | 19 | 6 | 5 | 8 |”
Rated minor: it would not touch a result — a value no result rests on, a p-value that stays on the same side of the significance level, or a conflict that is clerical, resolved elsewhere in the paper, or outside its own findings.
In the paper
§ Acute and chronic hypopituitarism following traumatic brain injury: a systematic review and meta-analysis > Characteristics of the included studies > Patient demographics
“The mean age of participants varied from 29.2 years (Leal-Cerro et al., 2005) to 48.3 years (Tölli et al., 2015) [46, 63].”
§ Acute and chronic hypopituitarism following traumatic brain injury: a systematic review and meta-analysis > Results > Search results
“| Kleindienst et al., 2009 [39] | Germany | Prospective | 71 | 80.3% | 53 ± 20 | 7d, 2y | 25.6 ± 3.9 | 24 | 32 | 15 | 7 |”
Rated minor: it would not touch a result — a value no result rests on, a p-value that stays on the same side of the significance level, or a conflict that is clerical, resolved elsewhere in the paper, or outside its own findings.
In the paper
§ Acute and chronic hypopituitarism following traumatic brain injury: a systematic review and meta-analysis > Methodology > Study duration
“No restrictions were placed on the publication year to ensure the inclusion of relevant studies spanning a wide timeframe.”
§ Acute and chronic hypopituitarism following traumatic brain injury: a systematic review and meta-analysis > Methodology > Search strategy
“The search was limited to studies published in English between 1st of January 2000 until the search date of 31st of March 2024.”
Rated minor: it would not touch a result — a value no result rests on, a p-value that stays on the same side of the significance level, or a conflict that is clerical, resolved elsewhere in the paper, or outside its own findings.
In the paper
§ Acute and chronic hypopituitarism following traumatic brain injury: a systematic review and meta-analysis > Results > Search results
“| Ulfarsson et al., 2010 [65] | Sweden | Retrospective | 51 | 74.5% | 37.9 (16–64) | 68 m | 24.0 (18–29) | NR | NR | NR | 8 |”
§ Acute and chronic hypopituitarism following traumatic brain injury: a systematic review and meta-analysis > References
“65. Ulfarsson T, Arnar Gudnason G, Rosén T, Blomstrand C, Stibrant Sunnerhagen K, Lundgren-Nilsson Å, Nilsson M (2013) Pituitary function and functional outcome”
5 more findings
Create a free account to see every finding of this check.
Citations
Cites
Page, M. J., Moher, D., Bossuyt, P. M., Boutron, I., Hoffmann, T. C., Mulrow, C. D., Shamseer, L., Tetzlaff, J. M., Akl, E. A., Brennan, S. E., et al. (2021) · BMJ · doi:10.1136/bmj.n160 · Cited by 13,262 · cited 3×
“This prevalence gradually decreased over time: 31% (95% CI [15%; 47”
BackgroundMethodHow to perform a meta-analysis with R: a practical tutorial
Balduzzi, S., Rücker, G., & Schwarzer, G. (2019) · Evidence Based Mental Health · doi:10.1136/ebmental-2019-300117 · Cited by 5,827
Capizzi, A., Woo, J., & Verduzco-Gutierrez, M. (2020) · Medical Clinics of North America · doi:10.1016/j.mcna.2019.11.001 · Cited by 955
Epidemiology of traumatic brain injury
(2015) · Handbook of Clinical Neurology · doi:10.1016/b978-0-444-52892-6.00001-5 · Cited by 504
McCrea, M. A., Giacino, J. T., Barber, J., Temkin, N. R., Nelson, L. D., Levin, H. S., Dikmen, S., Stein, M., Bodien, Y. G., Boase, K., et al. (2021) · JAMA Neurology · doi:10.1001/jamaneurol.2021.2043 · Cited by 411
Anterior Pituitary Dysfunction in Survivors of Traumatic Brain Injury
Agha, A., Rogers, B., Sherlock, M., O’Kelly, P., Tormey, W., Phillips, J., & Thompson, C. J. (2004) · The Journal of Clinical Endocrinology & Metabolism · doi:10.1210/jc.2004-0511 · Cited by 390
Residual pituitary function after brain injury-induced hypopituitarism: a prospective 12-month study
Aimaretti, G., Ambrosio, M. R., Di Somma, C., Gasperi, M., Cannavò, S., Scaroni, C., Fusco, A., Del Monte, P., De Menis, E., Faustini-Fustini, M., et al. (2005) · The Journal of Clinical Endocrinology & Metabolism · doi:10.1210/jc.2005-0504 · Cited by 370
Traumatic brain injury: neuropathological, neurocognitive and neurobehavioral sequelae
Pavlovic, D., Pekic, S., Stojanovic, M., & Popovic, V. (2019) · Pituitary · doi:10.1007/s11102-019-00957-9 · Cited by 369
Aimaretti, G., Ambrosio, M. R., Di Somma, C., Fusco, A., Cannavò, S., Gasperi, M., Scaroni, C., De Marinis, L., Benvenga, S., Uberti, E. C. D., et al. (2004) · Clinical Endocrinology · doi:10.1111/j.1365-2265.2004.02094.x · Cited by 339 · cited 1×
“Similarly, Aimaretti et al. (2004) [18] and Bondanelli et al. (2004) [26] highlighted the dynamic nature of pituitary dysfunction post-TBI, with prevalence rates mirroring our subgroup analyses based on duration [72, 73].”
Tanriverdi, F., Senyurek, H., Unluhizarci, K., Selcuklu, A., Casanueva, F. F., & Kelestimur, F. (2006) · The Journal of Clinical Endocrinology & Metabolism · doi:10.1210/jc.2005-2476 · Cited by 336
Research works printed but not linked: 2
- Verma PK, Rege SV, Jatav G, Kumar A (2021) Assessment of patterns of pituitary dysfunction after severe traumatic brain injury. Int J Surg 5(4):251–4
- Zacharia SS (2022) Endocrine dysfunction in patients with moderate to severe traumatic brain injury 6 months to 2 years after injury. Doctoral Dissertation, Christian Medical College, Vellore
Cited by
Fluid and electrolyte disorders following traumatic brain injury
Tomkins, M., Green, D., O’Reilly, M., & Sherlock, M. (2025) · Best Practice & Research Clinical Endocrinology & Metabolism · doi:10.1016/j.beem.2025.102014 · Cited by 15
Iglesias, P. (2025) · Endocrine Practice · doi:10.1016/j.eprac.2025.02.004 · Cited by 8
Hasan, S., & Uff, C. E. G. (2025) · Best Practice & Research Clinical Endocrinology & Metabolism · doi:10.1016/j.beem.2025.102006 · Cited by 7
Mavroudis, I. A., Petridis, F., Kazis, D. A., Dăscălescu, G., Ciobica, A. S., Ilea, C. G., Anton, S. C., & Anton, E. (2025) · Life · doi:10.3390/life15111659 · Cited by 7
Epidemiology and risk factors for hypopituitarism due to traumatic brain injury
Ünlühızarcı, K., & Urhan, E. (2025) · Best Practice & Research Clinical Endocrinology & Metabolism · doi:10.1016/j.beem.2025.101997 · Cited by 6
Metadata
- Authors
- Aljboor, G. S., Tulemat, A., Al-Saedi, A. R., Radoi, M. P., Toader, C., & Papacocea, T. M.
- Affiliations
- Carol Davila University of Medicine and Pharmacy (RO)
- Corresponding author
- Aljboor, Ghaith S.
- Venue
- Neurosurgical Review
- Published
- 2024-11-11
- Volume
- 47
- Issue
- 1
- Pages
- 841-841
- ISSN
- 0344-5607 (ISSN-L)
- 1437-2320
- PMC
- PMC11554839
- OpenAlex
- W4404221588
- Cited by
- 30
- References
- 69
- Citations by year
- 2026: 16 · 2025: 14
- FWCI
- 1.40
- Type
- journal article
- Language
- en
- Open access
- hybrid
- doi.org
- Licence
- cc-by
- creativecommons.org/licenses/by/4.0 (tdm)
- creativecommons.org/licenses/by/4.0 (vor)
- Locations
- Neurosurgical Review (publishedVersion, cc-by)
- PubMed Central (publishedVersion, cc-by)
- PubMed (publishedVersion)
- Topics
- Health Sciences › Medicine › Endocrinology, Diabetes and Metabolism › Pituitary Gland Disorders and Treatments
- Health Sciences › Medicine › Clinical Neurology › Traumatic Brain Injury and Neurovascular Disturbances
- Health Sciences › Medicine › Clinical Neurology › Traumatic Brain Injury Research
- Keywords
- traumatic brain injury, hypopituitarism, growth hormone deficiency, ACTH deficiency, gonadotropin deficiency, thyroid-stimulating hormone deficiency, prevalence, temporal patterns, endocrine dysfunction, risk factors, pituitary imaging, pituitary surgery, hormone replacement therapy, quality of life
- MeSH terms
- Brain Injuries, Traumatic, Chronic Disease, Humans, Hypopituitarism, Prevalence
About these checks
Registry, retraction, Cites and statistics results are computed, not judged, with one exception: a printed reference that no index lists is read once by a model before it counts as a citation error. Claims are extracted by a model and kept only when their quote appears verbatim in the text; each cited source is then checked, with a model’s help, for whether it says what the claim relies on. Those verdicts can be wrong — read the claim’s quote and the cited source before relying on one.
A language model drew the claims from the paper on 2026-11-14, under version 3 of the claim definition (model deepseek-v4.1-flash, prompt extract-v3).
A second model labelled each claim on 2026-11-14 (model jev-1.13-20260917, definition revision gold-guideline-v0.2).
Statistics and arithmetic are recomputed, not judged.
Confidence bands are shown only for fields calibrated on our annotated test set. None is calibrated yet, so no band is shown.
What counts as a claim ›How we measure confidence ›How we check this ›
Are you an author, or do you see a problem with this page? Request a review
Data sources
Bibliographic data: Semantic Scholar, OpenAlex, Crossref.
Contains information from the Semantic Scholar Academic Graph Datasets, made available under the ODC Attribution License (ODC-BY 1.0).
Semantic Scholar’s data is described in: Kinney, R., et al. (2023). The Semantic Scholar Open Data Platform. arXiv:2301.10140.
