

The DOI matches its Crossref record; 17 of the 18 references it cites were found in a registry or an index; none of the 10 sources its claims cite is checked for support yet.
Anisotropic path modeling to assess pedestrian-evacuation potential from Cascadia-related tsunamis in the US Pacific Northwest
Open accessAbstract
Recent disasters highlight the threat that tsunamis pose to coastal communities. When developing tsunami-education efforts and vertical-evacuation strategies, emergency managers need to understand how much time it could take for a coastal population to reach higher ground before tsunami waves arrive. To improve efforts to model pedestrian evacuations from tsunamis, we examine the sensitivity of least-cost-distance models to variations in modeling approaches, data resolutions, and travel-rate assumptions. We base our observations on the assumption that an anisotropic approach that uses path-distance algorithms and accounts for variations in land cover and directionality in slope is the most realistic of an actual evacuation landscape. We focus our efforts on the Long Beach Peninsula in Washington (USA), where a substantial residential and tourist population is threatened by near-field tsunamis related to a potential Cascadia subduction zone earthquake. Results indicate thousands of people are located in areas where evacuations to higher ground will be difficult before arrival of the first tsunami wave. Deviations from anisotropic modeling assumptions substantially influence the amount of time likely needed to reach higher ground. Across the entire study, changes in resolution of elevation data has a greater impact on calculated travel times than changes in land-cover resolution. In particular areas, land-cover resolution had a substantial impact when travel-inhibiting waterways were not reflected in small-scale data. Changes in travel-speed parameters had a substantial impact also, suggesting the importance of public-health campaigns as a tsunami risk-reduction strategy.
Overview
AI snapshot
Written from the paper’s full text.
TL;DR
This study models pedestrian tsunami-evacuation times on Washington’s Long Beach Peninsula using least-cost-distance approaches and finds that an anisotropic path-distance model with high-resolution elevation and land-cover data best reflects evacuation conditions. It reports that thousands of residents, employees, and facilities would need ≥25 min to reach safety, and that modeling assumptions, elevation resolution, and travel speed strongly affect estimated exposure.
Key findings
- Under the anisotropic model with 1-m elevation/land-cover data and a 1.1 m/s base speed, mean and maximum travel times to safety were 46 and 133 min; approximately 4,244 residents, 477 employees, 40 public venues, and 7 dependent-population facilities were at locations requiring ≥25 min to evacuate. Of the 4,244 residents, 1,204 were over 65 and 171 were under 5.
- The distance-only model consistently underestimated travel times: average and maximum times were 30% and 24% lower than anisotropic results, and at the 25-min threshold it classified 13% fewer residents and 4% fewer employees as at risk. Differences reached up to 50 min, with the most frequent difference (32% of area) being 1–10 min. The roads model both underestimated and overestimated travel times by up to 40 min, while the isotropic model slightly underestimated them (4% lower average, 7% lower maximum).
- Elevation resolution mattered more than land-cover resolution across the study area: using 10-m instead of 1-m elevation data lowered average and maximum evacuation times by about 60–63% and undercounted at-risk residents (66–68% of the 1-m estimate), employees (84–86%), public venues (80%), and dependent-population facilities (71%). Using 30-m NLCD land cover instead of 1-m land cover had minimal overall population-exposure impact (0–5% differences), though local water-body omissions caused underestimates.
- Travel speed strongly affected exposure: at the 25-min threshold, the share of residents at risk ranged from 7% under a fast-run assumption (3.83 m/s) to 49% under a slow-walk assumption (0.91 m/s); employees ranged from 6% to 62%. Walking quickly (1.52 m/s) instead of slowly (0.91 m/s) could allow about 900 more residents (10% of the study area) to evacuate.
Methods
- The study area was the Long Beach Peninsula, Washington, using a tsunami-hazard zone based on a Cascadia subduction zone Mw 9.1 scenario; the first tsunami wave was assumed to arrive about 25 min after the earthquake, and the safe zone was land outside the inundation zone.
- Four least-cost-distance approaches were compared: distance-only, road-constrained, isotropic slope/land-cover, and anisotropic path-distance with slope directionality. Land-cover speed-conservation values were derived from Soule and Goldman energy-cost coefficients, and slope speed was based on Tobler’s hiking function; the base travel speed was 1.1 m/s.
- Sensitivity tests varied elevation data (1-m LiDAR DEM vs 10-m NED proxy), land-cover data (1-m manual interpretation vs 30-m NLCD), and travel speeds (walking and running rates). Resident, employee, public-venue, and dependent-population datasets were overlaid on travel-time surfaces to estimate exposure at the 25-min threshold.
Limitations
- Stated by the paper: the models simplify reality and cannot fully capture individual behavior and mobility, dynamic landscape conditions, or person–environment interactions; they assume immediate self-evacuation, constant travel speeds without fatigue, independent land-cover and slope effects, and no route capacity or congestion. The analysis also assumes uniform 25-min inundation across the study area, omitting inland wave-propagation delay.
- Stated by the paper: land-cover speed values were based on energy-cost coefficients rather than empirical walking-speed data; 30-m NLCD data were disaggregated to 10-m cells; buildings and water were treated as impassable; and population layers were static point or facility representations.
- Evident from the text: the road-constrained model can force unrealistic routes and may not represent actual pedestrian behavior, and the study does not validate modeled travel times against observed evacuations or field-measured walking speeds.
Model-written summary. Check it against the paper before relying on it.
Integrity signals
Registry
Cites
Statistics
Figures
Verification
Claims the paper makes
79 Own result · 35 Own interpretation · 21 No basis given · 9 Sources not found · 2 Own method · 1 No full text of the sources
A result the paper reports from its own data — it cites no other source for it, so there is none to check. The quote shows it is in the paper.
In the paper
“Deviations from anisotropic modeling assumptions substantially influence the amount of time likely needed to reach higher ground.”
§ Anisotropic path modeling to assess pedestrianevacuation potential from Cascadia-related tsunamis in the US Pacific Northwest > Abstract
plaindirect- Asserted: passes — The authors put it forward as true.
- Checkable: passes — It can be checked against evidence.
- Load-bearing: passes — The paper’s conclusions depend on it.
- Based: passes — The paper gives a reason why it holds.
- The authors state this as an assumption: Pedestrian fatigue is minimal and travel speeds remain constant during evacuation.
- The authors state this as an assumption: Many evacuees will be incapable of running because of age, health, or other mobility issues.
- The authors state this as an assumption: Walking speeds will decrease in proportion to the changes in energy required to move across different land-cover types.
A result the paper reports from its own data — it cites no other source for it, so there is none to check. The quote shows it is in the paper.
In the paper
“Results indicate thousands of people are located in areas where evacuations to higher ground will be difficult before arrival of the first tsunami wave.”
§ Anisotropic path modeling to assess pedestrianevacuation potential from Cascadia-related tsunamis in the US Pacific Northwest > Abstract
hedged- Asserted: passes — The authors put it forward as true.
- Checkable: passes — It can be checked against evidence.
- Load-bearing: passes — The paper’s conclusions depend on it.
- Based: passes — The paper gives a reason why it holds.
- The authors state this as an assumption: Pedestrian fatigue is minimal and travel speeds remain constant during evacuation.
- The authors state this as an assumption: Many evacuees will be incapable of running because of age, health, or other mobility issues.
- The authors state this as an assumption: Walking speeds will decrease in proportion to the changes in energy required to move across different land-cover types.
A result the paper reports from its own data — it cites no other source for it, so there is none to check. The quote shows it is in the paper.
In the paper
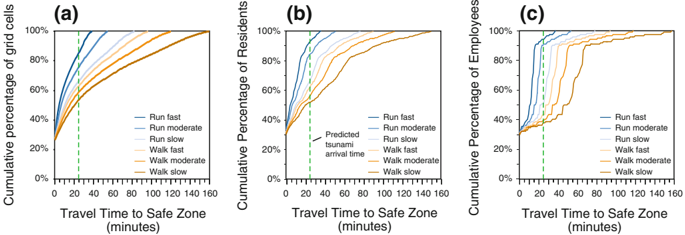
“The calculated amount of time required for all residents to evacuate tsunami-prone areas ranges from 39 min (assuming a ''run fast'' rate of 3.83 m/s) up to 162 min (assuming a ''walk slow'' rate of 0.91 m/s).”
§ Anisotropic path modeling to assess pedestrianevacuation potential from Cascadia-related tsunamis in the US Pacific Northwest > 4.4 Travel time
plaindirectn = 9,110- Asserted: passes — The authors put it forward as true.
- Checkable: passes — It can be checked against evidence.
- Load-bearing: passes — The paper’s conclusions depend on it.
- Based: passes — The paper gives a reason why it holds.
The paper states this without a source or data behind it here, so there is nothing to check it against. The quote shows it is in the paper.
In the paper
“In particular areas, land-cover resolution had a substantial impact when travel-inhibiting waterways were not reflected in small-scale data.”
§ Anisotropic path modeling to assess pedestrianevacuation potential from Cascadia-related tsunamis in the US Pacific Northwest > Abstract
plaindirect- Asserted: passes — The authors put it forward as true.
- Checkable: passes — It can be checked against evidence.
- Load-bearing: passes — The paper’s conclusions depend on it.
- Based: passes — The paper gives a reason why it holds.
- The authors state this as an assumption: Pedestrian fatigue is minimal and travel speeds remain constant during evacuation.
- The authors state this as an assumption: Many evacuees will be incapable of running because of age, health, or other mobility issues.
- The authors state this as an assumption: Walking speeds will decrease in proportion to the changes in energy required to move across different land-cover types.
A result the paper reports from its own data — it cites no other source for it, so there is none to check. The quote shows it is in the paper.
In the paper
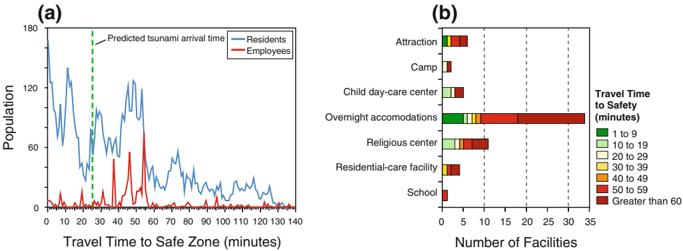
“There are approximately 4,244 residents, 477 employees, 40 public venues, and 7 dependent-population facilities at locations that may require 25 min or more of travel time to reach areas outside of the tsunami-inundation zone (Table 2).”
§ Anisotropic path modeling to assess pedestrianevacuation potential from Cascadia-related tsunamis in the US Pacific Northwest > 4.1 Population exposure to tsunamis based on distance to safety
hedged- Asserted: passes — The authors put it forward as true.
- Checkable: passes — It can be checked against evidence.
- Load-bearing: passes — The paper’s conclusions depend on it.
- Based: passes — The paper gives a reason why it holds.
- The authors state this as an assumption: Tsunami arrival is 25 min after the initial earthquake.
The paper states this without a source or data behind it here, so there is nothing to check it against. The quote shows it is in the paper.
In the paper
“Evacuation times generated by isotropic and anisotropic modeling approaches are fairly consistent (Fig. 4a, b), likely a result of the fairly low relief of our study area.”
§ Anisotropic path modeling to assess pedestrianevacuation potential from Cascadia-related tsunamis in the US Pacific Northwest > 4.2 Model comparison
plain- Asserted: passes — The authors put it forward as true.
- Checkable: passes — It can be checked against evidence.
- Load-bearing: unclear — It is unclear whether the paper’s conclusions depend on it.
- Based: passes — The paper gives a reason why it holds.
A result the paper reports from its own data — it cites no other source for it, so there is none to check. The quote shows it is in the paper.
In the paper
“The impact of travel speeds on evacuation times for populations at public venues and dependent-care facilities is also dramatic (Table 3).”
§ Anisotropic path modeling to assess pedestrianevacuation potential from Cascadia-related tsunamis in the US Pacific Northwest > 4.4 Travel time
plaindirect- Asserted: passes — The authors put it forward as true.
- Checkable: passes — It can be checked against evidence.
- Load-bearing: passes — The paper’s conclusions depend on it.
- Based: passes — The paper gives a reason why it holds.
A result the paper reports from its own data — it cites no other source for it, so there is none to check. The quote shows it is in the paper.
In the paper
“Of the 4,244 residents that may require 25 min or more to reach high ground, approximately 1,204 residents are over 65 years in age (28% of high-risk population) and 171 residents are under 5 years in age (4% of high-risk population).”
§ Anisotropic path modeling to assess pedestrianevacuation potential from Cascadia-related tsunamis in the US Pacific Northwest > 4.1 Population exposure to tsunamis based on distance to safety
hedged- Asserted: passes — The authors put it forward as true.
- Checkable: passes — It can be checked against evidence.
- Load-bearing: unclear — It is unclear whether the paper’s conclusions depend on it.
- Based: passes — The paper gives a reason why it holds.
- The authors state this as an assumption: Tsunami arrival is 25 min after the initial earthquake.
A result the paper reports from its own data — it cites no other source for it, so there is none to check. The quote shows it is in the paper.
In the paper
“The impact of travel speeds on pedestrian-evacuation modeling is also apparent with employee distributions.”
§ Anisotropic path modeling to assess pedestrianevacuation potential from Cascadia-related tsunamis in the US Pacific Northwest > 4.4 Travel time
plaincorrelationaln = 779- Asserted: passes — The authors put it forward as true.
- Checkable: passes — It can be checked against evidence.
- Load-bearing: unclear — It is unclear whether the paper’s conclusions depend on it.
- Based: passes — The paper gives a reason why it holds.
A result the paper reports from its own data — it cites no other source for it, so there is none to check. The quote shows it is in the paper.
In the paper
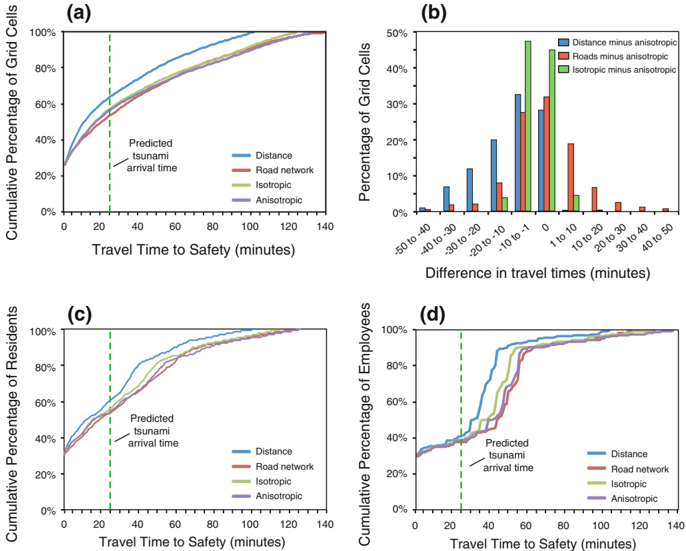
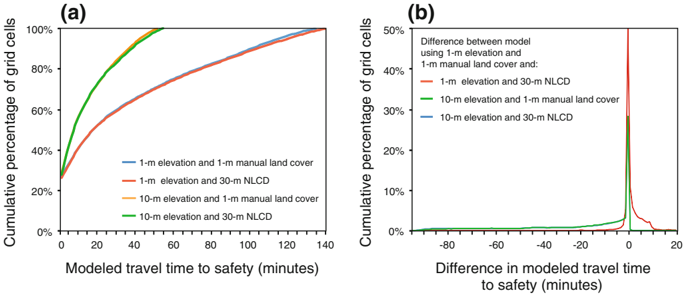
“However, when the elevation-data input is changed to the 10-m NED proxy, the profiles of the cumulative percentage of grid cells for both the 1-m manual interpretation of land cover and 10-m disaggregation of NLCD data are drastically different than the original 1-m elevation, 1-m land-cover model results.”
§ Anisotropic path modeling to assess pedestrianevacuation potential from Cascadia-related tsunamis in the US Pacific Northwest > 4.3 Data sensitivity
plaindirect- Asserted: passes — The authors put it forward as true.
- Checkable: passes — It can be checked against evidence.
- Load-bearing: passes — The paper’s conclusions depend on it.
- Based: passes — The paper gives a reason why it holds.
- It may state two separate claims as one. 38
- Probably not a substantial claim. 24
A result the paper reports from its own data — it cites no other source for it, so there is none to check. The quote shows it is in the paper.
In the paper
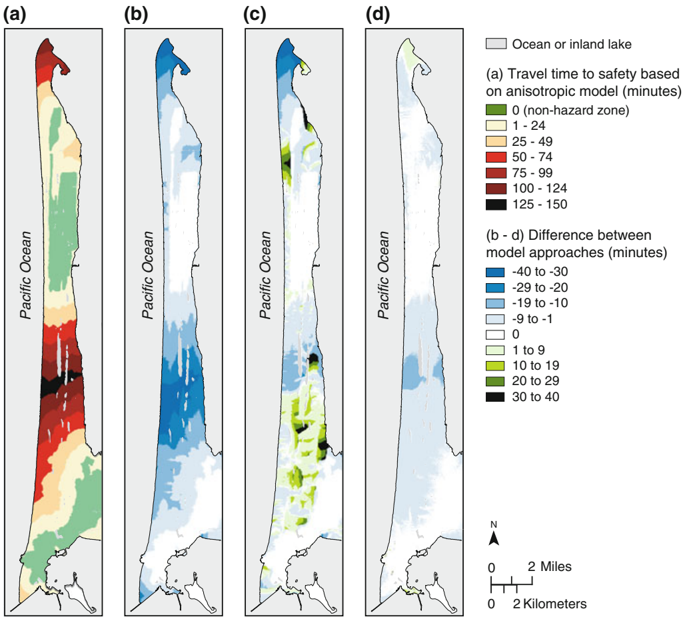
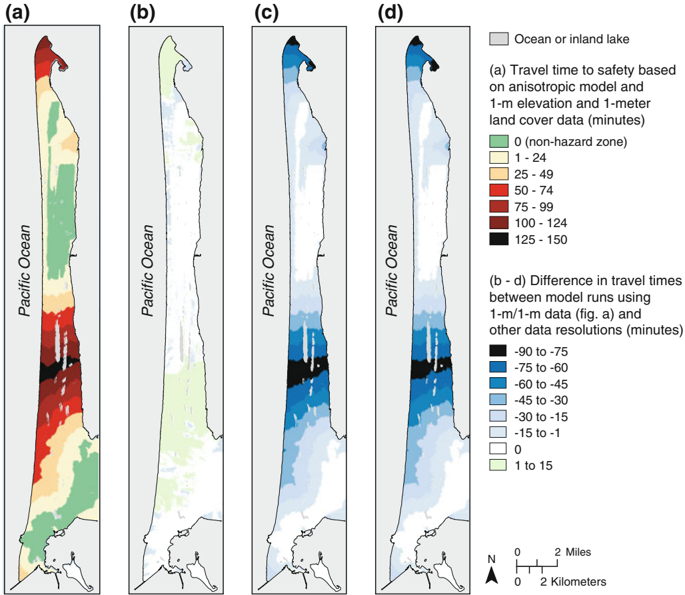
“The Road model underestimates the likely time needed to evacuate in some areas (e.g., northern tip and middle of the peninsula) and overestimates travel times in other areas (e.g., near the communities of Oceanside, Long Beach, and west of Oysterville) (Fig. 2c).”
§ Anisotropic path modeling to assess pedestrianevacuation potential from Cascadia-related tsunamis in the US Pacific Northwest > 4.2 Model comparison
plaindirect- Asserted: passes — The authors put it forward as true.
- Checkable: passes — It can be checked against evidence.
- Load-bearing: passes — The paper’s conclusions depend on it.
- Based: passes — The paper gives a reason why it holds.
It may state two separate claims as one.
A result the paper reports from its own data — it cites no other source for it, so there is none to check. The quote shows it is in the paper.
In the paper
“Retaining the 1-m elevation data but using the 30-m land cover does create differences in the time required to evacuate but these differences are not widespread or large (Fig. 5b).”
§ Anisotropic path modeling to assess pedestrianevacuation potential from Cascadia-related tsunamis in the US Pacific Northwest > 4.3 Data sensitivity
plaindirect- Asserted: passes — The authors put it forward as true.
- Checkable: passes — It can be checked against evidence.
- Load-bearing: unclear — It is unclear whether the paper’s conclusions depend on it.
- Based: passes — The paper gives a reason why it holds.
It may state two separate claims as one.
A result the paper reports from its own data — it cites no other source for it, so there is none to check. The quote shows it is in the paper.
In the paper
“Mapped results of the differences between the anisotropic and isotropic indicate a general trend of underestimation by the isotropic approach (e.g., 4 and 7% lower average and maximum evacuation travel times; Table 2) but these differences do not dramatically impact population exposure estimates (e.g., less than 3% difference in exposure estimates of residents, employees, public venues, and”
§ Anisotropic path modeling to assess pedestrianevacuation potential from Cascadia-related tsunamis in the US Pacific Northwest > 4.2 Model comparison
hedgeddirect- Asserted: passes — The authors put it forward as true.
- Checkable: passes — It can be checked against evidence.
- Load-bearing: passes — The paper’s conclusions depend on it.
- Based: passes — The paper gives a reason why it holds.
It may state two separate claims as one.
A result the paper reports from its own data — it cites no other source for it, so there is none to check. The quote shows it is in the paper.
In the paper
“Mean and maximum travel times to safety across the peninsula are 46 and 133 min, respectively (Table 2).”
§ Anisotropic path modeling to assess pedestrianevacuation potential from Cascadia-related tsunamis in the US Pacific Northwest > 4.1 Population exposure to tsunamis based on distance to safety
plain- Asserted: passes — The authors put it forward as true.
- Checkable: passes — It can be checked against evidence.
- Load-bearing: passes — The paper’s conclusions depend on it.
- Based: passes — The paper gives a reason why it holds.
It may state two separate claims as one.
A result the paper reports from its own data — it cites no other source for it, so there is none to check. The quote shows it is in the paper.
In the paper
“with approximately 30% of the study area reporting underestimates of 1-10 min and 20% of the study area reporting overestimates of 1-10 min (Fig. 4b).”
§ Anisotropic path modeling to assess pedestrianevacuation potential from Cascadia-related tsunamis in the US Pacific Northwest > 4.2 Model comparison
plain- Asserted: passes — The authors put it forward as true.
- Checkable: passes — It can be checked against evidence.
- Load-bearing: unclear — It is unclear whether the paper’s conclusions depend on it.
- Based: passes — The paper gives a reason why it holds.
It may state two separate claims as one.
A result the paper reports from its own data — it cites no other source for it, so there is none to check. The quote shows it is in the paper.
In the paper
“Differences in calculated average and maximum evacuation are less than 1 and 5%, respectively (Table 2).”
§ Anisotropic path modeling to assess pedestrianevacuation potential from Cascadia-related tsunamis in the US Pacific Northwest > 4.2 Model comparison
plain- Asserted: passes — The authors put it forward as true.
- Checkable: passes — It can be checked against evidence.
- Load-bearing: unclear — It is unclear whether the paper’s conclusions depend on it.
- Based: passes — The paper gives a reason why it holds.
It may state two separate claims as one.
A result the paper reports from its own data — it cites no other source for it, so there is none to check. The quote shows it is in the paper.
In the paper
“Forty percent of grid cells showed overestimates of up to 15 min (Fig. 6b) and these grid cells were primarily at the northern tip of the peninsula or in the lower area near the community of Long Beach (Fig. 5b).”
§ Anisotropic path modeling to assess pedestrianevacuation potential from Cascadia-related tsunamis in the US Pacific Northwest > 4.3 Data sensitivity
plaincorrelational- Asserted: passes — The authors put it forward as true.
- Checkable: passes — It can be checked against evidence.
- Load-bearing: unclear — It is unclear whether the paper’s conclusions depend on it.
- Based: passes — The paper gives a reason why it holds.
It may state two separate claims as one.
A result the paper reports from its own data — it cites no other source for it, so there is none to check. The quote shows it is in the paper.
In the paper
“The Distance model consistently underestimates the time needed to evacuate; for example, maximum and average travel times are 24 and 30% lower, respectively, than the time predicted using the anisotropic approach.”
§ Anisotropic path modeling to assess pedestrianevacuation potential from Cascadia-related tsunamis in the US Pacific Northwest > 4.2 Model comparison
plaindirect- Asserted: passes — The authors put it forward as true.
- Checkable: passes — It can be checked against evidence.
- Load-bearing: passes — The paper’s conclusions depend on it.
- Based: passes — The paper gives a reason why it holds.
It may state two separate claims as one.
A result the paper reports from its own data — it cites no other source for it, so there is none to check. The quote shows it is in the paper.
In the paper
“The roads approach also varied greatly from the anisotropic approach but differences were not consistent-travel times were underestimated by 40 min in some areas and overestimated by the same amount in other areas (Fig. 2c).”
§ Anisotropic path modeling to assess pedestrianevacuation potential from Cascadia-related tsunamis in the US Pacific Northwest > 5.1 Influence of modeling assumptions
plaincorrelational- Asserted: passes — The authors put it forward as true.
- Checkable: passes — It can be checked against evidence.
- Load-bearing: unclear — It is unclear whether the paper’s conclusions depend on it.
- Based: passes — The paper gives a reason why it holds.
It may state two separate claims as one.
A result the paper reports from its own data — it cites no other source for it, so there is none to check. The quote shows it is in the paper.
In the paper
“Results of the Road modeling approaches also vary substantially from the anisotropic approach (Fig. 2c) but the differences are not as great (Fig. 4a) or consistent (Fig. 4b).”
§ Anisotropic path modeling to assess pedestrianevacuation potential from Cascadia-related tsunamis in the US Pacific Northwest > 4.2 Model comparison
plain- Asserted: passes — The authors put it forward as true.
- Checkable: passes — It can be checked against evidence.
- Load-bearing: unclear — It is unclear whether the paper’s conclusions depend on it.
- Based: passes — The paper gives a reason why it holds.
It may state two separate claims as one.
The paper states this without a source or data behind it here, so there is nothing to check it against. The quote shows it is in the paper.
In the paper
“A road-constrained approach underestimates travel times in some areas but overestimates times in other areas, thereby creating an uncertain result for emergency managers.”
§ Anisotropic path modeling to assess pedestrianevacuation potential from Cascadia-related tsunamis in the US Pacific Northwest > 6 Conclusions
plaindirect- Asserted: passes — The authors put it forward as true.
- Checkable: passes — It can be checked against evidence.
- Load-bearing: passes — The paper’s conclusions depend on it.
- Based: passes — The paper gives a reason why it holds.
It may state two separate claims as one.
- The authors state this as an assumption: The speed conservation values for slope and land cover are independent of one another.
- The authors state this as an assumption: Evacuation speeds remain constant over long distances, ignoring the influence of fatigue.
- The authors state this as an assumption: Travel speeds over various land-cover types can be estimated based on Soule and Goldman's (1972) terrain energy coefficients.
A result the paper reports from its own data — it cites no other source for it, so there is none to check. The quote shows it is in the paper.
In the paper
“Changes in land-cover data resolution and type did create differences in evacuation times; however, most differences were not large-typically overestimates of 1-15 min across the study area with pockets of underestimated travel times on the order of one to 30 min (Fig. 5b).”
§ Anisotropic path modeling to assess pedestrianevacuation potential from Cascadia-related tsunamis in the US Pacific Northwest > 5.1 Influence of modeling assumptions
plaindirect- Asserted: passes — The authors put it forward as true.
- Checkable: passes — It can be checked against evidence.
- Load-bearing: passes — The paper’s conclusions depend on it.
- Based: passes — The paper gives a reason why it holds.
It may state two separate claims as one.
A result the paper reports from its own data — it cites no other source for it, so there is none to check. The quote shows it is in the paper.
In the paper
“Although most differences between the two models were confined to only a few minutes, there is an area in the middle of the peninsula where the isotropic model underestimates likely travel times by up to 20 min.”
§ Anisotropic path modeling to assess pedestrianevacuation potential from Cascadia-related tsunamis in the US Pacific Northwest > 4.2 Model comparison
plaindirect- Asserted: passes — The authors put it forward as true.
- Checkable: passes — It can be checked against evidence.
- Load-bearing: unclear — It is unclear whether the paper’s conclusions depend on it.
- Based: passes — The paper gives a reason why it holds.
It may state two separate claims as one.
A result the paper reports from its own data — it cites no other source for it, so there is none to check. The quote shows it is in the paper.
In the paper
“The distribution of at-risk populations across the peninsula relative to travel times to safety varies depending on population type; for example, there are residential peaks at 10, 30, and 50 min and employee peaks at 38, 45, and 55 min to reach safety (Fig. 3a).”
§ Anisotropic path modeling to assess pedestrianevacuation potential from Cascadia-related tsunamis in the US Pacific Northwest > 4.1 Population exposure to tsunamis based on distance to safety
plaincorrelational- Asserted: passes — The authors put it forward as true.
- Checkable: passes — It can be checked against evidence.
- Load-bearing: unclear — It is unclear whether the paper’s conclusions depend on it.
- Based: passes — The paper gives a reason why it holds.
It may state two separate claims as one.
A result the paper reports from its own data — it cites no other source for it, so there is none to check. The quote shows it is in the paper.
In the paper
“Differences between the two approaches range from none (28% of study area) up to 50 min (1% of study area), with the most frequent difference (32%) being 1-10 min (Fig. 4b).”
§ Anisotropic path modeling to assess pedestrianevacuation potential from Cascadia-related tsunamis in the US Pacific Northwest > 4.2 Model comparison
plain- Asserted: passes — The authors put it forward as true.
- Checkable: passes — It can be checked against evidence.
- Load-bearing: passes — The paper’s conclusions depend on it.
- Based: passes — The paper gives a reason why it holds.
It may state two separate claims as one.
The paper states this without a source or data behind it here, so there is nothing to check it against. The quote shows it is in the paper.
In the paper
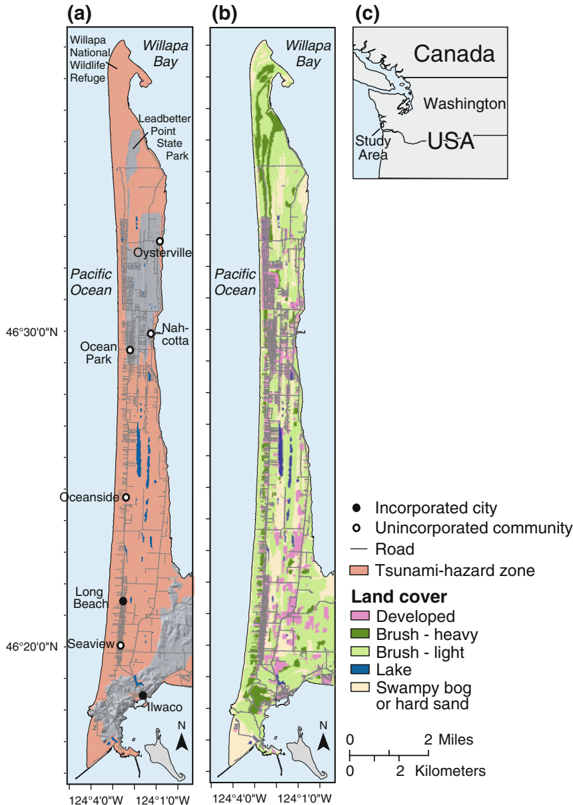
“For this initial study on pedestrian-evacuation modeling for Cascadia tsunamis, we felt this complicating factor could be omitted because the majority of the population on the Long Beach Peninsula is located near the western shoreline and not further inland.”
§ Anisotropic path modeling to assess pedestrianevacuation potential from Cascadia-related tsunamis in the US Pacific Northwest > 5.3 Areas for future research
plain- Asserted: passes — The authors put it forward as true.
- Checkable: passes — It can be checked against evidence.
- Load-bearing: passes — The paper’s conclusions depend on it.
- Based: fails — The paper may give no reason why it holds.
Probably not a substantial claim. The paper may give no reason why it holds.
A result the paper reports from its own data — it cites no other source for it, so there is none to check. The quote shows it is in the paper.
In the paper
“Overestimation of travel times was common using the Roads approach to model pedestrian evacuations in our study area (Fig. 2c), suggesting that the decision to model pedestrian travel along a road network versus allowing movement across the broader landscape as a whole is not trivial.”
§ Anisotropic path modeling to assess pedestrianevacuation potential from Cascadia-related tsunamis in the US Pacific Northwest > 5.1 Influence of modeling assumptions
hedgeddirect- Asserted: passes — The authors put it forward as true.
- Checkable: passes — It can be checked against evidence.
- Load-bearing: passes — The paper’s conclusions depend on it.
- Based: passes — The paper gives a reason why it holds.
It may state two separate claims as one.
A result the paper reports from its own data — it cites no other source for it, so there is none to check. The quote shows it is in the paper.
In the paper
“Across the entire study area, the effect on population exposure estimates from using the NLCD data is minimal-average and maximum evacuation times increase only by 2 and 4% and the number of residents, employees, public venues, and dependent-population facilities at 25 min or more of travel time show differences that range only from 0 to 5% (Table 2).”
§ Anisotropic path modeling to assess pedestrianevacuation potential from Cascadia-related tsunamis in the US Pacific Northwest > 4.3 Data sensitivity
plaindirect- Asserted: passes — The authors put it forward as true.
- Checkable: passes — It can be checked against evidence.
- Load-bearing: passes — The paper’s conclusions depend on it.
- Based: passes — The paper gives a reason why it holds.
It may state two separate claims as one.
- The authors state this as an assumption: Tsunami arrival is 25 min after the initial earthquake.
A result the paper reports from its own data — it cites no other source for it, so there is none to check. The quote shows it is in the paper.
In the paper
“Although differences were observed over much of the study area (Fig. 2d), the majority of the differences were on the order of 1-9 min (47% of the study area) with the isotropic approach underestimating travel times (Fig. 4b).”
§ Anisotropic path modeling to assess pedestrianevacuation potential from Cascadia-related tsunamis in the US Pacific Northwest > 4.2 Model comparison
plaindirect- Asserted: passes — The authors put it forward as true.
- Checkable: passes — It can be checked against evidence.
- Load-bearing: passes — The paper’s conclusions depend on it.
- Based: passes — The paper gives a reason why it holds.
It may state two separate claims as one.
A result the paper reports from its own data — it cites no other source for it, so there is none to check. The quote shows it is in the paper.
In the paper
“Although there are identifiable spatial variations in the differences between the anisotropic and Roads modeling approaches (Fig. 2c), the impacts to population exposure estimates are not substantial (Table 2; Fig. 4c, d).”
§ Anisotropic path modeling to assess pedestrianevacuation potential from Cascadia-related tsunamis in the US Pacific Northwest > 4.2 Model comparison
plain- Asserted: passes — The authors put it forward as true.
- Checkable: passes — It can be checked against evidence.
- Load-bearing: passes — The paper’s conclusions depend on it.
- Based: passes — The paper gives a reason why it holds.
It may state two separate claims as one.
A result the paper reports from its own data — it cites no other source for it, so there is none to check. The quote shows it is in the paper.
In the paper
“Relative to the anisotropic approach, the distance and isotropic approaches consistently underestimated travel times (Fig. 2), with differences on the order of 10 min or less for most of the study area (isotropic) and up to 40 min (distance).”
§ Anisotropic path modeling to assess pedestrianevacuation potential from Cascadia-related tsunamis in the US Pacific Northwest > 5.1 Influence of modeling assumptions
plaindirect- Asserted: passes — The authors put it forward as true.
- Checkable: passes — It can be checked against evidence.
- Load-bearing: passes — The paper’s conclusions depend on it.
- Based: passes — The paper gives a reason why it holds.
It may state two separate claims as one.
A result the paper reports from its own data — it cites no other source for it, so there is none to check. The quote shows it is in the paper.
In the paper
“Approximately 10% of the grid cells showed underestimates of pedestrian travel times in the range of 1-15 min (Fig. 6b) and these underestimates occur in small pockets of land across the study area (Fig. 5b).”
§ Anisotropic path modeling to assess pedestrianevacuation potential from Cascadia-related tsunamis in the US Pacific Northwest > 4.3 Data sensitivity
plain- Asserted: passes — The authors put it forward as true.
- Checkable: passes — It can be checked against evidence.
- Load-bearing: unclear — It is unclear whether the paper’s conclusions depend on it.
- Based: passes — The paper gives a reason why it holds.
It may state two separate claims as one.
A result the paper reports from its own data — it cites no other source for it, so there is none to check. The quote shows it is in the paper.
In the paper
“This sensitivity is highest in areas where evacuation times are greatest (Fig. 5), indicating the differences are cumulative across the landscape.”
§ Anisotropic path modeling to assess pedestrianevacuation potential from Cascadia-related tsunamis in the US Pacific Northwest > 5.1 Influence of modeling assumptions
hedgedcorrelational- Asserted: passes — The authors put it forward as true.
- Checkable: passes — It can be checked against evidence.
- Load-bearing: unclear — It is unclear whether the paper’s conclusions depend on it.
- Based: passes — The paper gives a reason why it holds.
It may state two separate claims as one.
A conclusion the paper draws from its own results — it cites no other source for it, so there is none to check. The quote shows it is in the paper.
In the paper
“In the end, precise, visually compelling maps can be made using coarse data, but their accuracy would be highly questionable.”
§ Anisotropic path modeling to assess pedestrianevacuation potential from Cascadia-related tsunamis in the US Pacific Northwest > 5.1 Influence of modeling assumptions
hedgeddirect- Asserted: passes — The authors put it forward as true.
- Checkable: unclear — It is unclear whether it could be checked against evidence.
- Load-bearing: passes — The paper’s conclusions depend on it.
- Based: passes — The paper gives a reason why it holds.
It may state two separate claims as one.
A conclusion the paper draws from its own results — it cites no other source for it, so there is none to check. The quote shows it is in the paper.
In the paper
“However, this is unrealistic, given the nature of the at-risk individuals.”
§ Anisotropic path modeling to assess pedestrianevacuation potential from Cascadia-related tsunamis in the US Pacific Northwest > 4.4 Travel time
plain- Asserted: passes — The authors put it forward as true.
- Checkable: fails — It may be too vague to check against evidence.
- Load-bearing: passes — The paper’s conclusions depend on it.
- Based: passes — The paper gives a reason why it holds.
Probably not a substantial claim. It may be too vague to check against evidence.
A conclusion the paper draws from its own results — it cites no other source for it, so there is none to check. The quote shows it is in the paper.
In the paper
“Therefore, while the mapped results demonstrate pockets of substantial differences in calculated pedestrian travel times, these areas do not contain substantial populations.”
§ Anisotropic path modeling to assess pedestrianevacuation potential from Cascadia-related tsunamis in the US Pacific Northwest > 4.2 Model comparison
plain- Asserted: passes — The authors put it forward as true.
- Checkable: passes — It can be checked against evidence.
- Load-bearing: passes — The paper’s conclusions depend on it.
- Based: passes — The paper gives a reason why it holds.
It may state two separate claims as one.
A conclusion the paper draws from its own results — it cites no other source for it, so there is none to check. The quote shows it is in the paper.
In the paper
“This issue of travel constraints due to high building densities and fences highlights the importance of understanding land-cover and landscape conditions.”
§ Anisotropic path modeling to assess pedestrianevacuation potential from Cascadia-related tsunamis in the US Pacific Northwest > 5.1 Influence of modeling assumptions
plaincorrelational- Asserted: passes — The authors put it forward as true.
- Checkable: fails — It may be too vague to check against evidence.
- Load-bearing: passes — The paper’s conclusions depend on it.
- Based: passes — The paper gives a reason why it holds.
Probably not a substantial claim. It may be too vague to check against evidence.
A conclusion the paper draws from its own results — it cites no other source for it, so there is none to check. The quote shows it is in the paper.
In the paper
“Likewise, heavy machinery, security fences, cargo containers, or fishing gear (e.g., crab pots) may constrain or block evacuation routes through coastal, non-residential areas.”
§ Anisotropic path modeling to assess pedestrianevacuation potential from Cascadia-related tsunamis in the US Pacific Northwest > 5.1 Influence of modeling assumptions
hedgedconditional- Asserted: passes — The authors put it forward as true.
- Checkable: passes — It can be checked against evidence.
- Load-bearing: fails — The paper’s conclusions may not depend on it.
- Based: fails — The paper may give no reason why it holds.
Probably not a substantial claim. The paper’s conclusions may not depend on it. The paper may give no reason why it holds.
A conclusion the paper draws from its own results — it cites no other source for it, so there is none to check. The quote shows it is in the paper.
In the paper
“At these locations, the evacuation model forces at-risk individuals to travel longer distances than needed to survive, and these additional distances may lead to greater deaths.”
§ Anisotropic path modeling to assess pedestrianevacuation potential from Cascadia-related tsunamis in the US Pacific Northwest > 5.1 Influence of modeling assumptions
hedgedconditional- Asserted: passes — The authors put it forward as true.
- Checkable: passes — It can be checked against evidence.
- Load-bearing: passes — The paper’s conclusions depend on it.
- Based: passes — The paper gives a reason why it holds.
It may state two separate claims as one.
A conclusion the paper draws from its own results — it cites no other source for it, so there is none to check. The quote shows it is in the paper.
In the paper
“At these locations, an underestimation of 9 min could mean the difference between life and death.”
§ Anisotropic path modeling to assess pedestrianevacuation potential from Cascadia-related tsunamis in the US Pacific Northwest > 4.2 Model comparison
hedgedconditional- Asserted: passes — The authors put it forward as true.
- Checkable: passes — It can be checked against evidence.
- Load-bearing: passes — The paper’s conclusions depend on it.
- Based: passes — The paper gives a reason why it holds.
Probably not a substantial claim.
A conclusion the paper draws from its own results — it cites no other source for it, so there is none to check. The quote shows it is in the paper.
In the paper
“However, for larger and more dispersed populations this factor could be significant.”
§ Anisotropic path modeling to assess pedestrianevacuation potential from Cascadia-related tsunamis in the US Pacific Northwest > 5.3 Areas for future research
hedgedconditional- Asserted: passes — The authors put it forward as true.
- Checkable: passes — It can be checked against evidence.
- Load-bearing: fails — The paper’s conclusions may not depend on it.
- Based: passes — The paper gives a reason why it holds.
Probably not a substantial claim. The paper’s conclusions may not depend on it.
A conclusion the paper draws from its own results — it cites no other source for it, so there is none to check. The quote shows it is in the paper.
In the paper
“Therefore, populations located further inland will likely have additional time to reach safety.”
§ Anisotropic path modeling to assess pedestrianevacuation potential from Cascadia-related tsunamis in the US Pacific Northwest > 5.3 Areas for future research
hedgedconditional- Asserted: passes — The authors put it forward as true.
- Checkable: passes — It can be checked against evidence.
- Load-bearing: fails — The paper’s conclusions may not depend on it.
- Based: passes — The paper gives a reason why it holds.
Probably not a substantial claim. The paper’s conclusions may not depend on it.
A conclusion the paper draws from its own results — it cites no other source for it, so there is none to check. The quote shows it is in the paper.
In the paper
“This is less of a factor, however, in more urban settings, where roads may be the more efficient, and possibly only, way to represent actual movement to higher ground, given the density of buildings and fences between properties.”
§ Anisotropic path modeling to assess pedestrianevacuation potential from Cascadia-related tsunamis in the US Pacific Northwest > 5.1 Influence of modeling assumptions
hedgedconditional- Asserted: passes — The authors put it forward as true.
- Checkable: passes — It can be checked against evidence.
- Load-bearing: fails — The paper’s conclusions may not depend on it.
- Based: passes — The paper gives a reason why it holds.
Probably not a substantial claim. The paper’s conclusions may not depend on it. It may state two separate claims as one.
A conclusion the paper draws from its own results — it cites no other source for it, so there is none to check. The quote shows it is in the paper.
In the paper
“Children at schools and day-care centers, as well as hospital patients, will be unable to reach these greater speeds; therefore, the use of slowest travel speeds is likely the most appropriate for these populations in future modeling efforts.”
§ Anisotropic path modeling to assess pedestrianevacuation potential from Cascadia-related tsunamis in the US Pacific Northwest > 4.4 Travel time
plaindirect- Asserted: passes — The authors put it forward as true.
- Checkable: passes — It can be checked against evidence.
- Load-bearing: passes — The paper’s conclusions depend on it.
- Based: passes — The paper gives a reason why it holds.
It may state two separate claims as one.
A conclusion the paper draws from its own results — it cites no other source for it, so there is none to check. The quote shows it is in the paper.
In the paper
“While all individuals may have difficulty evacuating tsunami-prone areas, these two age groups may be additionally challenged to pre-event mobility issues.”
§ Anisotropic path modeling to assess pedestrianevacuation potential from Cascadia-related tsunamis in the US Pacific Northwest > 3.5 Population exposure
hedgedconditional- Asserted: passes — The authors put it forward as true.
- Checkable: passes — It can be checked against evidence.
- Load-bearing: fails — The paper’s conclusions may not depend on it.
- Based: fails — The paper may give no reason why it holds.
Probably not a substantial claim. The paper’s conclusions may not depend on it. The paper may give no reason why it holds.
A conclusion the paper draws from its own results — it cites no other source for it, so there is none to check. The quote shows it is in the paper.
In the paper
“It also promotes a false sense of security in at-risk individuals and the emergency managers that serve them and may reduce the likelihood of communities taking action before an event to prepare.”
§ Anisotropic path modeling to assess pedestrianevacuation potential from Cascadia-related tsunamis in the US Pacific Northwest > 5.1 Influence of modeling assumptions
hedgedconditional- Asserted: passes — The authors put it forward as true.
- Checkable: fails — It may be too vague to check against evidence.
- Load-bearing: passes — The paper’s conclusions depend on it.
- Based: passes — The paper gives a reason why it holds.
Probably not a substantial claim. It may be too vague to check against evidence. It may state two separate claims as one.
A conclusion the paper draws from its own results — it cites no other source for it, so there is none to check. The quote shows it is in the paper.
In the paper
“We realize that modeling approaches described here will not perfectly represent an actual evacuation; like all evacuation models, our approach cannot fully capture all aspects of individual behavior and mobility, the dynamic nature of landscapes (e.g., weather conditions, micro-scale land change), or the interaction of individuals and their environment that would influence evacuee movement.”
§ Anisotropic path modeling to assess pedestrianevacuation potential from Cascadia-related tsunamis in the US Pacific Northwest > 1 Introduction
plain- Asserted: passes — The authors put it forward as true.
- Checkable: passes — It can be checked against evidence.
- Load-bearing: fails — The paper’s conclusions may not depend on it.
- Based: passes — The paper gives a reason why it holds.
Probably not a substantial claim. The paper’s conclusions may not depend on it. It may state two separate claims as one.
A conclusion the paper draws from its own results — it cites no other source for it, so there is none to check. The quote shows it is in the paper.
In the paper
“Although this assumption is not realistic, these calculations do demonstrate how mortality rates can be reduced if at-risk individuals are capable of improving their travel speeds.”
§ Anisotropic path modeling to assess pedestrianevacuation potential from Cascadia-related tsunamis in the US Pacific Northwest > 4.4 Travel time
boosteddirectn = 9,110- Asserted: passes — The authors put it forward as true.
- Checkable: passes — It can be checked against evidence.
- Load-bearing: passes — The paper’s conclusions depend on it.
- Based: passes — The paper gives a reason why it holds.
It may state two separate claims as one.
- The authors state this as an assumption: All residents would be capable of moving at the quicker speed.
A conclusion the paper draws from its own results — it cites no other source for it, so there is none to check. The quote shows it is in the paper.
In the paper
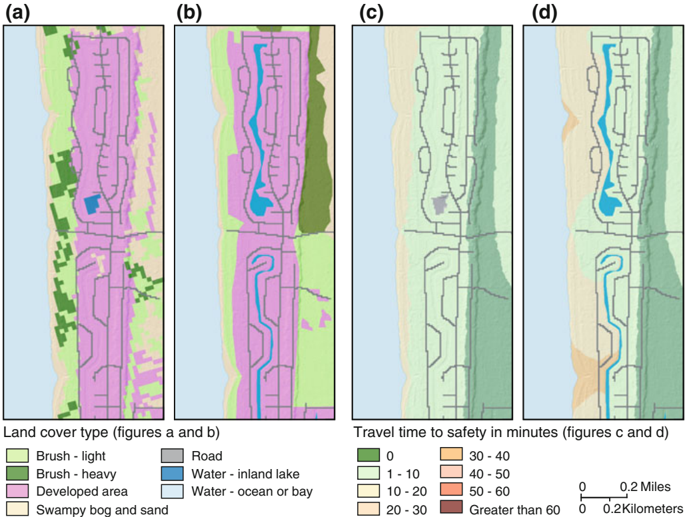
“Once these water bodies were included in the evacuation models, evacuation routes were constrained, which resulted in longer travel times.”
§ Anisotropic path modeling to assess pedestrianevacuation potential from Cascadia-related tsunamis in the US Pacific Northwest > 5.1 Influence of modeling assumptions
plaindirect- Asserted: passes — The authors put it forward as true.
- Checkable: passes — It can be checked against evidence.
- Load-bearing: passes — The paper’s conclusions depend on it.
- Based: passes — The paper gives a reason why it holds.
It may state two separate claims as one.
A conclusion the paper draws from its own results — it cites no other source for it, so there is none to check. The quote shows it is in the paper.
In the paper
“While the conservative nature of evacuation analyses suggests that one would rather see a model that overestimates evacuation time than one that underestimates them, overestimation may also introduce challenges to public preparedness and outreach.”
§ Anisotropic path modeling to assess pedestrianevacuation potential from Cascadia-related tsunamis in the US Pacific Northwest > 5.1 Influence of modeling assumptions
hedgedconditional- Asserted: passes — The authors put it forward as true.
- Checkable: fails — It may be too vague to check against evidence.
- Load-bearing: fails — The paper’s conclusions may not depend on it.
- Based: passes — The paper gives a reason why it holds.
Probably not a substantial claim. It may be too vague to check against evidence. The paper’s conclusions may not depend on it. It may state two separate claims as one.
A conclusion the paper draws from its own results — it cites no other source for it, so there is none to check. The quote shows it is in the paper.
In the paper
“Therefore, efforts to increase travel speeds via public-health campaigns may be an effective risk-reduction strategy to minimize loss of life.”
§ Anisotropic path modeling to assess pedestrianevacuation potential from Cascadia-related tsunamis in the US Pacific Northwest > 6 Conclusions
hedgedconditional- Asserted: passes — The authors put it forward as true.
- Checkable: passes — It can be checked against evidence.
- Load-bearing: passes — The paper’s conclusions depend on it.
- Based: passes — The paper gives a reason why it holds.
Probably not a substantial claim.
A conclusion the paper draws from its own results — it cites no other source for it, so there is none to check. The quote shows it is in the paper.
In the paper
“however, only the coastline would be inundated at 25 min after the initial earthquake.”
§ Anisotropic path modeling to assess pedestrianevacuation potential from Cascadia-related tsunamis in the US Pacific Northwest > 5.3 Areas for future research
hedged- Asserted: passes — The authors put it forward as true.
- Checkable: passes — It can be checked against evidence.
- Load-bearing: passes — The paper’s conclusions depend on it.
- Based: passes — The paper gives a reason why it holds.
Probably not a substantial claim.
A conclusion the paper draws from its own results — it cites no other source for it, so there is none to check. The quote shows it is in the paper.
In the paper
“In addition, certain points on the landscape may serve as evacuation chokepoints that constrain routes or create congestion (e.g., bridges or a path through a dense forest) and the application of agent-based modeling in these situations may be warranted.”
§ Anisotropic path modeling to assess pedestrianevacuation potential from Cascadia-related tsunamis in the US Pacific Northwest > 5.1 Influence of modeling assumptions
hedgedconditional- Asserted: passes — The authors put it forward as true.
- Checkable: passes — It can be checked against evidence.
- Load-bearing: fails — The paper’s conclusions may not depend on it.
- Based: passes — The paper gives a reason why it holds.
Probably not a substantial claim. The paper’s conclusions may not depend on it.
A conclusion the paper draws from its own results — it cites no other source for it, so there is none to check. The quote shows it is in the paper.
In the paper
“Although we found that these model differences did not have a substantial impact on estimated population at the time of wave arrival (0-14% difference; Table 2), this result would be different with a different population distribution or wave-arrival time.”
§ Anisotropic path modeling to assess pedestrianevacuation potential from Cascadia-related tsunamis in the US Pacific Northwest > 5.1 Influence of modeling assumptions
hedgedconditional- Asserted: passes — The authors put it forward as true.
- Checkable: passes — It can be checked against evidence.
- Load-bearing: fails — The paper’s conclusions may not depend on it.
- Based: passes — The paper gives a reason why it holds.
Probably not a substantial claim. The paper’s conclusions may not depend on it. It may state two separate claims as one.
In the paper
“This speed represents the 15th percentile of walking speeds of a mixed population and is the recommended speed for crosswalk walking speed standards in the United States (United States Department of Transportation 2009).”
§ Anisotropic path modeling to assess pedestrianevacuation potential from Cascadia-related tsunamis in the US Pacific Northwest > 3.2 Model comparison
What the sources say
- Not matchedcites United States Department of Transportation 2009
Couldn’t be matched to a paper in Crossref, so it can’t be checked.
plain- Asserted: passes — The authors put it forward as true.
- Checkable: passes — It can be checked against evidence.
- Load-bearing: passes — The paper’s conclusions depend on it.
- Based: passes — The paper gives a reason why it holds.
It may state two separate claims as one.
- Not matched
A conclusion the paper draws from its own results — it cites no other source for it, so there is none to check. The quote shows it is in the paper.
In the paper
“Given the long distances and short time periods to evacuate (over 4 km in some areas in less than 25 min), even a few extra minutes to evacuate can mean the difference between life and death for many individuals.”
§ Anisotropic path modeling to assess pedestrianevacuation potential from Cascadia-related tsunamis in the US Pacific Northwest > 5.1 Influence of modeling assumptions
plainconditional- Asserted: passes — The authors put it forward as true.
- Checkable: passes — It can be checked against evidence.
- Load-bearing: passes — The paper’s conclusions depend on it.
- Based: passes — The paper gives a reason why it holds.
Probably not a substantial claim. It may state two separate claims as one.
A conclusion the paper draws from its own results — it cites no other source for it, so there is none to check. The quote shows it is in the paper.
In the paper
“Tourists at hotels and other public venues may be physically capable of greater travel speeds but will likely be disoriented and will lose time as they navigate unfamiliar landscapes.”
§ Anisotropic path modeling to assess pedestrianevacuation potential from Cascadia-related tsunamis in the US Pacific Northwest > 4.4 Travel time
hedgedconditional- Asserted: passes — The authors put it forward as true.
- Checkable: passes — It can be checked against evidence.
- Load-bearing: passes — The paper’s conclusions depend on it.
- Based: fails — The paper may give no reason why it holds.
Probably not a substantial claim. The paper may give no reason why it holds. It may state two separate claims as one.
In the paper
“Tsunami waves will take additional time to progress from west to east, which is believed to be approximately 10 miles (*16 km) per hour (Tim Walsh, Washington Department of Natural Resources, personal communication) and inundate inland areas.”
§ Anisotropic path modeling to assess pedestrianevacuation potential from Cascadia-related tsunamis in the US Pacific Northwest > 5.3 Areas for future research
What the sources say
- Not matchedcites Tim Walsh, Washington Department of Natural Resources, personal communication
Couldn’t be matched to a paper in Crossref, so it can’t be checked.
hedgeddirect- Asserted: fails — The authors may not put it forward as true.
- Checkable: passes — It can be checked against evidence.
- Load-bearing: fails — The paper’s conclusions may not depend on it.
- Based: passes — The paper gives a reason why it holds.
Probably not a substantial claim. The authors may not put it forward as true. The paper’s conclusions may not depend on it.
- Not matched
In the paper
“These conclusions support the notion that a place-based context is important for understanding community vulnerability to natural hazards (Jones and Andrey 2007).”
§ Anisotropic path modeling to assess pedestrianevacuation potential from Cascadia-related tsunamis in the US Pacific Northwest > 6 Conclusions
What the sources say
- Not checked — no full text of the sourcecites Jones and Andrey 2007 source
plaincorrelational- Asserted: passes — The authors put it forward as true.
- Checkable: fails — It may be too vague to check against evidence.
- Load-bearing: fails — The paper’s conclusions may not depend on it.
- Based: passes — The paper gives a reason why it holds.
Probably not a substantial claim. It may be too vague to check against evidence. The paper’s conclusions may not depend on it.
A conclusion the paper draws from its own results — it cites no other source for it, so there is none to check. The quote shows it is in the paper.
In the paper
“Where these small differences matter most are in the areas where every second counts for a successful evacuation, such as the interface of the yellow (1-24 min) and orange zones (25-49 min) in Fig. 2a.”
§ Anisotropic path modeling to assess pedestrianevacuation potential from Cascadia-related tsunamis in the US Pacific Northwest > 4.2 Model comparison
plainconditional- Asserted: passes — The authors put it forward as true.
- Checkable: passes — It can be checked against evidence.
- Load-bearing: passes — The paper’s conclusions depend on it.
- Based: passes — The paper gives a reason why it holds.
Probably not a substantial claim.
A conclusion the paper draws from its own results — it cites no other source for it, so there is none to check. The quote shows it is in the paper.
In the paper
“In addition to incorporating small water bodies, it is important to also consider the feasibility of modeled routes and route capacities given real-word land conditions which will vary from their geospatial interpretations.”
§ Anisotropic path modeling to assess pedestrianevacuation potential from Cascadia-related tsunamis in the US Pacific Northwest > 5.1 Influence of modeling assumptions
plain- Asserted: passes — The authors put it forward as true.
- Checkable: passes — It can be checked against evidence.
- Load-bearing: passes — The paper’s conclusions depend on it.
- Based: passes — The paper gives a reason why it holds.
Probably not a substantial claim.
A conclusion the paper draws from its own results — it cites no other source for it, so there is none to check. The quote shows it is in the paper.
In the paper
“Underestimation of travel times is a public-safety concern if at-risk individuals think they have more time than they really do to evacuate.”
§ Anisotropic path modeling to assess pedestrianevacuation potential from Cascadia-related tsunamis in the US Pacific Northwest > 5.1 Influence of modeling assumptions
plainconditional- Asserted: passes — The authors put it forward as true.
- Checkable: fails — It may be too vague to check against evidence.
- Load-bearing: passes — The paper’s conclusions depend on it.
- Based: passes — The paper gives a reason why it holds.
Probably not a substantial claim. It may be too vague to check against evidence.
A conclusion the paper draws from its own results — it cites no other source for it, so there is none to check. The quote shows it is in the paper.
In the paper
“Therefore, although differences in modeled evacuation times between Anisotropic and Isotropic approaches may seem insignificant across an entire study area (Fig. 2d), there may be important local differences and an anisotropic approach that uses high-resolution elevation data and path-distance algorithms is recommended in future evacuation-modeling efforts.”
§ Anisotropic path modeling to assess pedestrianevacuation potential from Cascadia-related tsunamis in the US Pacific Northwest > 5.1 Influence of modeling assumptions
hedged- Asserted: passes — The authors put it forward as true.
- Checkable: passes — It can be checked against evidence.
- Load-bearing: passes — The paper’s conclusions depend on it.
- Based: passes — The paper gives a reason why it holds.
It may state two separate claims as one.
In the paper
“Tsunami-prone areas of Long Beach Peninsula contain thousands of residents and employees, as well as several public venues, hotels and restaurants, dependent-care facilities, and critical facilities (Wood and Soulard 2008).”
§ Anisotropic path modeling to assess pedestrianevacuation potential from Cascadia-related tsunamis in the US Pacific Northwest > 2 Study area
What the sources say
- Not matchedcites Wood and Soulard 2008
Couldn’t be matched to a paper in Crossref, so it can’t be checked.
plain- Asserted: passes — The authors put it forward as true.
- Checkable: passes — It can be checked against evidence.
- Load-bearing: unclear — It is unclear whether the paper’s conclusions depend on it.
- Based: passes — The paper gives a reason why it holds.
It may state two separate claims as one.
- Not matched
What the paper did — it cites no source for this, so there is none to check. The quote shows it is in the paper.
In the paper
“In addition, LCD approaches described here do not account for changes in route capacity or congestion.”
§ Anisotropic path modeling to assess pedestrianevacuation potential from Cascadia-related tsunamis in the US Pacific Northwest > 5.3 Areas for future research
plain- Asserted: passes — The authors put it forward as true.
- Checkable: passes — It can be checked against evidence.
- Load-bearing: fails — The paper’s conclusions may not depend on it.
- Based: passes — The paper gives a reason why it holds.
Probably not a substantial claim. The paper’s conclusions may not depend on it.
The authors state this as an assumption.
Pedestrian fatigue is minimal and travel speeds remain constant during evacuation.
“For the purposes of this analysis, we assume that pedestrian fatigue is minimal and travel speeds remain constant.”
The authors state this as an assumption.
Many evacuees will be incapable of running because of age, health, or other mobility issues.
“An approach proposed by Hayes ( described in Norman 2004) is empirically based but is based on wilderness runner data and we assume many evacuees will be incapable of running because of age, health, or other mobility issues (e.g., parents carrying children).”
The authors state this as an assumption.
Walking speeds will decrease in proportion to the changes in energy required to move across different land-cover types.
“This approach assumes walking speeds will decrease in proportion to the changes in energy required to move across different land-cover types.”
The authors state this as an assumption.
An anisotropic, path-distance approach to LCD pedestrian-evacuation modeling is the most appropriate approach because it incorporates variations in land cover and the directionality of an evacuation.
“We assume that an anisotropic, path-distance approach to LCD pedestrian-evacuation modeling is the most appropriate approach because it incorporates variations in land cover and the directionality of an evacuation.”
The authors state this as an assumption.
All residents would be capable of moving at the quicker speed.
“assuming all residents would be capable of moving at the quicker speed.”
The authors state this as an assumption.
Tsunami arrival is 25 min after the initial earthquake.
“assumed here to be 25 min after the initial earthquake”
The authors state this as an assumption.
People at locations where travel time is 25 min or less could evacuate in time.
“people we assume that could evacuate in time”
The authors state this as an assumption.
The speed conservation values for slope and land cover are independent of one another.
“Doing so, however, assumes that the SCV for slope and land cover are independent of one another (e.g., the impact of movement on sand versus roads will remain constant regardless of the slope on which they are found).”
The authors state this as an assumption.
Evacuation speeds remain constant over long distances, ignoring the influence of fatigue.
“As noted earlier, we assumed that evacuation speeds would remain constant over long distances, ignoring the influence of fatigue”
The authors state this as an assumption.
Travel speeds over various land-cover types can be estimated based on Soule and Goldman's (1972) terrain energy coefficients.
“and that travel speeds over various land-cover types could be estimated based on Soule and Goldman's (1972) terrain energy coefficients.”
The authors state this as an assumption.
All locations in the study area will be inundated at the same time.
“That assumes that all locations in the study area will be inundated at the same time; however, only the coastline would be inundated at 25 min after the initial earthquake.”
The authors state this as an assumption.
People will initiate self-evacuations immediately after ground-shaking ends.
“For instance, maps of travel times presented in this paper assume that people will initiate self-evacuations immediately after ground-shaking ends.”
The paper relies on this without support.
Evacuations will be delayed as individuals take time to process natural cues, validate observations, fulfill caregiver roles, or gather items.
“In reality, evacuations will be delayed as individuals take time to process observed natural cues, such as prolonged ground shaking or shoreline draw-down.”
The paper relies on this without support.
Many people may stick to roads during an evacuation.
“To account for the likelihood that many people may stick to roads during an evacuation, results of the anisotropic modeling approach could be combined with results of a roads-only modeling approach (for example, results represented as a range or with some sort of error bar).”
Claims other papers make about this one
Each is checked against this paper’s own text: does it say what the citing paper says it does?
The source backs part of the claim, not all of it — or backs it for a different population, condition or comparison.
In the citing paper
“Wood and Schmidtlein [13], took all three of Arnet’s factors into account, and looked at evacuating citizens in the event of a hurricane. They applied Tobler’s function to both the hill slopes and walking slopes, and calculated the terrain obstruction coefficients based on energy usage rather than walking speed (using [14]).”
From Improved prediction of hiking speeds using a data driven approach (2023) · cites this paper as [13]
Experimental — accuracy not yet measuredThe cited source says what the claim attributes to it.
In the citing paper
“current land cover SCVs used by Wood & Schmidtlein, 2012 are based on differences in the amount of energy used to move across different land cover types (Soule & Goldman, 1972).”
From Sensitivity of tsunami evacuation modeling to direction and land cover assumptions (2015) · cites this paper as Wood & Schmidtlein, 2012
The cited source says what the claim attributes to it.
In the citing paper
“According to the model sensitivity analysis conducted by Wood and Schmidtlein (2012), PEAT tended to underestimate the required evacuation time with coarser-resolution elevation data.”
From Pedestrian evacuation time calculation against tsunami hazard for southern coasts of bodrum peninsula (2023) · cites this paper as Wood and Schmidtlein (2012)
In the citing paper
“Land cover and elevation-derived slope data are converted to speed conservation values (SCVs), representing maximum travel speeds expected on areas with given conditions(Wood and Schmidtlein 2012).”
From Pedestrian evacuation time calculation against tsunami hazard for southern coasts of bodrum peninsula (2023) · cites this paper as Wood and Schmidtlein 2012
Self-check
Percentages, sums and reported differences re-computed from the paper’s own numbers.
Each contradiction between two passages listed here was confirmed by an independent check.
Rated major: it would touch a result — a value a result rests on, reported and recomputed p-values on opposite sides of the significance level, two passages that conflict with no sign which is right, or a cited work retracted before this paper was published.
In the paper
§ Anisotropic path modeling to assess pedestrianevacuation potential from Cascadia-related tsunamis in the US Pacific Northwest > 4.4 Travel time
“This change in travel speed translates in a reduction of lives lost from 4,464 to 638 residents (Table 3)”
§ Anisotropic path modeling to assess pedestrianevacuation potential from Cascadia-related tsunamis in the US Pacific Northwest > 6 Conclusions
“| Residents (n = 9,110) | 4,402 | 4,067 | 3,502 | 3,120 | 1,479 | 693 |”
Rated minor: it would not touch a result — a value no result rests on, a p-value that stays on the same side of the significance level, or a conflict that is clerical, resolved elsewhere in the paper, or outside its own findings.
In the paper
§ Anisotropic path modeling to assess pedestrianevacuation potential from Cascadia-related tsunamis in the US Pacific Northwest > 4.4 Travel time
“At the critical threshold of 25 min, the percentage of study-area residents (n = 9,110)”
§ Anisotropic path modeling to assess pedestrianevacuation potential from Cascadia-related tsunamis in the US Pacific Northwest > 6 Conclusions
“b the cumulative percentage of residents (n = 9,008) as a function of calculated travel times to safety”
Citations
Cites
Field Studies of Pedestrian Walking Speed and Start-Up Time
Knoblauch, R. L., Pietrucha, M. T., & Nitzburg, M. (1996) · Transportation Research Record Journal of the Transportation Research Board · doi:10.3141/1538-04 · Cited by 597
Jonkman, S. N., Vrijling, J. K., & Vrouwenvelder, A. C. W. M. (2008) · Natural Hazards · doi:10.1007/s11069-008-9227-5 · Cited by 316
Characteristics of older pedestrians who have difficulty crossing the street.
Langlois, J. A., Keyl, P. M., Guralnik, J. M., Foley, D., Marottoli, R. A., & Wallace, R. B. (1997) · American Journal of Public Health · doi:10.2105/ajph.87.3.393 · Cited by 270
Terrain coefficients for energy cost prediction.
Soule, R. G., & Goldman, R. F. (1972) · Journal of Applied Physiology · doi:10.1152/jappl.1972.32.5.706 · Cited by 202
Gesch, D. B., Evans, G. A., Mauck, J., Hutchinson, J., & Carswell, W. J. (2009) · Fact sheet · doi:10.3133/fs20093053 · Cited by 138
Jones, B., & Andrey, J. (2007) · International Journal of Emergency Management · doi:10.1504/ijem.2007.013994 · Cited by 99
Wood, N., & Schmidtlein, M. C. (2012) · Natural Hazards · doi:10.1007/s11069-012-0434-8 · Cited by 81
Self-citationPost, J., Wegscheider, S., Mück, M., Zosseder, K., Kiefl, R., Steinmetz, T., & Strunz, G. (2009) · Natural Hazards and Earth System Sciences · doi:10.5194/nhess-9-1075-2009 · Cited by 73
Modeling slope as a contributor to route selection in mountainous areas
Pingel, T. J. (2010) · Cartography and Geographic Information Science · doi:10.1559/152304010791232163 · Cited by 72
Managing tsunami risk in coastal communities: Identifying predictors of preparedness
Paton, D., Houghton, B. F., Gregg, C. E., Gill, D. A., Ritchie, L. A., McIvor, D. W., Larin, P., Meinhold, S., Horan, J. E., & Johnston, D. M. (2008) · eCite Digital Repository (University of Tasmania) · Cited by 49
Research works printed but not linked: 5
- Butler B, Cohen J, Putnam T, Bartlette R, Bradshaw L (2000) A method for evaluating the effectiveness of firefighter escape routes. In: Proceedings of the 2000 international wildfire safety summit, pp 42–53
- Cascadia Region Earthquake Workgroup (2005) Cascadia subduction zone earthquakes—a magnitude 9.0 earthquake scenario. Oregon Department of Geology and Mineral Industries, Portland
- Hewett M (2005) Automating feature extraction with the ArcGIS spatial analyst extension. 2005 ESRI international users conference proceedings. Available at http://proceedings.esri.com/library/userconf/proc05/papers/pap2109.pdf . Accessed 16 Aug 2010
- National Research Council (2011) Tsunami warning and preparedness: an assessment of the US tsunami program and the nation’s preparedness efforts, Committee on the Review of the Tsunami Warning and Forecast System and Overview of the Nation’s Tsunami Preparedness, National Research Council, 284 pp
- Scarf P (1998) An empirical basis for Naismith’s rule. Math Today Bull Inst Math Appl 34(5):149–152
Cited by
Sorted by citations
An agent-based model of a multimodal near-field tsunami evacuation: Decision-making and life safety
Wang, H., Mostafizi, A., Cramer, L. A., Cox, D. T., & Park, H. (2015) · Transportation Research Part C Emerging Technologies · doi:10.1016/j.trc.2015.11.010 · Cited by 281
Mostafizi, A., Wang, H., Cox, D. T., Cramer, L. A., & Dong, S. (2017) · Natural Hazards · doi:10.1007/s11069-017-2927-y · Cited by 136
Mostafizi, A., Wang, H., Cox, D. T., & Dong, S. (2018) · International Journal of Disaster Risk Reduction · doi:10.1016/j.ijdrr.2018.12.018 · Cited by 128
León, J., & March, A. (2014) · Habitat International · doi:10.1016/j.habitatint.2014.04.006 · Cited by 117
Makinoshima, F., Imamura, F., & Oishi, Y. (2020) · Progress in Disaster Science · doi:10.1016/j.pdisas.2020.100113 · Cited by 99
Metadata
- Authors
- Wood, N. J., & Schmidtlein, M. C.
- Venue
- Natural Hazards
- Published
- 2011-10-16
- Volume
- 62
- Issue
- 2
- Pages
- 275-300
- ISSN
- 0921-030X (ISSN-L)
- 1573-0840
- OpenAlex
- W2068875301
- Semantic Scholar
- 099eef45c0aa0bb05700da7463eb513288bacdcf
- Cited by
- 133
- References
- 18
- Citations by year
- 2026: 7 · 2025: 7 · 2024: 11 · 2023: 14 · 2022: 11 · 2021: 11 · 2020: 7 · 2019: 18 · 2018: 7 · 2017: 9 · 2016: 9 · 2015: 7 · 2014: 9 · 2013: 3 · 2012: 2
- FWCI
- 19.40
- Type
- journal article
- Language
- en
- Open access
- hybrid
- doi.org
- Licence
- cc-by-nc
- Locations
- Natural Hazards (publishedVersion, cc-by-nc)
- RePEc: Research Papers in Economics (submittedVersion)
- Funders
- U.S. Geological Survey
- Oregon Sea Grant, Oregon State University
- Topics
- Social Sciences › Safety Research › Evacuation and Crowd Dynamics
- Physical Sciences › Engineering › Civil and Structural Engineering › Earthquake and Tsunami Effects
- Social Sciences › Geography, Planning and Development › Earthquake and Disaster Impact Studies
- Keywords
- tsunami evacuation, crowd evacuation, vertical evacuation, Cascadia Subduction Zone earthquake, near-field tsunami, travel time, land cover, travel speed, tsunami risk reduction, tsunami education
About these checks
Registry, retraction, Cites and statistics results are computed, not judged, with one exception: a printed reference that no index lists is read once by a model before it counts as a citation error. Claims are extracted by a model and kept only when their quote appears verbatim in the text; each cited source is then checked, with a model’s help, for whether it says what the claim relies on. Those verdicts can be wrong — read the claim’s quote and the cited source before relying on one.
A language model drew the claims from the paper on 2026-11-09, under version 3 of the claim definition (model deepseek-v4.1-flash, prompt extract-v3).
A second model labelled each claim on 2026-11-09 (model jev-1.13-20260917, definition revision gold-guideline-v0.2).
Statistics and arithmetic are recomputed, not judged.
Confidence bands are shown only for fields calibrated on our annotated test set. None is calibrated yet, so no band is shown.
What counts as a claim ›How we measure confidence ›How we check this ›
Are you an author, or do you see a problem with this page? Request a review
