

The DOI matches its Crossref record; 39 of the 39 references it cites were found in a registry or an index; none of the 54 sources its claims cite is checked for support yet.
Hip and spine bone mineral density are greater in master sprinters, but not endurance runners compared with non-athletic controls
Open accessAbstract
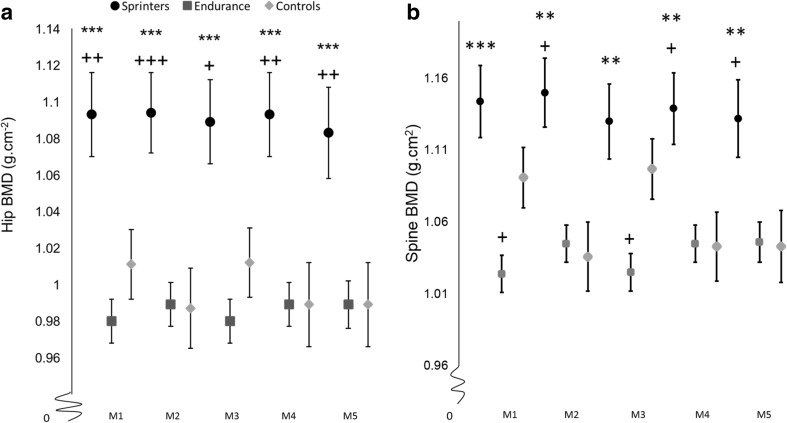
We examined bone density in older athletes and controls. Sprinters had greater hip and spine bone density than endurance athletes and controls, whereas values were similar in the latter two groups. These results could not be explained by differences in impact, muscle size or power between sprint and endurance athletes. PURPOSE: We examined the relationship between prolonged participation in regular sprint or endurance running and skeletal health at key clinical sites in older age, and the factors responsible for any associations which we observed. METHODS: We recruited 38 master sprint runners (28 males, 10 females, mean age 71 ± 7 years), 149 master endurance runners (111 males, 38 females, mean age 70 ± 6 years) and 59 non-athletic controls (29 males, 30 females, mean age 74 ± 5 years). Dual X-ray absorptiometry was used to assess hip and spine bone mineral density (BMD), body composition (lean and fat mass), whilst jump power was assessed with jumping mechanography. In athletes, vertical impacts were recorded over 7 days from a waist-worn accelerometer, and details of starting age, age-graded performance and training hours were recorded. RESULTS: In ANOVA models adjusted for sex, age, height, body composition, and jump power, sprinter hip BMD was 10 and 14% greater than that of endurance runners and controls respectively. Sprinter spine BMD was also greater than that of both endurance runners and controls. There were no differences in hip or spine BMD between endurance runners and controls. Stepwise regression showed only discipline (sprint/endurance), sex, and age as predictors of athlete spine BMD, whilst these variables and starting age were predictive of hip BMD. CONCLUSIONS: Regular running is associated with greater BMD at the fracture-prone hip and spine sites in master sprinters but not endurance runners. These benefits cannot be explained by indicators of mechanical loading measured in this study including vertical impacts, body composition or muscular output.
Overview
CoChat Summary
TL;DR
Master sprinters had greater hip and spine bone mineral density (BMD) than endurance runners and non-athletic controls, whereas endurance runners showed no BMD advantage over controls. These differences persisted after adjustment for body composition and jump power and were not explained by measured vertical impacts.
Key findings
- In ANOVA models adjusted for sex, age, height, body composition, and jump power, sprinter hip BMD was 10% and 14% greater than that of endurance runners and controls, respectively; sprinter spine BMD was also greater than both groups, while endurance runners and controls did not differ at hip or spine.
- Stepwise regression identified discipline (sprint/endurance), sex, and age as predictors of athlete spine BMD; these variables plus starting age predicted athlete hip BMD.
- Sprinters had greater lean mass and 10–30% greater relative and absolute power values than endurance runners and controls.
- Endurance athletes recorded 2.2-fold and 3.0-fold higher low- and medium-impact counts than sprinters, but high-impact counts did not differ between the athlete groups.
Methods
- Cross-sectional comparison of 38 master sprinters (28 males, 10 females; mean age 71 ± 7 years), 149 master endurance runners (111 males, 38 females; mean age 70 ± 6 years), and 59 non-athletic controls (29 males, 30 females; mean age 74 ± 5 years).
- Dual X-ray absorptiometry measured hip and spine BMD and body composition; jumping mechanography assessed lower-limb muscle power; athletes wore a waist accelerometer for 7 days to record vertical impacts.
- Analyses used ANOVA/ANCOVA models with sequential adjustment for age, height, sex, fat mass, lean mass, and absolute power, plus single-factor and stepwise linear regressions in athletes.
Limitations
- The paper states the cross-sectional design limits causal inference and leaves possible uncontrolled confounding; it also notes little information on medications, nutrient intake including vitamin D, and hormones such as testosterone.
- The authors state that a detailed training log was not taken and that accelerometer displacement during extreme high impacts could affect accuracy; accelerometers registered only vertical impacts, not horizontal components.
- The paper notes muscle measures were obtained at a single time point late in life and may have underestimated life-course differences; evident from the text, controls were older than both athlete groups, and self-selection bias into sport is proposed as an alternative explanation.
Model-written summary. Check it against the paper before relying on it.
Integrity signals
Registry
Cites
Statistics
Figures
Verification
Claims the paper makes
0 Valid · 0 Not valid · 27 Not checked · 57 Own results and interpretations
A result the paper reports from its own data — it cites no other source for it, so there is none to check. The quote shows it is in the paper.
In the paper
“values were similar in the latter two groups”
- Also stated in: § Results · plain
“There were no differences in hip or spine BMD between endurance runners and controls.”
§ Hip and spine bone mineral density are greater in master sprinters, but not endurance runners compared with non-athletic controls > Abstract > Summary
plain- Asserted: passes — The authors put it forward as true.
- Checkable: passes — It can be checked against evidence.
- Load-bearing: passes — The paper’s conclusions depend on it.
- Based: passes — The paper gives a reason why it holds.
- Rests on an assumption not shown here.
- Also stated in: § Results · plain
A result the paper reports from its own data — it cites no other source for it, so there is none to check. The quote shows it is in the paper.
In the paper
“Sprinters had greater hip and spine bone density than endurance athletes and controls”
- Also stated in: § Conclusions · plain
“Regular running is associated with greater BMD at the fracture-prone hip and spine sites in master sprinters but not endurance runners.”
§ Hip and spine bone mineral density are greater in master sprinters, but not endurance runners compared with non-athletic controls > Abstract > Summary
plain- Asserted: passes — The authors put it forward as true.
- Checkable: passes — It can be checked against evidence.
- Load-bearing: passes — The paper’s conclusions depend on it.
- Based: passes — The paper gives a reason why it holds.
- Rests on 2 assumptions not shown here.
- Also stated in: § Conclusions · plain
A result the paper reports from its own data — it cites no other source for it, so there is none to check. The quote shows it is in the paper.
In the paper
“Sprinter spine BMD was also greater than that of both endurance runners and controls.”
§ Hip and spine bone mineral density are greater in master sprinters, but not endurance runners compared with non-athletic controls > Abstract > Results
plain- Asserted: passes — The authors put it forward as true.
- Checkable: passes — It can be checked against evidence.
- Load-bearing: passes — The paper’s conclusions depend on it.
- Based: passes — The paper gives a reason why it holds.
- Rests on 2 assumptions not shown here.
A result the paper reports from its own data — it cites no other source for it, so there is none to check. The quote shows it is in the paper.
In the paper
“this relationship was no longer observed once discipline was included in the regression,”
§ Hip and spine bone mineral density are greater in master sprinters, but not endurance runners compared with non-athletic controls > Discussion
plain- Asserted: passes — The authors put it forward as true.
- Checkable: passes — It can be checked against evidence.
- Load-bearing: passes — The paper’s conclusions depend on it.
- Based: passes — The paper gives a reason why it holds.
A result the paper reports from its own data — it cites no other source for it, so there is none to check. The quote shows it is in the paper.
In the paper
“There were no differences in hip BMD between endurance and controls for any model (all P > 0.15).”
§ Hip and spine bone mineral density are greater in master sprinters, but not endurance runners compared with non-athletic controls > Results > Bone mineral density
plain- Asserted: passes — The authors put it forward as true.
- Checkable: passes — It can be checked against evidence.
- Load-bearing: passes — The paper’s conclusions depend on it.
- Based: passes — The paper gives a reason why it holds.
29 more claims
Create a free account to see all 84 claims and to verify the 54 references still open.
- It may state two separate claims as one. 33
- Probably not a substantial claim. 26
Claims other papers make about this one
Each is checked against this paper’s own text: does it say what the citing paper says it does?
In the citing paper
“In Masters Athletes, Piasecki et al. [13, 14] stated that especially sprinting is associated with greater hip, spine and tibial BMD. What is more this effect was not confirmed to endurance running.”
From Bone mineral density in elite masters athletes: the effect of body composition and long-term exercise (2021) · cites this paper as [13]
In the citing paper
“Thus, masters athletes should have greater bone mineral density than aged-matched non-athletes and inactive peers [13, 14].”
From Bone mineral density in elite masters athletes: the effect of body composition and long-term exercise (2021) · cites this paper as [13]
In the citing paper
“There is evidence that chronic physical activity associated with the training of many Master athletes (especially those performing strength and power training) helps maintain bone mineral density [9, 173]”
From Protein Requirements for Master Athletes: Just Older Versions of Their Younger Selves (2021) · cites this paper as [173]
Self-check
Percentages, sums and reported differences re-computed from the paper’s own numbers.
Each contradiction between two passages listed here was confirmed by an independent check.
Rated major: it would touch a result — a value a result rests on, reported and recomputed p-values on opposite sides of the significance level, two passages that conflict with no sign which is right, or a cited work retracted before this paper was published.
In the paper
§ Hip and spine bone mineral density are greater in master sprinters, but not endurance runners compared with non-athletic controls > Materials and methods > Accelerometry
“These were condensed to three impact bands; low (≥ 0.5 to < 1.0 g), medium (≥ 1.0 to < 1.5 g) and higher (≥ 1.5 g) impact.”
§ Hip and spine bone mineral density are greater in master sprinters, but not endurance runners compared with non-athletic controls > Results > Characteristics related to athletic training
“Accelerometry medium impact (1–3.5 g) counts | Accelerometry medium impact (1–3.5 g) counts | 6434 (2364–13,692) | 3326 (694–13,081) | 33,458 (18847–49,909) | 29,868 (21076–41,859)”
Rated major: it would touch a result — a value a result rests on, reported and recomputed p-values on opposite sides of the significance level, two passages that conflict with no sign which is right, or a cited work retracted before this paper was published.
In the paper
§ Hip and spine bone mineral density are greater in master sprinters, but not endurance runners compared with non-athletic controls > Results > Regression analysis
“Discipline (sprinter), training age, and fat mass were positively associated with spine BMD”
§ Hip and spine bone mineral density are greater in master sprinters, but not endurance runners compared with non-athletic controls > Results > Regression analysis
“Training age1 | Training age1 | − 0.231 | − 0.366 | − 0.096 | 0.001 | − 0.153 | − 0.284 | − 0.021 | 0.024”
Rated minor: it would not touch a result — a value no result rests on, a p-value that stays on the same side of the significance level, or a conflict that is clerical, resolved elsewhere in the paper, or outside its own findings.
In the paper
§ Hip and spine bone mineral density are greater in master sprinters, but not endurance runners compared with non-athletic controls > Materials and methods > DXA scans
“Repeat total body and hip DXA scans were performed in eight MAs within 1 month of the original scan.”
§ Hip and spine bone mineral density are greater in master sprinters, but not endurance runners compared with non-athletic controls > Materials and methods > DXA scans
“Using these repeat scans the short-term error for our laboratory was 2.0% for hip BMD and 0.9% for spine BMD.”
Rated minor: it would not touch a result — a value no result rests on, a p-value that stays on the same side of the significance level, or a conflict that is clerical, resolved elsewhere in the paper, or outside its own findings.
In the paper
§ Hip and spine bone mineral density are greater in master sprinters, but not endurance runners compared with non-athletic controls > Results > Regression analysis
“Results of linear regressions between individual athlete characteristics and bone outcomes, when adjusted for age, height, body mass and sex are shown in Table 4.”
§ Hip and spine bone mineral density are greater in master sprinters, but not endurance runners compared with non-athletic controls > Results > Regression analysis
“Table 4 Results of linear regression between each individual athlete characteristic and bone outcomes in athletes only, adjusting for age, height, and sex presented as standardised regression coefficient (β)”
Rated minor: it would not touch a result — a value no result rests on, a p-value that stays on the same side of the significance level, or a conflict that is clerical, resolved elsewhere in the paper, or outside its own findings.
In the paper
§ Hip and spine bone mineral density are greater in master sprinters, but not endurance runners compared with non-athletic controls > Abstract > Methods
“149 master endurance runners (111 males, 38 females, mean age 70 ± 6 years)”
§ Hip and spine bone mineral density are greater in master sprinters, but not endurance runners compared with non-athletic controls > Results > Participant characterisation
“Age (years) | 70.9 ± 6.4 | 71.5 ± 7.9 | 69.9 ± 5.7 | 69.1 ± 50 | 74.1 ± 5.7 | 73.3 ± 4.5”
2 more findings
Create a free account to see every finding of this check.
Citations
Cites
Bone “mass” and the “mechanostat”: A proposal
Frost, H. M. (1987) · The Anatomical Record · doi:10.1002/ar.1092190104 · Cited by 2,132
Regulation of bone formation by applied dynamic loads.
Rubin, C. T., & Lanyon, L. E. (1984) · The Journal of Bone & Joint Surgery · doi:10.2106/00004623-198466030-00012 · Cited by 1,558
Relationships between Ground Reaction Force Impulse and Kinematics of Sprint-Running Acceleration
Hunter, J. P., Marshall, R. N., & McNair, P. J. (2005) · Journal of Applied Biomechanics · doi:10.1123/jab.21.1.31 · Cited by 454
Ground reaction forces in running: A reexamination
Munro, C. F., Miller, D. I., & Fuglevand, A. J. (1987) · Journal of Biomechanics · doi:10.1016/0021-9290(87)90306-x · Cited by 427
Five Jumps per Day Increase Bone Mass and Breaking Force in Rats
Umemura, Y., Ishiko, T., Yamauchi, T., Kurono, M., & Mashiko, S. (1997) · Journal of Bone and Mineral Research · doi:10.1359/jbmr.1997.12.9.1480 · Cited by 421
Effect of Running Speed on Lower Limb Joint Kinetics
SCHACHE, A. G., BLANCH, P. D., DORN, T. W., BROWN, N. A. T., ROSEMOND, D., & PANDY, M. G. (2011) · Medicine & Science in Sports & Exercise · doi:10.1249/mss.0b013e3182084929 · Cited by 361
Femoral Neck Structure in Adult Female Athletes Subjected to Different Loading Modalities
Nikander, R., Sievänen, H., Heinonen, A., & Kannus, P. (2005) · Journal of Bone and Mineral Research · doi:10.1359/jbmr.041119 · Cited by 261
Adipose Tissue Stimulates Bone Growth in Prepubertal Children
Clark, E. M., Ness, A. R., & Tobias, J. H. (2006) · The Journal of Clinical Endocrinology & Metabolism · doi:10.1210/jc.2006-0332 · Cited by 179
Self-citationNikander, R., Sievänen, H., Uusi-Rasi, K., Heinonen, A., & Kannus, P. (2006) · Bone · doi:10.1016/j.bone.2006.04.005 · Cited by 166
Wilks, D. C., Winwood, K., Gilliver, S. F., Kwiet, A., Chatfield, M., Michaelis, I., Sun, L. W., Ferretti, J. L., Sargeant, A. J., Felsenberg, D., et al. (2009) · Bone · doi:10.1016/j.bone.2009.03.660 · Cited by 119
Variations in ground reaction force parameters at different running speeds
Hamill, J., Bates, B. T., Knutzen, K. M., & Sawhill, J. A. (1983) · Human Movement Science · doi:10.1016/0167-9457(83)90005-2 · Cited by 118
Bailey, C. A., & Brooke-Wavell, K. (2010) · Bone · doi:10.1016/j.bone.2009.12.001 · Cited by 112
Bone Loss and Fracture Risk After Reduced Physical Activity
Nordström, A., Karlsson, C., Nyquist, F., Olsson, T., Nordström, P., & Karlsson, M. (2005) · Journal of Bone and Mineral Research · doi:10.1359/jbmr.041012 · Cited by 112
Low lumbar spine bone mineral density in both male and female endurance runners
Hind, K., Truscott, J. G., & Evans, J. A. (2006) · Bone · doi:10.1016/j.bone.2006.03.012 · Cited by 105
Low bone mineral density in highly trained male master cyclists
Palmer, J. E., Levy, S. S., & Nichols, J. F. (2003) · Osteoporosis International · doi:10.1007/s00198-003-1418-z · Cited by 92
Johansson, J., Nordström, A., & Nordström, P. (2015) · Bone · doi:10.1016/j.bone.2015.07.001 · Cited by 71
Bone Density and Young Athletic Women: An Update
Nichols, D. L., Sanborn, C. F., & Essery, E. V. (2007) · Sports Medicine · doi:10.2165/00007256-200737110-00006 · Cited by 68
Calibration and Validation of a Wrist- and Hip-Worn Actigraph Accelerometer in 4-Year-Old Children
Johansson, E., Larisch, L.-M., Marcus, C., & Hagströmer, M. (2016) · PLOS ONE · doi:10.1371/journal.pone.0162436 · Cited by 59
McPhee, J. S., Hogrel, J., Maier, A. B., Seppet, E. K., Seynnes, O., Sipilä, S., Bottinelli, R., Barnouin, Y., Bijlsma, A. Y., Gapeyeva, H., et al. (2013) · Biogerontology · doi:10.1007/s10522-013-9434-7 · Cited by 57
Self-citationARI, Z., KUTLU, N., SAMI UYANIK, B., TANELI, F., BUYUKYAZI, G., & TAVLI, T. (2004) · International Journal of Neuroscience · doi:10.1080/00207450490430499 · Cited by 55
Ireland, A., Maden-Wilkinson, T., Ganse, B., Degens, H., & Rittweger, J. (2014) · Osteoporosis International · doi:10.1007/s00198-014-2617-5 · Cited by 54
Self-citationCapozza, R. F., Cointry, G. R., Cure-Ramı́rez, P., Ferretti, J. L., & Cure-Cure, C. (2004) · Bone · doi:10.1016/j.bone.2004.03.010 · Cited by 49
Hannam, K., Deere, K. C., Hartley, A., Al-Sari, U. A., Clark, E. M., Fraser, W. D., & Tobias, J. H. (2017) · Osteoporosis International · doi:10.1007/s00198-016-3863-5 · Cited by 48
Self-citationHardcastle, S. A., Gregson, C. L., Rittweger, J., Crabtree, N., Ward, K., & Tobias, J. H. (2014) · The Journal of Clinical Endocrinology & Metabolism · doi:10.1210/jc.2013-2837 · Cited by 40
Self-citationThe effect of moderate impact exercise on skeletal integrity in master athletes
Velez, N. F., Zhang, A., Stone, B., Perera, S., Miller, M., & Greenspan, S. L. (2008) · Osteoporosis International · doi:10.1007/s00198-008-0590-6 · Cited by 38
Deere, K. C., Hannam, K. J., Coulson, J., Ireland, A., McPhee, J. S., Moss, C. L., Edwards, M. H., Dennison, E. M., Cooper, C. C., Sayers, A. E., et al. (2015) · Journal of Aging and Physical Activity · doi:10.1123/japa.2015-0066 · Cited by 38
Self-citationHannam, K. J., Deere, K. C., Hartley, A. E., Clark, E., Coulson, J., Ireland, A., Moss, C., Edwards, M. H., Dennison, E. M., Gaysin, T., et al. (2016) · Osteoporosis International · doi:10.1007/s00198-016-3810-5 · Cited by 37
Self-citationKemmler, W., Engelke, K., & von Stengel, S. (2016) · Journal of Bone and Mineral Research · doi:10.1002/jbmr.2608 · Cited by 35
Bone Density, Structure and Strength, and Their Determinants in Aging Sprint Athletes
KORHONEN, M. T., HEINONEN, A., SIEKKINEN, J., ISOLEHTO, J., ALÉN, M., KIVIRANTA, I., & SUOMINEN, H. (2012) · Medicine & Science in Sports & Exercise · doi:10.1249/mss.0b013e318267c954 · Cited by 32
Bone mineral density and bone turnover in male masters athletes aged 40–64
Nowak, A., Straburzyńska-Lupa, A., Kusy, K., Zieliński, J., Felsenberg, D., Rittweger, J., Karolkiewicz, J., Straburzyńska-Migaj, E., & Pilaczyńska-Szcześniak, Ł. (2010) · The Aging Male · doi:10.3109/13685531003657776 · Cited by 25
Hannam, K. J., Clark, E., Hartley, A., Sayer, A. A., Tobias, J. H., & Gregson, C. L. (2017) · Europe PMC (PubMed Central) · doi:10.25405/ncl.34315671 · Cited by 23
Self-citationBone density and neuromuscular function in older competitive athletes depend on running distance
Gast, U., Belavý, D. L., Armbrecht, G., Kusy, K., Lexy, H., Rawer, R., Rittweger, J., Winwood, K., Zieliński, J., & Felsenberg, D. (2013) · Osteoporosis International · doi:10.1007/s00198-012-2234-0 · Cited by 22
Disuse rescues the age-impaired adaptive response to external loading in mice
Meakin, L. B., Delisser, P. J., Galea, G. L., Lanyon, L. E., & Price, J. S. (2015) · Osteoporosis International · doi:10.1007/s00198-015-3142-x · Cited by 20
Elhakeem, A., Hannam, K., Deere, K. C., Hartley, A., Clark, E. M., Moss, C., Edwards, M. H., Dennison, E., Gaysin, T., Kuh, D., et al. (2018) · The Journals of Gerontology: Series A · doi:10.1093/gerona/glx176 · Cited by 14
Self-citationIreland, A., Degens, H., Ganse, B., Maden-Wilkinson, T. M., Wilks, D. C., & Rittweger, J. (2015) · Journal of Orthopaedic Translation · doi:10.1016/j.jot.2015.04.001 · Cited by 7
Self-citation(2011) · PubMed
Self-citation(2005) · PubMed
(2008) · PubMed
(2017) · Europe PMC (PubMed Central)
Self-citation
Research works printed but not linked: 1
- Hannam K, Deere KC, Hartley A, al-Sari UA, Clark EM, Fraser WD, Tobias JH (2017) Habitual levels of higher, but not medium or low, impact physical activity are positively related to lower limb bone strength in older women: findings from a population-based study using accelerometers to classify impact magnitude. Osteoporos Int 28(10):2813–2822 · DOI · Paper page
Cited by
Aging and Physiological Lessons from Master Athletes
Tanaka, H., Tarumi, T., & Rittweger, J. (2019) · Comprehensive physiology · doi:10.1002/cphy.c180041 · Cited by 88
Kort-Mascort, J., Flores-Torres, S., Peza-Chavez, O., Jang, J. H., Pardo, L. A., Tran, S. D., & Kinsella, J. M. (2022) · Biomaterials Science · doi:10.1039/d2bm01273a · Cited by 81
Hutson, M. J., O’Donnell, E., Brooke-Wavell, K., Sale, C., & Blagrove, R. C. (2021) · Sports Medicine · doi:10.1007/s40279-020-01396-4 · Cited by 64
Piasecki, M., Ireland, A., Piasecki, J., Degens, H., Stashuk, D. W., Swiecicka, A., Rutter, M. K., Jones, D. A., & McPhee, J. S. (2019) · Frontiers in Physiology · doi:10.3389/fphys.2019.00449 · Cited by 55
Self-citationPiasecki, J., Inns, T. B., Bass, J. J., Scott, R., Stashuk, D. W., Phillips, B. E., Atherton, P. J., & Piasecki, M. (2020) · The Journal of Physiology · doi:10.1113/jp280679 · Cited by 52
Self-citation
Metadata
- Authors
- Piasecki, J., McPhee, J. S., Hannam, K., Deere, K. C., Elhakeem, A., Piasecki, M., Degens, H., Tobias, J. H., & Ireland, A.
- Affiliations
- Nottingham Trent University (GB)
- Manchester Metropolitan University (GB)
- University of Bristol (GB)
- University of Nottingham (GB)
- Corresponding author
- McPhee, J. S.
- ORCID
- Venue
- Archives of Osteoporosis
- Published
- 2018-07-03
- Volume
- 13
- Issue
- 1
- Pages
- 72-72
- ISSN
- 1862-3522 (ISSN-L)
- 1862-3514
- PMC
- PMC6028830
- OpenAlex
- W2809881194
- Cited by
- 50
- References
- 39
- Citations by year
- 2025: 6 · 2024: 11 · 2023: 5 · 2022: 4 · 2021: 7 · 2020: 7 · 2019: 9
- FWCI
- 6.13
- Type
- journal article
- Language
- en
- Open access
- hybrid
- doi.org
- Licence
- cc-by
- creativecommons.org/licenses/by/4.0 (tdm)
- Locations
- Archives of Osteoporosis (publishedVersion, cc-by)
- Europe PMC (PubMed Central) (publishedVersion, cc-by)
- PubMed (publishedVersion)
- Repository@Nottingham (University of Nottingham) (publishedVersion, cc-by)
- PubMed Central (publishedVersion, cc-by)
- Bristol Research (University of Bristol) (publishedVersion, cc-by)
- Explore Bristol Research (publishedVersion, cc-by)
- Nottingham Trent University's Institutional Repository (Nottingham Trent Repository) (acceptedVersion)
- e-space (Manchester Metropolitan University) (submittedVersion)
- Repository@Nottingham (University of Nottingham) (submittedVersion, cc-by)
- Nottingham ePrints (University of Nottingham) (submittedVersion, cc-by)
- Funders
- Manchester Metropolitan University
- Topics
- Health Sciences › Medicine › Orthopedics and Sports Medicine › Bone health and osteoporosis research
- Physical Sciences › Engineering › Biomedical Engineering › Lower Extremity Biomechanics and Pathologies
- Health Sciences › Medicine › Orthopedics and Sports Medicine › Sports Performance and Training
- Keywords
- bone mineral density, endurance runners, older athletes, hip bone density, spine bone density, jump power, body composition, sex differences, osteoporosis prevention, skeletal health
- MeSH terms
- Endurance Training, Aged, Analysis of Variance, Body Composition, Female, Humans, Male, Pelvic Bones, Physical Endurance, Running, Spine, Cohort Studies, Absorptiometry, Photon, Bone Density
About these checks
Registry, retraction, Cites and statistics results are computed, not judged, with one exception: a printed reference that no index lists is read once by a model before it counts as a citation error. Claims are extracted by a model and kept only when their quote appears verbatim in the text; each cited source is then checked, with a model’s help, for whether it says what the claim relies on. Those verdicts can be wrong — read the claim’s quote and the cited source before relying on one.
A language model drew the claims from the paper on 2026-11-14, under version 3 of the claim definition (model deepseek-v4.1-flash, prompt extract-v3).
A second model labelled each claim on 2026-11-14 (model jev-1.13-20260917, definition revision gold-guideline-v0.2).
Statistics and arithmetic are recomputed, not judged.
Confidence bands are shown only for fields calibrated on our annotated test set. None is calibrated yet, so no band is shown.
What counts as a claim ›How we measure confidence ›How we check this ›
Are you an author, or do you see a problem with this page? Request a review
Data sources
Bibliographic data: Semantic Scholar, OpenAlex, Crossref.
Contains information from the Semantic Scholar Academic Graph Datasets, made available under the ODC Attribution License (ODC-BY 1.0).
Semantic Scholar’s data is described in: Kinney, R., et al. (2023). The Semantic Scholar Open Data Platform. arXiv:2301.10140.
