Student or educator? Sign up with your school email and get 6 months of Pro free.
Cited by 47

The DOI matches its Crossref record; 32 of the 32 references it cites were found in a registry or an index.

Altered Extracellular Vesicle MicroRNA Expression in Ischemic Stroke and Small Vessel Disease.

van Kralingen, Josie C., McFall, Aisling, Ord, Emily N. J., Coyle, Thomas F., Bissett, Maria, McClure, John D., McCabe, Christopher, Macrae, I. Mhairi, Dawson, Jesse, Work, Lorraine M.·2019·Translational Stroke Research

Abstract

Active transport of microRNAs (miRNA) in extracellular vesicles (EV) occurs in disease. Circulating EV-packaged miRNAs in the serum of stroke patients were compared to stroke mimics with matched cardio- and cerebrovascular risk factors, with corroboration of results in a pre-clinical model. An unbiased miRNA microarray was performed in stroke vs. stroke mimic patients (n = 39). Results were validated (n = 173 patients) by real-time quantitative polymerase chain reaction. miRNA expression was quantified in total serum/EV (n = 5-7) of naïve adult spontaneously hypertensive stroke-prone rats (SHRSP), their normotensive reference strain (Wistar Kyoto, WKY) and in circulating EV (n = 3), peri-infarct brain (n = 6), or EV derived from this region (n = 3) in SHRSP following transient middle cerebral artery occlusion (tMCAO). Circulating EV concentration did not differ between stroke and stroke mimic patients. The microarray identified many altered EV-packaged miRNAs: levels of miRNA-17-5p, -20b-5p and -93-5p (miRNA-17 family members) and miRNA-27b-3p were significantly (p ≤ 0.05) increased in stroke vs. stroke mimic patients. Patients with small vessel disease (SVD) consistently had the highest miRNA levels. Circulating EV concentration was unaltered between naïve SHRSP and WKY but levels of miRNA-17-5p and -93-5p were significantly increased in SHRSP. tMCAO in SHRSP did not further alter circulating EV miRNA-17 family member expression and nor did it change total miRNA-17 family levels in peri-infarct brain tissue or in EV isolated from this region at 24 h post-tMCAO. Changes in EV packaged miRNA expression was validated in patients with stroke, particularly those with SVD and corroborated pre-clinically. Together, altered circulating EV levels of miRNA-17 family members may reflect the chronic sequelae underlying cerebrovascular SVD rather than the acute ischemic stroke itself.

Overview

The claims and statistics of this paper haven’t been checked yet.

Run the check — free, no account needed. It reads the open-access text and checks the sources it cites.

A few free checks a day · papers already verified open instantly · results are public

Integrity signals

Registry

Crossref · 10.1007/s12975-018-0682-3

Cites

32 of 32 references verified0 citation errors · 0 not checkable

Statistics

Figures

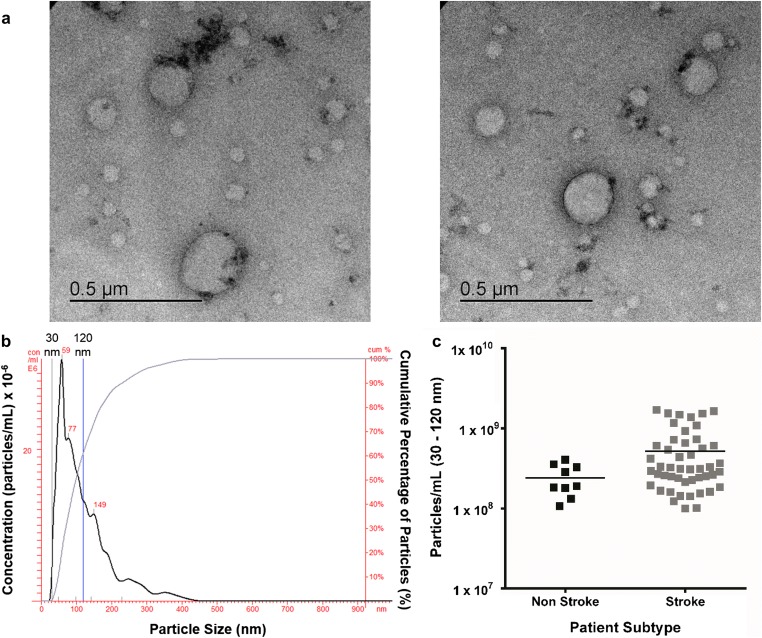
Fig. 1 Extracellular vesicle visualisation and quantification. a TEM observation of whole-mounted EV purified from human serum by precipitation. b NanoSight trace for representative sample is shown. Black trace indicates EV concentration with increasing particle size, and blue trace shows cumulative percentage of EV with increasing particle size. c Concentration of EV (30–120 nm) in stroke (n = 48) and non-stroke (n = 9) patients. Horizontal bar represents mean. Unpaired two-tailed Student’s t test assessed statistical significance
Fig. 1 Extracellular vesicle visualisation and quantification. a TEM observation of whole-mounted EV purified from human serum by precipitation. b NanoSight trace for representative sample is shown. Black trace indicates EV concentration with increasing particle size, and blue trace shows cumulative percentage of EV with increasing particle size. c Concentration of EV (30–120 nm) in stroke (n = 48) and non-stroke (n = 9) patients. Horizontal bar represents mean. Unpaired two-tailed Student’s t test assessed statistical significanceCC BY · PubMed Central
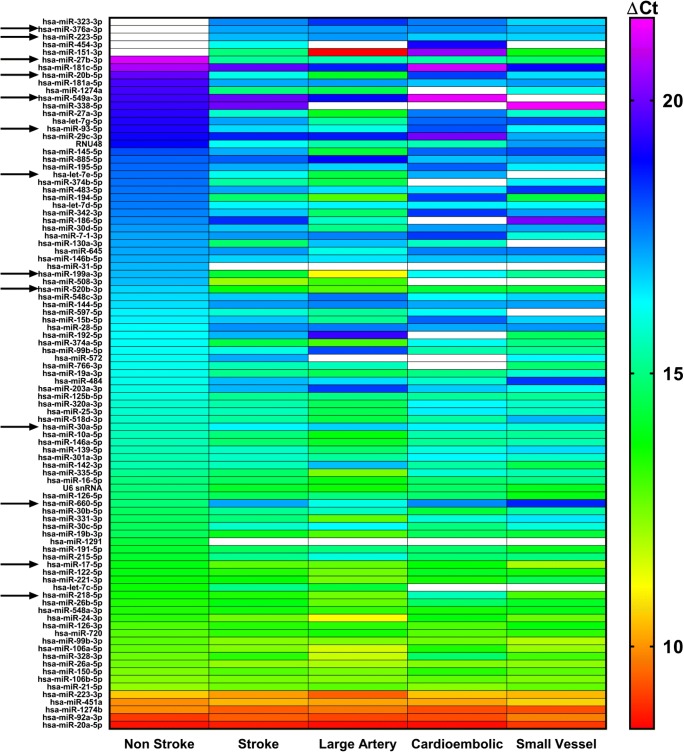
Fig. 2 EV Expression of miRNAs Altered in Stroke Patients (OpenArray™). miRNA expression in EV from serum of control non-stroke patients (n = 10), all stroke patients (n = 29) and stroke patients separated by TOAST subtype: large artery (n = 9), cardioembolic (n = 10) and SVD (n = 10) stroke patients. Changes in EV miRNA expression were assessed by OpenArray™, data shown are average ΔCt values following normalisation to spike housekeeper, ath-miR-159a. Arrows indicate miRNAs taken forward for further investigation
Fig. 2 EV Expression of miRNAs Altered in Stroke Patients (OpenArray™). miRNA expression in EV from serum of control non-stroke patients (n = 10), all stroke patients (n = 29) and stroke patients separated by TOAST subtype: large artery (n = 9), cardioembolic (n = 10) and SVD (n = 10) stroke patients. Changes in EV miRNA expression were assessed by OpenArray™, data shown are average ΔCt values following normalisation to spike housekeeper, ath-miR-159a. Arrows indicate miRNAs taken forward for further investigationCC BY · PubMed Central
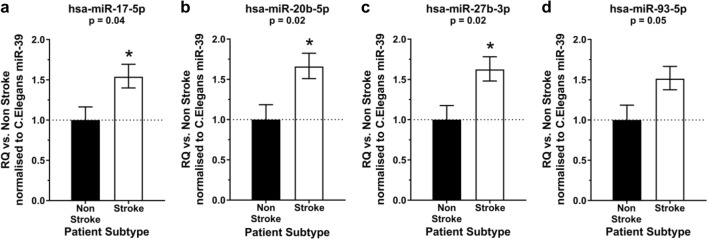
Fig. 3 Expression of miRNAs in EV from stroke patients. The expression of hsa-miR-17-5p (a), hsa-miR-20b-5p (b), hsa-miR-27b-3p (c) and hsa-miR-93-5p (d) was profiled in EV isolated from stroke patients (n = 139) and compared to expression in non-stroke patients (n = 34). Change in miRNA expression was assessed at 48 h post-stroke by qRT-PCR and RQ calculated from ΔΔCt following normalisation to a spike housekeeper miRNA, cel-miR-39, and compared to the control, non-stroke patients. Data are presented as RQ ± RQmax/RQmin. Probability values were calculated using unpaired Student’s t test vs. non-stroke control patients, *p < 0.05.
Fig. 3 Expression of miRNAs in EV from stroke patients. The expression of hsa-miR-17-5p (a), hsa-miR-20b-5p (b), hsa-miR-27b-3p (c) and hsa-miR-93-5p (d) was profiled in EV isolated from stroke patients (n = 139) and compared to expression in non-stroke patients (n = 34). Change in miRNA expression was assessed at 48 h post-stroke by qRT-PCR and RQ calculated from ΔΔCt following normalisation to a spike housekeeper miRNA, cel-miR-39, and compared to the control, non-stroke patients. Data are presented as RQ ± RQmax/RQmin. Probability values were calculated using unpaired Student’s t test vs. non-stroke control patients, *p < 0.05.CC BY · PubMed Central
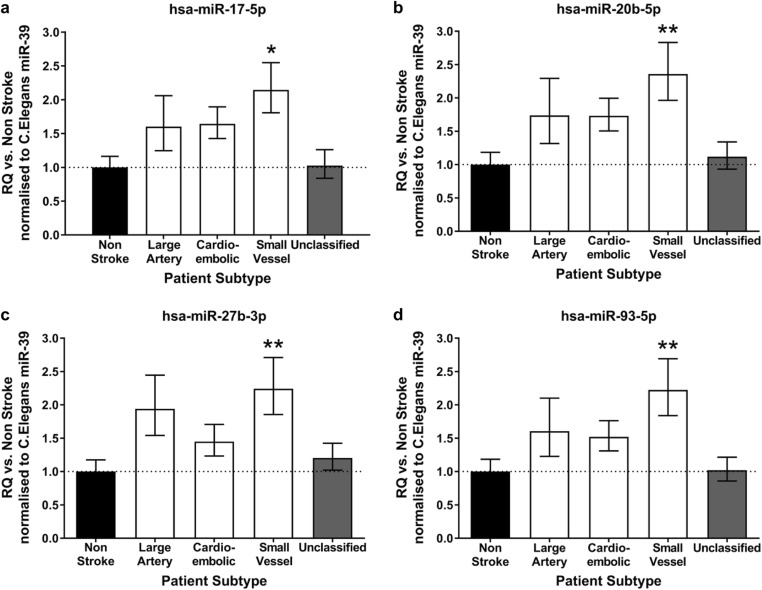
Fig. 4 EV miR-17 family expression altered by stroke subtype. EV expression of hsa-miR-17-5p (a), hsa-miR-20b-5p (b), hsa-miR-27b-3p (c) and hsa-miR-93-5p (d) was profiled in all stroke patients (n = 139) of which there were large artery (n = 22), cardioembolic (n = 40), SVD (n = 37) and unclassified (n = 40). Expression was compared to that of control, non-stroke patients (n = 34). Change in miRNA expression was assessed at 48 h post-stroke by qRT-PCR and RQ calculated from ΔΔCt following normalisation to a spike housekeeper miRNA, cel-miR-39 and compared to non-stroke control patients. Data are presented as RQ ± RQmax/RQmin. Probability values were calculated using one-way-ANOVA with post hoc Dunnett’s test, *p < 0.05; **p < 0.01
Fig. 4 EV miR-17 family expression altered by stroke subtype. EV expression of hsa-miR-17-5p (a), hsa-miR-20b-5p (b), hsa-miR-27b-3p (c) and hsa-miR-93-5p (d) was profiled in all stroke patients (n = 139) of which there were large artery (n = 22), cardioembolic (n = 40), SVD (n = 37) and unclassified (n = 40). Expression was compared to that of control, non-stroke patients (n = 34). Change in miRNA expression was assessed at 48 h post-stroke by qRT-PCR and RQ calculated from ΔΔCt following normalisation to a spike housekeeper miRNA, cel-miR-39 and compared to non-stroke control patients. Data are presented as RQ ± RQmax/RQmin. Probability values were calculated using one-way-ANOVA with post hoc Dunnett’s test, *p < 0.05; **p < 0.01CC BY · PubMed Central
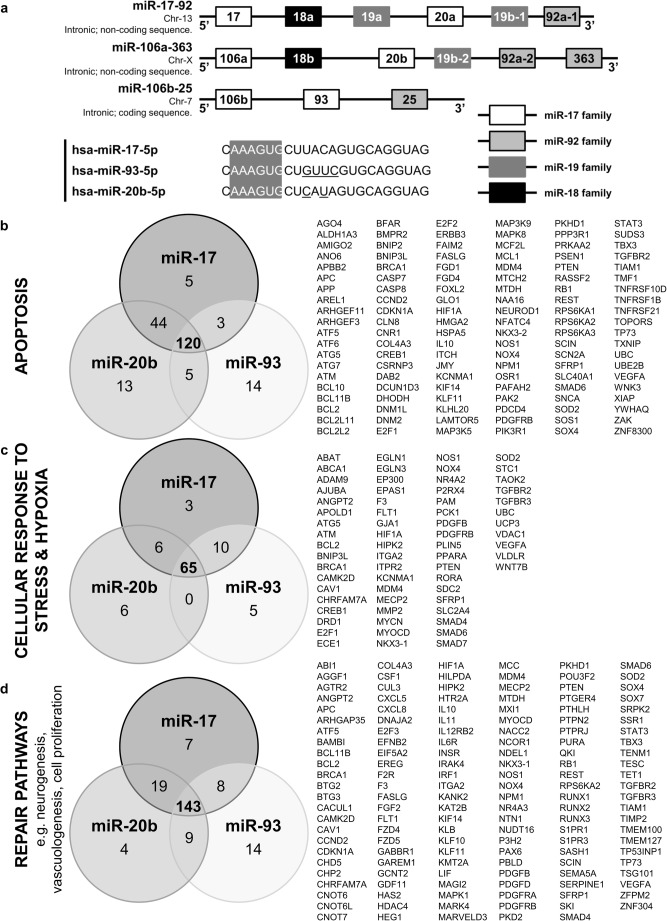
Fig. 5 MiR-17 family miRNAs and targets. a Schematic representing three polycistronic miRNA clusters: miR-17-92, miR-106a-363 and miR-106b-25. The miRNAs in each cluster have been colour coded to represent which miRNA family (grouped according to seed sequence) each miRNA belongs to. The full miRNA structures for miRNAs -17-5p, -93-5p and -20b-5p have been given and the seed sequence (nucleotides 2–7) for each highlighted. miRNA targets were primarily selected on the basis of their complementarity to the seed sequence of any miRNA. The number of predicted targets involved in apoptotic pathways (b), cellular response to stress and hypoxia pathways (c) and repair pathways, including neurogenesis and vasculogenesis (d) have been summarised for each miRNA in the miR-17 family in Venn diagram form. The list of gene targets summarises those targets that all 3 miRNAs have in common
Fig. 5 MiR-17 family miRNAs and targets. a Schematic representing three polycistronic miRNA clusters: miR-17-92, miR-106a-363 and miR-106b-25. The miRNAs in each cluster have been colour coded to represent which miRNA family (grouped according to seed sequence) each miRNA belongs to. The full miRNA structures for miRNAs -17-5p, -93-5p and -20b-5p have been given and the seed sequence (nucleotides 2–7) for each highlighted. miRNA targets were primarily selected on the basis of their complementarity to the seed sequence of any miRNA. The number of predicted targets involved in apoptotic pathways (b), cellular response to stress and hypoxia pathways (c) and repair pathways, including neurogenesis and vasculogenesis (d) have been summarised for each miRNA in the miR-17 family in Venn diagram form. The list of gene targets summarises those targets that all 3 miRNAs have in commonCC BY · PubMed Central
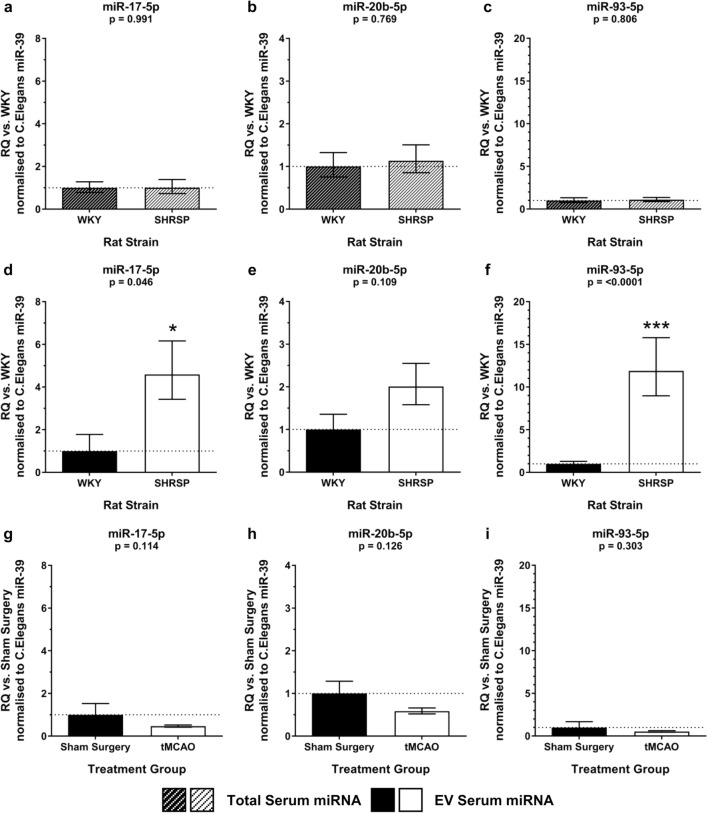
Fig. 6 Circulating miR-17 family expression in naïve and post-tMCAO rats. Total serum expression of miR-17-5p (a), miR-20b-5p (b) and miR-93-5p (c) was assessed in naïve normotensive WKY and hypertensive SHRSP rats (n = 5–7/group). EV miRNA expression of miR-17-5p (d), miR-20b-5p (e) and miR-93-5p (f) was assessed in naïve WKY and SHRSP rats (n = 5–7/group). EV expression of miR-17-5p (g), miR-20b-5p (h) and miR-93-5p (i) was assessed in serum of SHRSP rats at 24 h following tMCAO (n = 3) or sham surgery (n = 3). Change in miRNA expression was assessed by qRT-PCR and RQ calculated from ΔΔCt following normalisation to a spike housekeeper miRNA, cel-miR-39, and compared to control (WKY or sham surgery) rats. Data are presented as RQ ± RQmax/RQmin. Statistical probability of differences in expression observed were calculated using unpaired two-tailed Student’s t test vs. control rats: *p < 0.05; ***p < 0.001
Fig. 6 Circulating miR-17 family expression in naïve and post-tMCAO rats. Total serum expression of miR-17-5p (a), miR-20b-5p (b) and miR-93-5p (c) was assessed in naïve normotensive WKY and hypertensive SHRSP rats (n = 5–7/group). EV miRNA expression of miR-17-5p (d), miR-20b-5p (e) and miR-93-5p (f) was assessed in naïve WKY and SHRSP rats (n = 5–7/group). EV expression of miR-17-5p (g), miR-20b-5p (h) and miR-93-5p (i) was assessed in serum of SHRSP rats at 24 h following tMCAO (n = 3) or sham surgery (n = 3). Change in miRNA expression was assessed by qRT-PCR and RQ calculated from ΔΔCt following normalisation to a spike housekeeper miRNA, cel-miR-39, and compared to control (WKY or sham surgery) rats. Data are presented as RQ ± RQmax/RQmin. Statistical probability of differences in expression observed were calculated using unpaired two-tailed Student’s t test vs. control rats: *p < 0.05; ***p < 0.001CC BY · PubMed Central
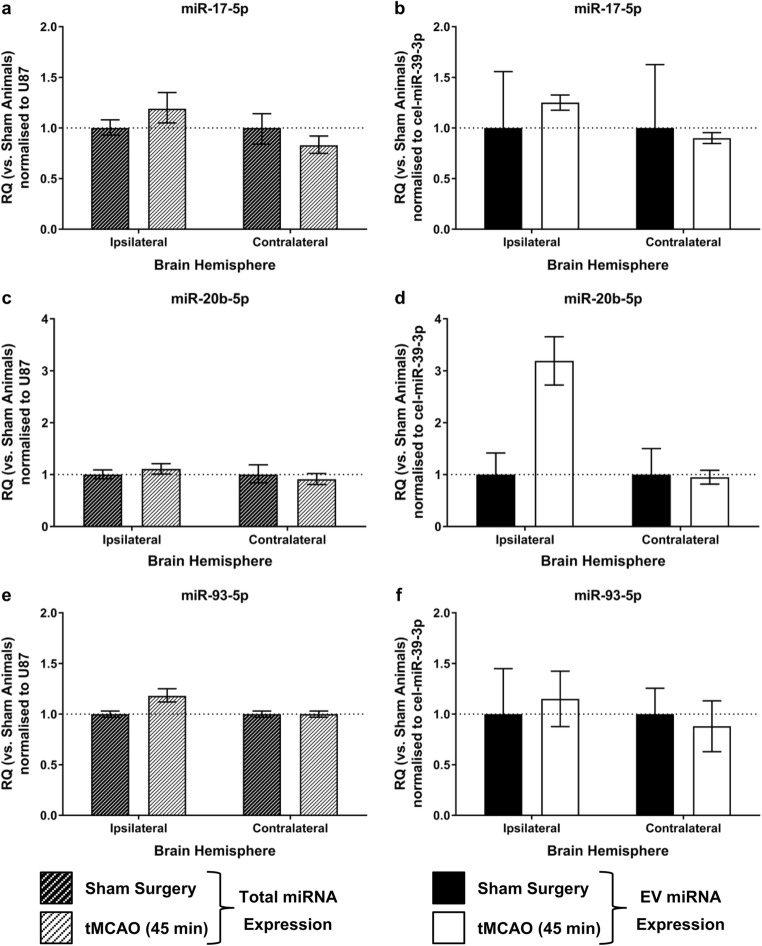
Fig. 7 MiR-17 family expression in SHRSP brain or brain-derived EV post-tMCAO. miRNA expression was determined a, c, e peri-infarct tissue of SHRSP rats 24 h post-tMCAO or sham surgery (n = 6/group) or b, d, f brain-derived EV from peri-infarct tissue of SHRSP rats 24 h post-tMCAO or sham surgery (n = 3/group) for miR-17-5p (a, b); miR-20b-5p (c, d) or miR-93-5p (e, f). Change in miRNA expression was assessed by qRT-PCR and RQ calculated from ΔΔCt following normalisation to a spike in housekeeper miRNA, cel-miR-39, and compared to sham operated SHRSP rats. Data are presented as RQ ± RQmax/RQmin. Statistical probability of differences in expression observed were calculated using unpaired two-tailed Student’s t test with Bonferroni’s multiple comparisons test vs. sham-operated rats
Fig. 7 MiR-17 family expression in SHRSP brain or brain-derived EV post-tMCAO. miRNA expression was determined a, c, e peri-infarct tissue of SHRSP rats 24 h post-tMCAO or sham surgery (n = 6/group) or b, d, f brain-derived EV from peri-infarct tissue of SHRSP rats 24 h post-tMCAO or sham surgery (n = 3/group) for miR-17-5p (a, b); miR-20b-5p (c, d) or miR-93-5p (e, f). Change in miRNA expression was assessed by qRT-PCR and RQ calculated from ΔΔCt following normalisation to a spike in housekeeper miRNA, cel-miR-39, and compared to sham operated SHRSP rats. Data are presented as RQ ± RQmax/RQmin. Statistical probability of differences in expression observed were calculated using unpaired two-tailed Student’s t test with Bonferroni’s multiple comparisons test vs. sham-operated ratsCC BY · PubMed Central

Verification

Claims the paper makes

The claims and statistics of this paper haven’t been checked yet.

Run the check — free, no account needed. It reads the open-access text and checks the sources it cites.

A few free checks a day · papers already verified open instantly · results are public

Claims other papers make about this one

Each is checked against this paper’s own text: does it say what the citing paper says it does?

Self-check

Percentages, sums and reported differences re-computed from the paper’s own numbers.

The self-check needs the paper’s full text.

Citations

Cites

Show all 32 references

Research works printed but not linked: 1

  1. Bailey EL, McCulloch J, Sudlow C, Wardlaw JM. Potential animal models of lacunar stroke. Stroke. 2009;40(6):e451–8.

Cited by

Metadata

Authors
van Kralingen, J. C., McFall, A., Ord, E. N. J., Coyle, T. F., Bissett, M., McClure, J. D., McCabe, C., Macrae, I. M., Dawson, J., & Work, L. M.
Venue
Translational Stroke Research
Published
2019-01-07
Volume
10
Issue
5
Pages
495-508
ISSN
  • 1868-4483
  • 1868-601X
Cited by
47
References
32
Language
en
Licence
creativecommons.org/licenses/by/4.0 (tdm)
Funders
  • British Heart Foundation (RE/13/5/30177, FS/15/64/32035)
  • Medical Research Council (MR/K500847/1, G1100562)
  • R.S. MacDonald Charitable Trust

About these checks

Registry, retraction, Cites and statistics results are computed, not judged, with one exception: a printed reference that no index lists is read once by a model before it counts as a citation error. Claims are extracted by a model and kept only when their quote appears verbatim in the text; each cited source is then checked, with a model’s help, for whether it says what the claim relies on. Those verdicts can be wrong — read the claim’s quote and the cited source before relying on one.

Statistics and arithmetic are recomputed, not judged.

Confidence bands are shown only for fields calibrated on our annotated test set. None is calibrated yet, so no band is shown.

What counts as a claim ›How we measure confidence ›How we check this ›

Are you an author, or do you see a problem with this page? Request a review

Data sources

Bibliographic data: Semantic Scholar, OpenAlex, Crossref.

Contains information from the Semantic Scholar Academic Graph Datasets, made available under the ODC Attribution License (ODC-BY 1.0).

Semantic Scholar’s data is described in: Kinney, R., et al. (2023). The Semantic Scholar Open Data Platform. arXiv:2301.10140.