

The DOI matches its Crossref record; 7 of the 7 references it cites were found in a registry or an index.
IL-23-induced macrophage polarization and its pathological roles in mice with imiquimod-induced psoriasis
Abstract
Macrophages acquire distinct phenotypes during tissue stress and inflammatory responses. Macrophages are roughly categorized into two different subsets named inflammatory M1 and anti-inflammatory M2 macrophages. We herein identified a unique pathogenic macrophage subpopulation driven by IL-23 with a distinct gene expression profile including defined types of cytokines. The freshly isolated resting mouse peritoneal macrophages were stimulated with different cytokines in vitro, the expression of cytokines and chemokines were detected by microarray, real-time PCR, ELISA and multiple colors flow cytometry. Adoptive transfer of macrophages and imiquimod-induced psoriasis mice were used. In contrast to M1- and M2-polarized macrophages, IL-23-treated macrophages produce large amounts of IL-17A, IL-22 and IFN-γ. Biochemical and molecular studies showed that IL-23 induces IL-17A expression in macrophages through the signal transducer and activator of transcription 3 (STAT3)-retinoid related orphan receptor-γ T (RORγT) pathway. T-bet mediates the IFN-γ production in IL-23-treated macrophages. Importantly, IL-23-treated macrophages significantly promote the dermatitis pathogenesis in a psoriasis-like mouse model. IL-23-treated resting macrophages express a distinctive gene expression prolife compared with M1 and M2 macrophages. The identification of IL-23-induced macrophage polarization may help us to understand the contribution of macrophage subpopulation in Th17-cytokines-related pathogenesis.
Overview
The claims and statistics of this paper haven’t been checked yet.
Run the check — free, no account needed. It reads the open-access text and checks the sources it cites.
Integrity signals
Registry
Cites
Statistics
Figures
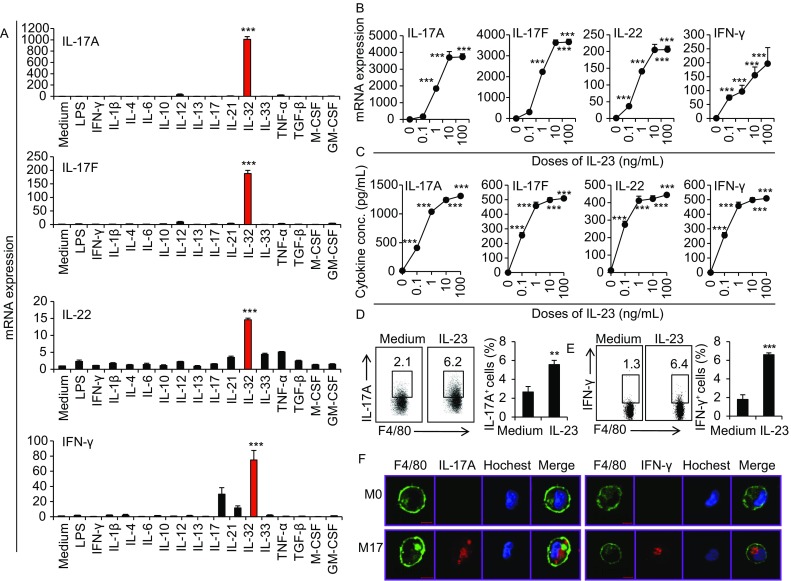
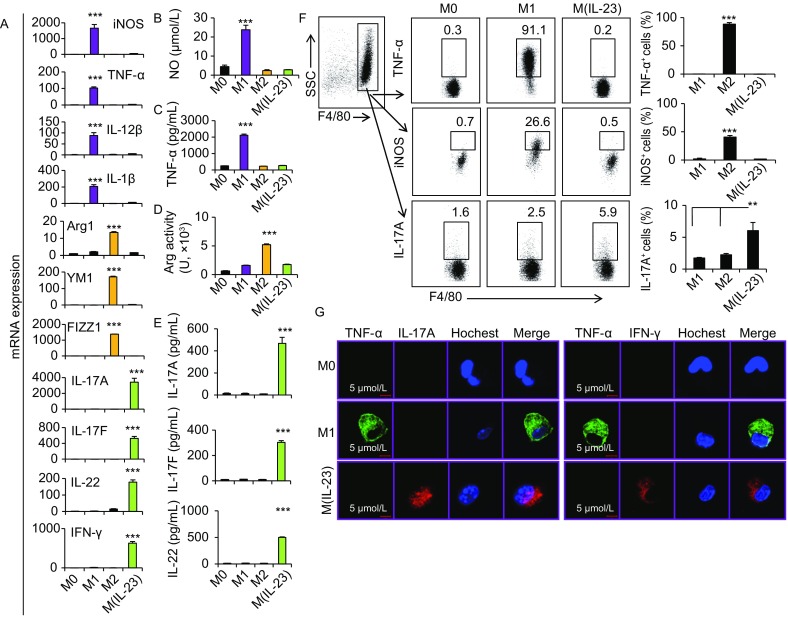
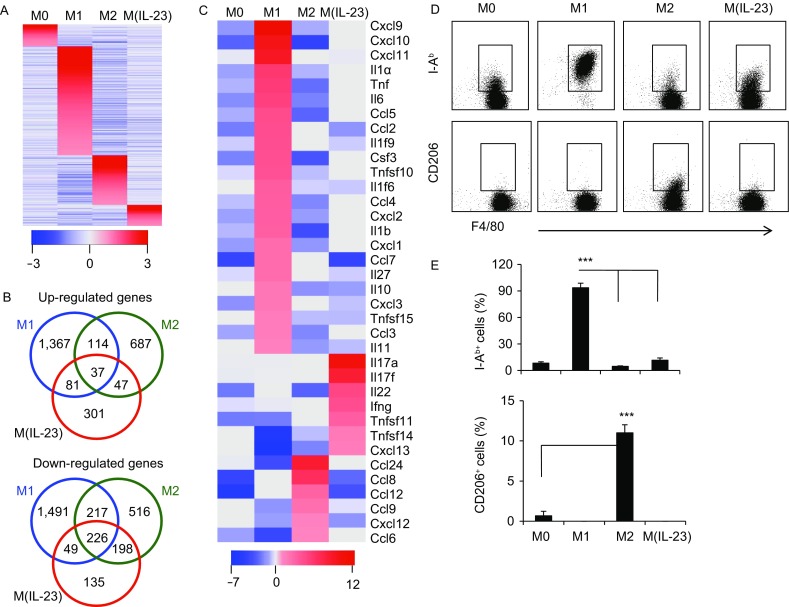
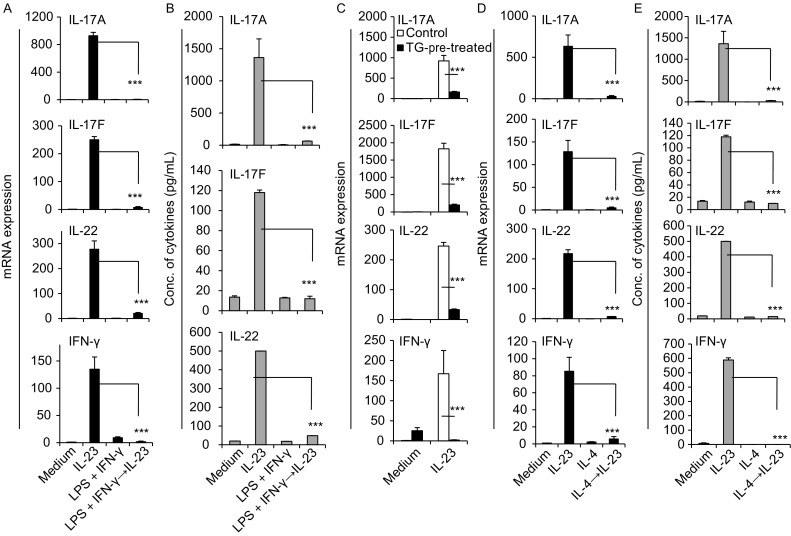
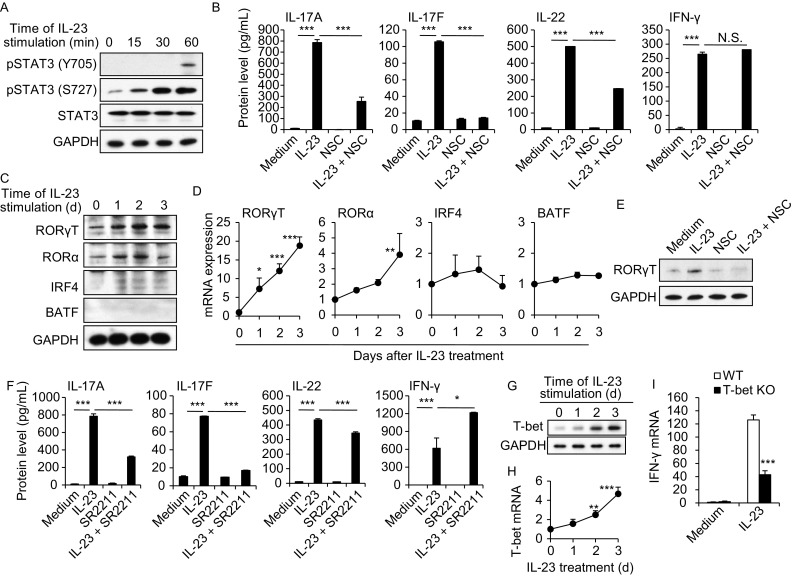
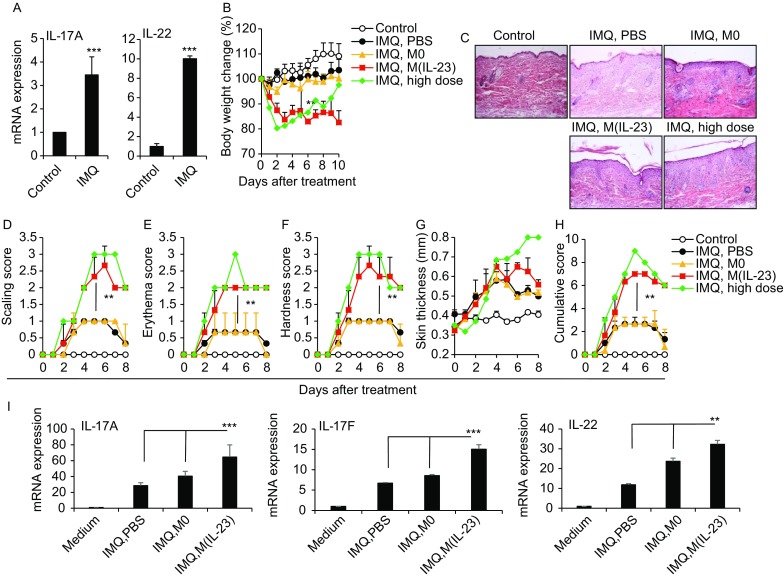
Verification
Claims the paper makes
The claims and statistics of this paper haven’t been checked yet.
Run the check — free, no account needed. It reads the open-access text and checks the sources it cites.
Claims other papers make about this one
Each is checked against this paper’s own text: does it say what the citing paper says it does?
The source backs part of the claim, not all of it — or backs it for a different population, condition or comparison.
In the citing paper
“The cytokines (e.g., IL-23, IL-6) secreted by macrophages, along with their antigen-presenting functions, can promote the differentiation and activation of T cells (e.g., Th1 and Th17 cells)48–50.”
From Macrophage INSIG1 deficiency drives psoriasiform dermatitis via the SREBP2-STAT1 axis (2026) · cites this paper as [49]
Experimental — accuracy not yet measured
Self-check
Percentages, sums and reported differences re-computed from the paper’s own numbers.
The self-check needs the paper’s full text.
Citations
Cites
Protective and pathogenic functions of macrophage subsets
Murray, P. J., & Wynn, T. A. (2011) · Nature Reviews Immunology · doi:10.1038/nri3073 · Cited by 5,269
A distinct lineage of CD4 T cells regulates tissue inflammation by producing interleukin 17
Park, H., Li, Z., Yang, X. O., Chang, S. H., Nurieva, R., Wang, Y.-H., Wang, Y., Hood, L., Zhu, Z., Tian, Q., et al. (2005) · Nature Immunology · doi:10.1038/ni1261 · Cited by 4,265
IL-23 drives a pathogenic T cell population that induces autoimmune inflammation
Langrish, C. L., Chen, Y., Blumenschein, W. M., Mattson, J., Basham, B., Sedgwick, J. D., McClanahan, T., Kastelein, R. A., & Cua, D. J. (2005) · The Journal of Experimental Medicine · doi:10.1084/jem.20041257 · Cited by 4,099
Cua, D. J., Sherlock, J., Chen, Y., Murphy, C. A., Joyce, B., Seymour, B., Lucian, L., To, W., Kwan, S., Churakova, T., et al. (2003) · Nature · doi:10.1038/nature01355 · Cited by 2,906
Transcriptome-Based Network Analysis Reveals a Spectrum Model of Human Macrophage Activation
Xue, J., Schmidt, S. V., Sander, J., Draffehn, A., Krebs, W., Quester, I., De Nardo, D., Gohel, T. D., Emde, M., Schmidleithner, L., et al. (2014) · Immunity · doi:10.1016/j.immuni.2014.01.006 · Cited by 2,210
Divergent Pro- and Antiinflammatory Roles for IL-23 and IL-12 in Joint Autoimmune Inflammation
Murphy, C. A., Langrish, C. L., Chen, Y., Blumenschein, W., McClanahan, T., Kastelein, R. A., Sedgwick, J. D., & Cua, D. J. (2003) · The Journal of Experimental Medicine · doi:10.1084/jem.20030896 · Cited by 1,669
Codarri, L., Gyülvészi, G., Tosevski, V., Hesske, L., Fontana, A., Magnenat, L., Suter, T., & Becher, B. (2011) · Nature Immunology · doi:10.1038/ni.2027 · Cited by 1,191 · cited 1×
“This article is an open access publication P ro te in & C e ll Il23r and Rorc (encoding RORγ), establishing a positive feedback loop and stabilizing expression of genes encoding pro-inflammatory effector molecules including Il17a, Il17f, Il22 and Csf2 (Parham et al., 2002; Codarri et al., 2011).”
Background
Research works printed but not linked: 38
- Awasthi, 2009, Cutting edge: IL-23 receptor gfp reporter mice reveal distinct populations of IL-17-producing cells, J Immunol, 182, 5904, 10.4049/jimmunol.0900732 · DOI
- Aychek, 2015, IL-23-mediated mononuclear phagocyte crosstalk protects mice from Citrobacter rodentium-induced colon immunopathology, Nat Commun, 6, 6525, 10.1038/ncomms7525 · DOI
- Cella, 2009, A human natural killer cell subset provides an innate source of IL-22 for mucosal immunity, Nature, 457, 722, 10.1038/nature07537 · DOI
- Cho, 2006, STAT3 and NF-kappaB signal pathway is required for IL-23-mediated IL-17 production in spontaneous arthritis animal model IL-1 receptor antagonist-deficient mice, J Immunol, 176, 5652, 10.4049/jimmunol.176.9.5652 · DOI
- Chung, 2009, Critical regulation of early Th17 cell differentiation by interleukin-1 signaling, Immunity, 30, 576, 10.1016/j.immuni.2009.02.007 · DOI
- Ciofani, 2012, A validated regulatory network for Th17 cell specification, Cell, 151, 289, 10.1016/j.cell.2012.09.016 · DOI · Paper page
- Duerr, 2006, A genome-wide association study identifies IL23R as an inflammatory bowel disease gene, Science, 314, 1461, 10.1126/science.1135245 · DOI · Paper page
- Guo, 2012, Cytokine-induced cytokine production by conventional and innate lymphoid cells, Trends Immunol, 33, 598, 10.1016/j.it.2012.07.006 · DOI
- Hou, 2013, Lipopolysaccharide increases the incidence of collagen-induced arthritis in mice through induction of protease HTRA-1 expression, Arthritis Rheum, 65, 2835, 10.1002/art.38124 · DOI
- Hou, 2014, The inhibitory effect of IFN-gamma on protease HTRA1 expression in rheumatoid arthritis, J Immunol, 193, 130, 10.4049/jimmunol.1302700 · DOI
- Huber, 2008, IRF4 is essential for IL-21-mediated induction, amplification, and stabilization of the Th17 phenotype, Proc Natl Acad Sci U S A, 105, 20846, 10.1073/pnas.0809077106 · DOI
- Imai, 2015, Cutting Edge: PD-1 Regulates Imiquimod-Induced Psoriasiform Dermatitis through Inhibition of IL-17A Expression by Innate gammadelta-Low T Cells, J Immunol, 195, 421, 10.4049/jimmunol.1500448 · DOI
- Ishida, 2013, IL-23 protection against Plasmodium berghei infection in mice is partially dependent on IL-17 from macrophages, Eur J Immunol, 43, 2696, 10.1002/eji.201343493 · DOI
- Iwakura, 2006, The IL-23/IL-17 axis in inflammation, J Clin Invest, 116, 1218, 10.1172/JCI28508 · DOI
- Izcue, 2008, Interleukin-23 restrains regulatory T cell activity to drive T cell-dependent colitis, Immunity, 28, 559, 10.1016/j.immuni.2008.02.019 · DOI
- Kadi, 2013, Brief Report: The IL23R Nonsynonymous Polymorphism rs11209026 Is Associated With Radiographic Sacroiliitis in Spondyloarthritis, Arthritis Rheum, 65, 2655, 10.1002/art.38060 · DOI
- Kastelein, 2007, Discovery and biology of IL-23 and IL-27: related but functionally distinct regulators of inflammation, Annu Rev Immunol, 25, 221, 10.1146/annurev.immunol.22.012703.104758 · DOI
- Kumar, 2012, Identification of SR2211: a potent synthetic RORgamma-selective modulator, ACS Chem Biol, 7, 672, 10.1021/cb200496y · DOI
- Labonte, 2014, The role of macrophage polarization in infectious and inflammatory diseases, Mol Cells, 37, 275, 10.14348/molcells.2014.2374 · DOI
- Li, 2017, Characterization and biological significance of IL-23-induced neutrophil polarization, Cell Mol Immunol, 14, 1
- Lubberts, 2015, The IL-23-IL-17 axis in inflammatory arthritis, Nat Rev Rheumatol, 11, 415, 10.1038/nrrheum.2015.53 · DOI · Paper page
- McGeachy, 2009, The interleukin 23 receptor is essential for the terminal differentiation of interleukin 17-producing effector T helper cells in vivo, Nat Immunol, 10, 314, 10.1038/ni.1698 · DOI · Paper page
- Moutsopoulos, 2017, Interleukin-12 and Interleukin-23 Blockade in Leukocyte adhesion deficiency type 1, N Engl J Med, 376, 1141, 10.1056/NEJMoa1612197 · DOI
- Oppmann, 2000, Novel p19 protein engages IL-12p40 to form a cytokine, IL-23, with biological activities similar as well as distinct from IL-12, Immunity, 13, 715, 10.1016/S1074-7613(00)00070-4 · DOI
- Paget, 2012, Interleukin-22 is produced by invariant natural killer T lymphocytes during influenza A virus infection: potential role in protection against lung epithelial damages, J Biol Chem, 287, 8816, 10.1074/jbc.M111.304758 · DOI
- Parham, 2002, A receptor for the heterodimeric cytokine IL-23 is composed of IL-12Rbeta1 and a novel cytokine receptor subunit, IL-23R, J Immunol, 168, 5699, 10.4049/jimmunol.168.11.5699 · DOI
- Raices, 2008, A synergistic role for IL-1beta and TNFalpha in monocyte-derived IFNgamma inducing activity, Cytokine, 44, 234, 10.1016/j.cyto.2008.08.004 · DOI
- Remmers, 2010, Genome-wide association study identifies variants in the MHC class I, IL10, and IL23R-IL12RB2 regions associated with Behcet’s disease, Nat Genet, 42, 698, 10.1038/ng.625 · DOI
- Robinson, 2002, Further checkpoints in Th1 development, Immunity, 16, 755, 10.1016/S1074-7613(02)00331-X · DOI
- Song, 2008, IL-17-producing alveolar macrophages mediate allergic lung inflammation related to asthma, J Immunol, 181, 6117, 10.4049/jimmunol.181.9.6117 · DOI
- Sun, 2012, The phenotype and functional alterations of macrophages in mice with hyperglycemia for long term, J Cell Physiol, 227, 1670, 10.1002/jcp.22891 · DOI
- Teng, 2015, IL-12 and IL-23 cytokines: from discovery to targeted therapies for immune-mediated inflammatory diseases, Nat Med, 21, 719, 10.1038/nm.3895 · DOI
- Tonel, 2010, Cutting edge: A critical functional role for IL-23 in psoriasis, J Immunol, 185, 5688, 10.4049/jimmunol.1001538 · DOI
- van der Fits, 2009, Imiquimod-induced psoriasis-like skin inflammation in mice is mediated via the IL-23/IL-17 axis, J Immunol, 182, 5836, 10.4049/jimmunol.0802999 · DOI
- Weaver, 2013, The Th17 pathway and inflammatory diseases of the intestines, lungs, and skin, Annu Rev Pathol, 8, 477, 10.1146/annurev-pathol-011110-130318 · DOI · Paper page
- Wilson, 2007, Development, cytokine profile and function of human interleukin 17-producing helper T cells, Nat Immunol, 8, 950, 10.1038/ni1497 · DOI · Paper page
- Yang, 2016, TSC1 controls IL-1beta expression in macrophages via mTORC1-dependent C/EBPbeta pathway, Cell Mol Immunol, 13, 640, 10.1038/cmi.2015.43 · DOI
- Zhu, 2014, TSC1 controls macrophage polarization to prevent inflammatory disease, Nat Commun, 5, 4696, 10.1038/ncomms5696 · DOI
Cited by
Sorted by citations
Current Concepts of Psoriasis Immunopathogenesis
Vičić, M., Kaštelan, M., Brajac, I., Sotošek, V., & Massari, L. P. (2021) · International Journal of Molecular Sciences · doi:10.3390/ijms222111574 · Cited by 163
Macrophage INSIG1 deficiency drives psoriasiform dermatitis via the SREBP2-STAT1 axis
Li, X., Zang, Y., Li, X., Sheng, T., Liu, S., Chen, L., Xu, X., Wang, L., Long, R., Zhang, M., et al. (2026) · Nature Communications · doi:10.1038/s41467-026-73278-8 · Cited by 1
Metadata
- Authors
- Hou, Y., Zhu, L., Tian, H., Sun, H.-X., Wang, R., Zhang, L., & Zhao, Y.
- Affiliations
- State Key Laboratory of Membrane Biology, Institute of Zoology, Chinese Academy of Sciences, University of Chinese Academy of Sciences , 100101, Beijing , China
- Department of Oncology, The Affiliated Zhongshan Hospital of Dalian University , 116001, Dalian , China
- Key Laboratory of Human Diseases Comparative Medicine, Ministry of Health, Institute of Laboratory Animal Science, Chinese Academy of Medical Sciences and Peking Union Medical College , 100021, Beijing , China
- Venue
- Protein & Cell
- Publisher
- Oxford University Press (OUP)
- Published
- 2018-03-05
- Volume
- 9
- Issue
- 12
- Pages
- 1027-1038
- ISSN
- 1674-800X
- 1674-8018
- PMC
- PMC6251802
- Cited by
- 179
- References
- 7
- Language
- en
About these checks
Registry, retraction, Cites and statistics results are computed, not judged, with one exception: a printed reference that no index lists is read once by a model before it counts as a citation error. Claims are extracted by a model and kept only when their quote appears verbatim in the text; each cited source is then checked, with a model’s help, for whether it says what the claim relies on. Those verdicts can be wrong — read the claim’s quote and the cited source before relying on one.
Statistics and arithmetic are recomputed, not judged.
Confidence bands are shown only for fields calibrated on our annotated test set. None is calibrated yet, so no band is shown.
What counts as a claim ›How we measure confidence ›How we check this ›
Are you an author, or do you see a problem with this page? Request a review
