

The DOI matches its Crossref record; 53 of the 53 references it cites were found in a registry or an index.
Clinical Pharmacokinetics and Pharmacodynamics of Afatinib
Open accessAbstract
Afatinib is an oral, irreversible ErbB family blocker that covalently binds to the kinase domains of epidermal growth factor receptor (EGFR), human EGFRs (HER) 2, and HER4, resulting in irreversible inhibition of tyrosine kinase autophosphorylation. Studies in healthy volunteers and patients with advanced solid tumours have shown that once-daily afatinib has time-independent pharmacokinetic characteristics. Maximum plasma concentrations of afatinib are reached approximately 2-5 h after oral administration and thereafter decline, at least bi-exponentially. Food reduces total exposure to afatinib. Over the clinical dose range of 20-50 mg, afatinib exposure increases slightly more than dose proportional. Afatinib metabolism is minimal, with unchanged drug predominantly excreted in the faeces and approximately 5 % in urine. Apart from the parent drug afatinib, the major circulation species in human plasma are the covalently bound adducts to plasma protein. The effective elimination half-life is approximately 37 h, consistent with an accumulation of drug exposure by 2.5- to 3.4-fold based on area under the plasma concentration-time curve (AUC) after multiple dosing. The pharmacokinetic profile of afatinib is consistent across a range of patient populations. Age, ethnicity, smoking status and hepatic function had no influence on afatinib pharmacokinetics, while females and patients with low body weight had increased exposure to afatinib. Renal function is correlated with afatinib exposure, but, as for sex and body weight, the effect size for patients with severe renal impairment (approximately 50 % increase in AUC) is only mildly relative to the extent of unexplained interpatient variability in afatinib exposure. Afatinib has a low potential as a victim or perpetrator of drug-drug interactions, especially with cytochrome P450-modulating agents. However, concomitant treatment with potent inhibitors or inducers of the P-glycoprotein transporter can affect the pharmacokinetics of afatinib. At a dose of 50 mg, afatinib does not have proarrhythmic potential.
Overview
The claims and statistics of this paper haven’t been checked yet.
Run the check — free, no account needed. It reads the open-access text and checks the sources it cites.
Integrity signals
Registry
Cites
Statistics
Figures
Verification
Claims the paper makes
The claims and statistics of this paper haven’t been checked yet.
Run the check — free, no account needed. It reads the open-access text and checks the sources it cites.
Claims other papers make about this one
Each is checked against this paper’s own text: does it say what the citing paper says it does?
The source backs part of the claim, not all of it — or backs it for a different population, condition or comparison.
In the citing paper
“concomitant administration of ritonavir, a well-known, potent inhibitor of P-glycoprotein and BCRP (another ATP binding cassette drug transporter inhibitor) has shown no relevant impact on afatinib pharmacokinetics in healthy male adults.”
From Afatinib for the treatment of EGFR mutation-positive NSCLC: A review of clinical findings (2020) · cites this paper as [62]
Experimental — accuracy not yet measuredThe cited source says what the claim attributes to it.
In the citing paper
“Afatinib is highly soluble across the physiological pH range of 1–7.5 and is not expected to interact with acid-reducing agents.”
From Afatinib for the treatment of EGFR mutation-positive NSCLC: A review of clinical findings (2020) · cites this paper as [62]
The cited source says what the claim attributes to it.
In the citing paper
“Smoking status does not impact the pharmacokinetics of afatinib”
From Afatinib for the treatment of EGFR mutation-positive NSCLC: A review of clinical findings (2020) · cites this paper as [62]
The cited source says what the claim attributes to it.
In the citing paper
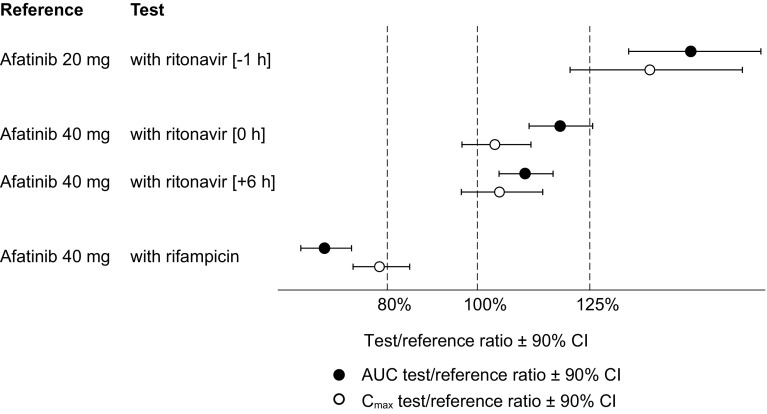
“P-glycoprotein inducers such as rifampicin can reduce afatinib exposure.”
From Afatinib for the treatment of EGFR mutation-positive NSCLC: A review of clinical findings (2020) · cites this paper as [62]
The cited source says what the claim attributes to it.
In the citing paper
“afatinib does not relevantly inhibit or induce CYP enzymes, including those involved in drug metabolism.62 Therefore, the risk of interactions between afatinib and co-administered drugs that undergo CYP enzyme metabolism is thought to be minimal.”
From Afatinib for the treatment of EGFR mutation-positive NSCLC: A review of clinical findings (2020) · cites this paper as [62]
The cited source says what the claim attributes to it.
In the citing paper
“Afatinib is a substrate and inhibitor of P-glycoprotein in vitro, and concomitant use of strong P-glycoprotein inhibitors can increase exposure to afatinib.”
From Afatinib for the treatment of EGFR mutation-positive NSCLC: A review of clinical findings (2020) · cites this paper as [62]
Self-check
Percentages, sums and reported differences re-computed from the paper’s own numbers.
The self-check needs the paper’s full text.
Citations
Cites
Gefitinib or Carboplatin–Paclitaxel in Pulmonary Adenocarcinoma
Mok, T. S., Wu, Y.-L., Thongprasert, S., Yang, C.-H., Chu, D.-T., Saijo, N., Sunpaweravong, P., Han, B., Margono, B., Ichinose, Y., et al. (2009) · New England Journal of Medicine · doi:10.1056/nejmoa0810699 · Cited by 8,261
Gefitinib or Chemotherapy for Non–Small-Cell Lung Cancer with Mutated EGFR
Maemondo, M., Inoue, A., Kobayashi, K., Sugawara, S., Oizumi, S., Isobe, H., Gemma, A., Harada, M., Yoshizawa, H., Kinoshita, I., et al. (2010) · New England Journal of Medicine · doi:10.1056/nejmoa0909530 · Cited by 5,525
Rosell, R., Carcereny, E., Gervais, R., Vergnenegre, A., Massuti, B., Felip, E., Palmero, R., Garcia-Gomez, R., Pallares, C., Sanchez, J. M., et al. (2012) · The Lancet Oncology · doi:10.1016/s1470-2045(11)70393-x · Cited by 5,489
Mitsudomi, T., Morita, S., Yatabe, Y., Negoro, S., Okamoto, I., Tsurutani, J., Seto, T., Satouchi, M., Tada, H., Hirashima, T., et al. (2010) · The Lancet Oncology · doi:10.1016/s1470-2045(09)70364-x · Cited by 4,090
Zhou, C., Wu, Y.-L., Chen, G., Feng, J., Liu, X.-Q., Wang, C., Zhang, S., Wang, J., Zhou, S., Ren, S., et al. (2011) · The Lancet Oncology · doi:10.1016/s1470-2045(11)70184-x · Cited by 4,081
Genotypic and Histological Evolution of Lung Cancers Acquiring Resistance to EGFR Inhibitors
Sequist, L. V., Waltman, B. A., Dias-Santagata, D., Digumarthy, S., Turke, A. B., Fidias, P., Bergethon, K., Shaw, A. T., Gettinger, S., Cosper, A. K., et al. (2011) · Science Translational Medicine · doi:10.1126/scitranslmed.3002003 · Cited by 3,499 · cited 14×
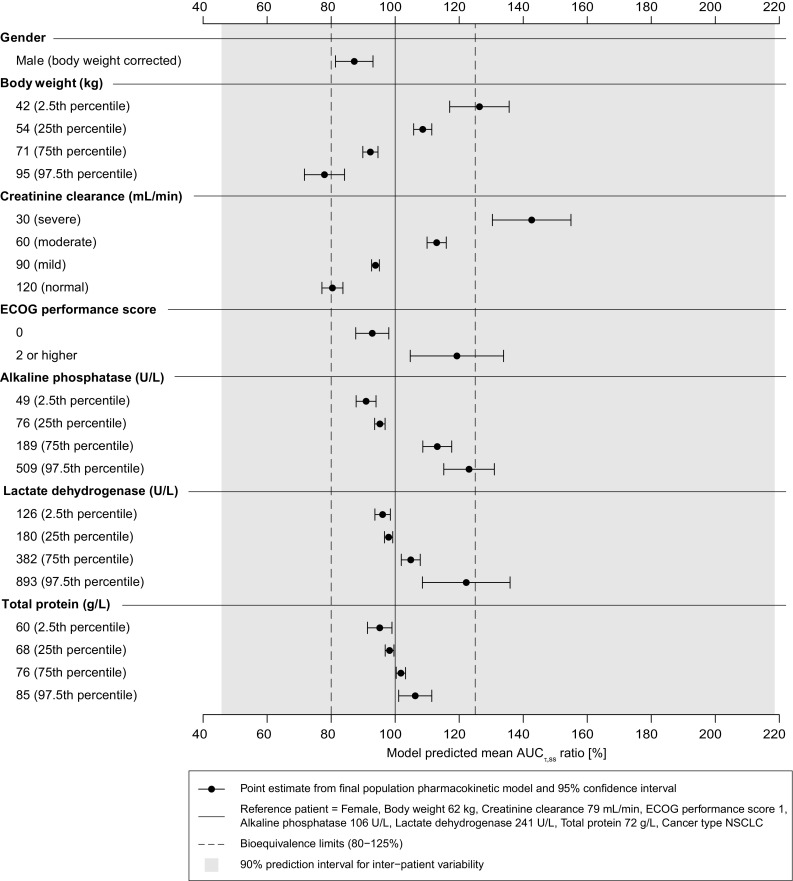
“AUCs area under the drug plasma concentration–time curve over a uniform dosing interval s, ECOG Eastern Cooperative Oncology Group, NSCLC non-small cell lung cancer.”
BackgroundInfluentialSequist, L. V., Yang, J. C.-H., Yamamoto, N., O'Byrne, K., Hirsh, V., Mok, T., Geater, S. L., Orlov, S., Tsai, C.-M., Boyer, M., et al. (2013) · Journal of Clinical Oncology · doi:10.1200/jco.2012.44.2806 · Cited by 3,228 · cited 21×
“A dose modification schedule based on tolerability was applied in the LUX-Lung 3 trial [19].”
BackgroundMethodResultInfluentialEpidermal growth factor receptor mutations in lung cancer
Sharma, S. V., Bell, D. W., Settleman, J., & Haber, D. A. (2007) · Nature Reviews Cancer · doi:10.1038/nrc2088 · Cited by 3,170 · cited 17×
“AUCs area under the drug plasma concentration–time curve over a uniform dosing interval s, ECOG Eastern Cooperative Oncology Group, NSCLC non-small cell lung cancer.”
BackgroundInfluentialYu, H. A., Arcila, M. E., Rekhtman, N., Sima, C. S., Zakowski, M. F., Pao, W., Kris, M. G., Miller, V. A., Ladanyi, M., & Riely, G. J. (2013) · Clinical Cancer Research · doi:10.1158/1078-0432.ccr-12-2246 · Cited by 2,454 · cited 14×
“AUCs area under the drug plasma concentration–time curve over a uniform dosing interval s, ECOG Eastern Cooperative Oncology Group, NSCLC non-small cell lung cancer.”
BackgroundInfluentialThe T790M mutation in EGFR kinase causes drug resistance by increasing the affinity for ATP
Yun, C.-H., Mengwasser, K. E., Toms, A. V., Woo, M. S., Greulich, H., Wong, K.-K., Meyerson, M., & Eck, M. J. (2008) · Proceedings of the National Academy of Sciences · doi:10.1073/pnas.0709662105 · Cited by 2,118
Cited by
Sorted by citations
Properties of FDA-approved small molecule protein kinase inhibitors
Roskoski, R. (2019) · Pharmacological Research · doi:10.1016/j.phrs.2019.03.006 · Cited by 554
Inhibition and induction of CYP enzymes in humans: an update
Hakkola, J., Hukkanen, J., Turpeinen, M., & Pelkonen, O. (2020) · Archives of Toxicology · doi:10.1007/s00204-020-02936-7 · Cited by 443
A comprehensive review of protein kinase inhibitors for cancer therapy
Kannaiyan, R., & Mahadevan, D. (2018) · Expert Review of Anticancer Therapy · doi:10.1080/14737140.2018.1527688 · Cited by 315
“The ORR was 2% in patients who had progressed on crizotinib only, 9% in patients who had progressed on crizotinib and chemotherapy, 17% in patients who had progressed on 2 ALK TKIs and chemotherapy, and 7% in patients who had progressed on 3 prior TKIs and chemotherapy [135].”
BackgroundInfluentialPractical Recommendations for Therapeutic Drug Monitoring of Kinase Inhibitors in Oncology
Verheijen, R. B., Yu, H., Schellens, J. H. M., Beijnen, J. H., Steeghs, N., & Huitema, A. D. R. (2017) · Clinical Pharmacology & Therapeutics · doi:10.1002/cpt.787 · Cited by 285
“6 ng/mL in those with only Grade 1–2 rash.(29) A consistent relationship between exposure and response has not been found yet for afatinib.”
Roles of Mitogen-Activated Protein Kinases in Osteoclast Biology
Lee, K., Seo, I., Choi, M. H., & Jeong, D. (2018) · International Journal of Molecular Sciences · doi:10.3390/ijms19103004 · Cited by 258
“The anti-tumor agent afatinib (an ATP-competitive 4-anilinoquinazoline derivative), an irreversible epidermal growth factor receptor tyrosine kinase inhibitor, has proven efficacious in phase III trials in patients with non-small cell lung cancer, which is known as the third most common cause of bone metastases [84].”
Background
Metadata
- Authors
- Wind, S., Schnell, D., Ebner, T., Freiwald, M., & Stopfer, P.
- Affiliations
- Boehringer Ingelheim (Germany) (DE)
- Corresponding author
- Wind, Sven
- Venue
- Clinical Pharmacokinetics
- Published
- 2016-07-28
- Volume
- 56
- Issue
- 3
- Pages
- 235-250
- ISSN
- 0312-5963 (ISSN-L)
- 1179-1926
- PMC
- PMC5315738
- OpenAlex
- W2484071785
- Cited by
- 206
- References
- 53
- Citations by year
- 2026: 14 · 2025: 23 · 2024: 21 · 2023: 28 · 2022: 35 · 2021: 18 · 2020: 24 · 2019: 15 · 2018: 17 · 2017: 9 · 2016: 1
- FWCI
- 1.41
- Type
- journal article
- Language
- en
- Open access
- hybrid
- doi.org
- Licence
- Locations
- Clinical Pharmacokinetics (publishedVersion, cc-by-nc)
- PubMed Central (publishedVersion, cc-by-nc)
- PubMed (publishedVersion)
- Funders
- Boehringer Ingelheim
- Topics
- Health Sciences › Medicine › Oncology › HER2/EGFR in Cancer Research
- Life Sciences › Pharmacology, Toxicology and Pharmaceutics › Pharmacology › Pharmacogenetics and Drug Metabolism
- Health Sciences › Medicine › Pulmonary and Respiratory Medicine › Lung Cancer Treatments and Mutations
- Keywords
- afatinib, EGFR, HER2, ErbB4, pharmacokinetics, pharmacodynamics, food effect, dose proportionality, renal dysfunction, P-glycoprotein, drug-drug interactions, covalent protein adducts, drug-induced arrhythmia, interindividual variability, advanced solid tumors
- MeSH terms
- Afatinib, Animals, Drug Interactions, Humans, Kidney, Liver, Neoplasms, Protein Binding, Quinazolines, Radiation-Sensitizing Agents, ATP Binding Cassette Transporter, Subfamily B, Member 1, Protein Kinase Inhibitors, ErbB Receptors
About these checks
Registry, retraction, Cites and statistics results are computed, not judged, with one exception: a printed reference that no index lists is read once by a model before it counts as a citation error. Claims are extracted by a model and kept only when their quote appears verbatim in the text; each cited source is then checked, with a model’s help, for whether it says what the claim relies on. Those verdicts can be wrong — read the claim’s quote and the cited source before relying on one.
Statistics and arithmetic are recomputed, not judged.
Confidence bands are shown only for fields calibrated on our annotated test set. None is calibrated yet, so no band is shown.
What counts as a claim ›How we measure confidence ›How we check this ›
Are you an author, or do you see a problem with this page? Request a review
