

The DOI matches its Crossref record; 77 of the 77 references it cites were found in a registry or an index.
Effect of Immobilisation on Neuromuscular Function In Vivo in Humans: A Systematic Review
Open accessAbstract
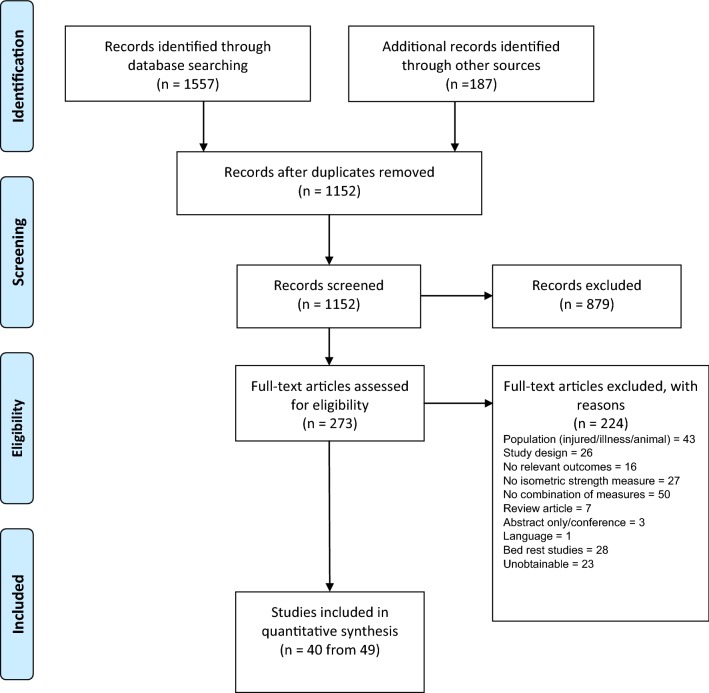
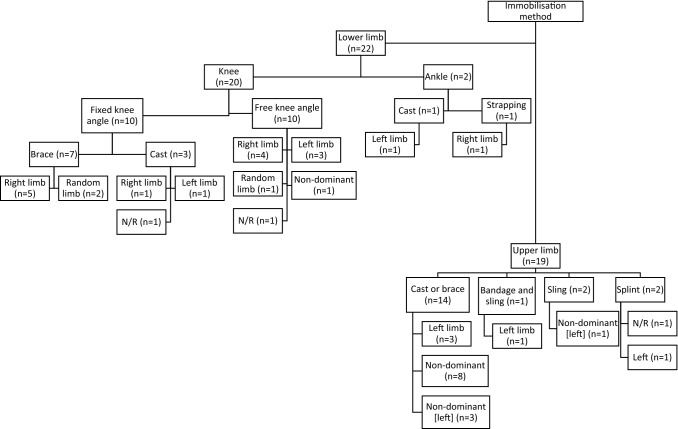
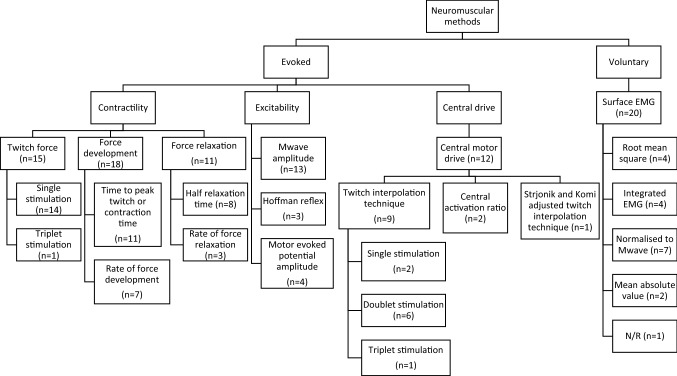
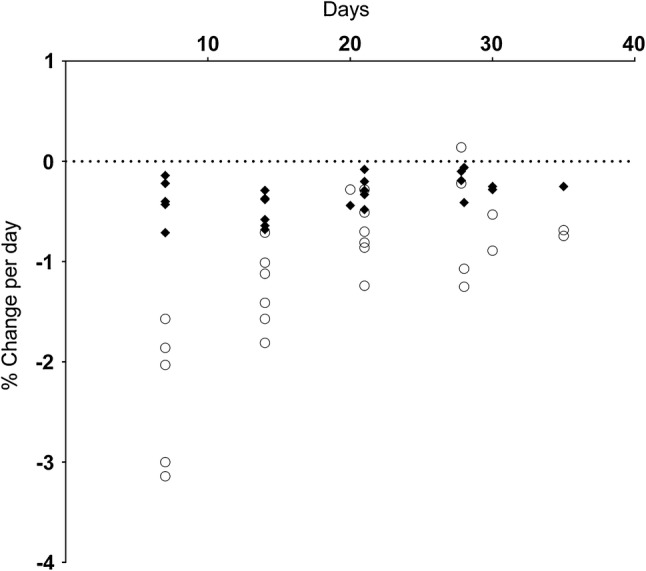
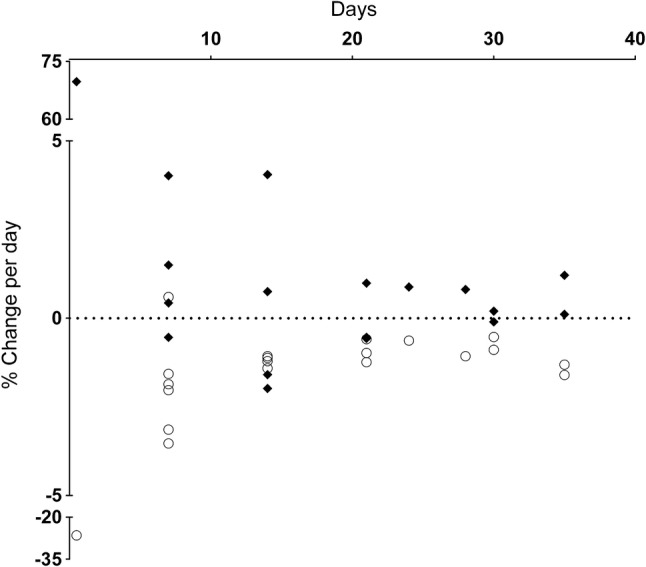
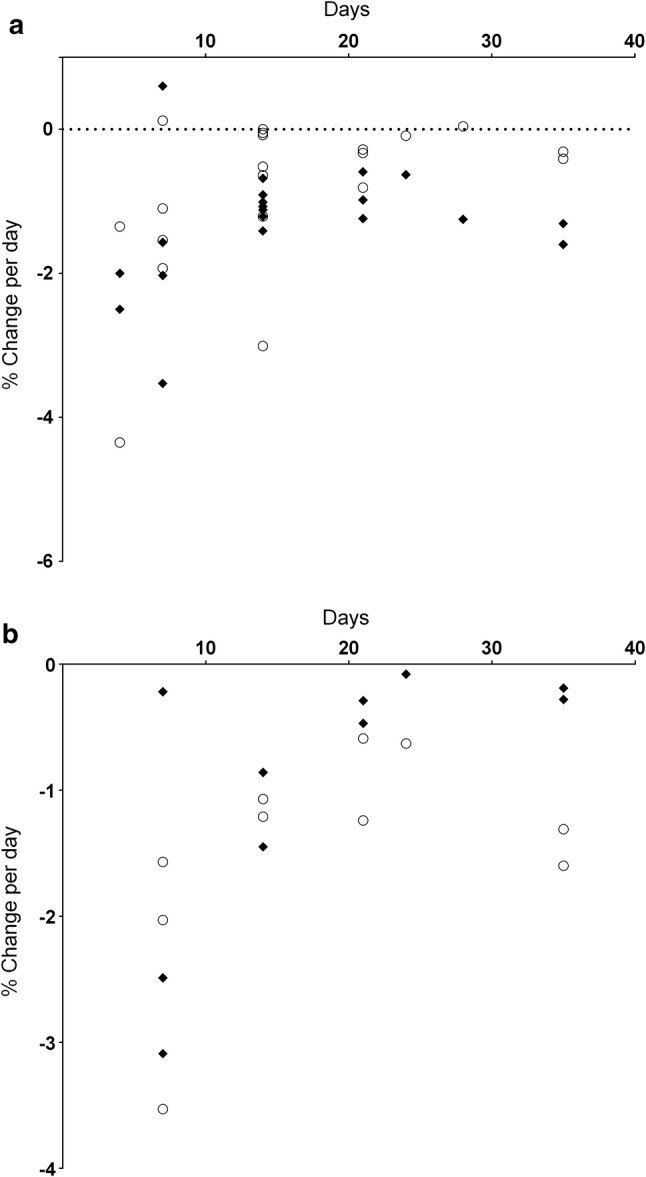
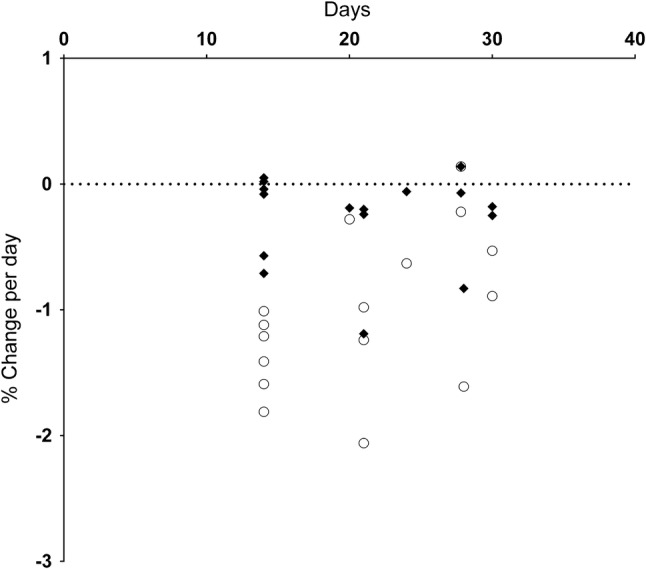
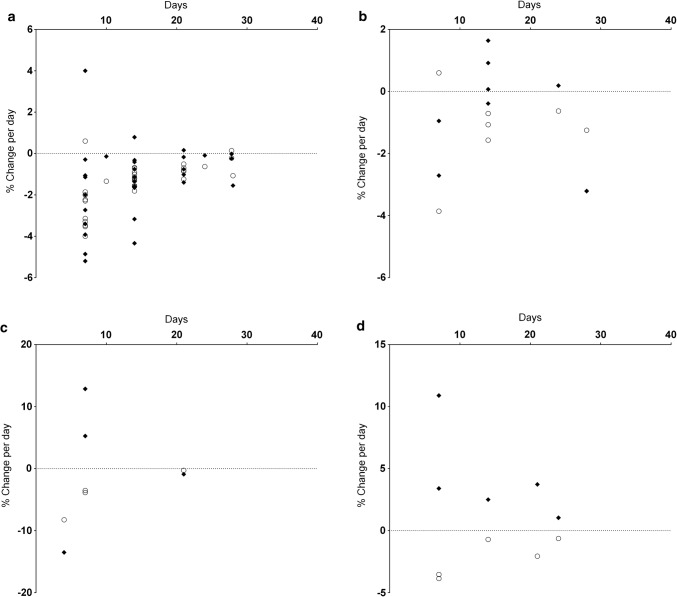
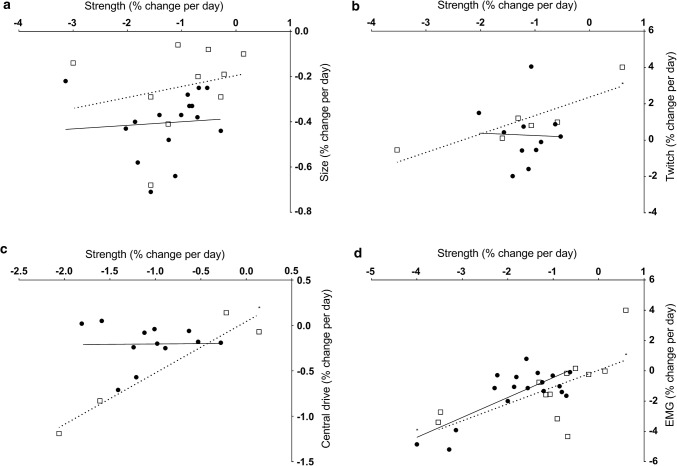
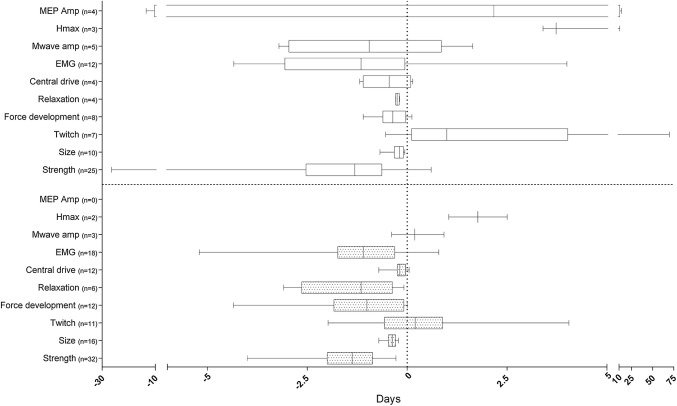
BACKGROUND: Muscle strength loss following immobilisation has been predominantly attributed to rapid muscle atrophy. However, this cannot fully explain the magnitude of muscle strength loss, so changes in neuromuscular function (NMF) may be involved. OBJECTIVES: We systematically reviewed literature that quantified changes in muscle strength, size and NMF following periods of limb immobilisation in vivo in humans. METHODS: Studies were identified following systematic searches, assessed for inclusion, data extracted and quality appraised by two reviewers. Data were tabulated and reported narratively. RESULTS: Forty eligible studies were included, 22 immobilised lower and 18 immobilised upper limbs. Limb immobilisation ranged from 12 h to 56 days. Isometric muscle strength and muscle size declined following immobilisation; however, change magnitude was greater for strength than size. Evoked resting twitch force decreased for lower but increased for upper limbs. Rate of force development either remained unchanged or slowed for lower and typically slowed for upper limbs. Twitch relaxation rate slowed for both lower and upper limbs. Central motor drive typically decreased for both locations, while electromyography amplitude during maximum voluntary contractions decreased for the lower and presented mixed findings for the upper limbs. Trends imply faster rates of NMF loss relative to size earlier in immobilisation periods for all outcomes. CONCLUSIONS: Limb immobilisation results in non-uniform loss of isometric muscle strength, size and NMF over time. Different outcomes between upper and lower limbs could be attributed to higher degrees of central neural control of upper limb musculature. Future research should focus on muscle function losses and mechanisms following acute immobilisation. REGISTRATION: PROSPERO reference: CRD42016033692.
Overview
The claims and statistics of this paper haven’t been checked yet.
Run the check — free, no account needed. It reads the open-access text and checks the sources it cites.
Integrity signals
Registry
Cites
Statistics
Figures
Verification
Claims the paper makes
The claims and statistics of this paper haven’t been checked yet.
Run the check — free, no account needed. It reads the open-access text and checks the sources it cites.
Claims other papers make about this one
Each is checked against this paper’s own text: does it say what the citing paper says it does?
The source backs part of the claim, not all of it — or backs it for a different population, condition or comparison.
In the citing paper
“These suggest a greater contribution of neuromuscular function loss to declines in strength in the initial period(s) of limb unloading, while changes in muscle size dominate in the later stages (68).”
From Nonuniform loss of muscle strength and atrophy during bed rest: a systematic review (2021) · cites this paper as [68]
Experimental — accuracy not yet measuredThe cited source says what the claim attributes to it.
In the citing paper
“Greatest rate of changes in muscle strength and size occurred in the earliest stages of disuse/mechanical unloading, as noted by others (68, 69).”
From Nonuniform loss of muscle strength and atrophy during bed rest: a systematic review (2021) · cites this paper as [68]
Self-check
Percentages, sums and reported differences re-computed from the paper’s own numbers.
The self-check needs the paper’s full text.
Citations
Cites
Preferred Reporting Items for Systematic Reviews and Meta-Analyses: the PRISMA statement
Moher, D., Liberati, A., Tetzlaff, J., Altman, D. G., & for the PRISMA Group (2009) · BMJ · doi:10.1136/bmj.b2535 · Cited by 83,823
Preferred Reporting Items for Systematic Reviews and Meta-Analyses: The PRISMA Statement
Moher, D., Liberati, A., Tetzlaff, J., Altman, D. G., & The PRISMA Group (2009) · PLoS Medicine · doi:10.1371/journal.pmed.1000097 · Cited by 64,042
Preferred reporting items for systematic reviews and meta-analyses: The PRISMA statement
Moher, D., Liberati, A., Tetzlaff, J., Altman, D. G., & the PRISMA Group* (2009) · Annals of Internal Medicine · doi:10.7326/0003-4819-151-4-200908180-00135 · Cited by 37,554
Wang, G., Ma, R., Qiao, G., Wada, K., Aizawa, Y., & Satoh, T. (2015) · Integrative Medicine International · doi:10.1159/000368408 · Cited by 18,657
Calcium's Role in Mechanotransduction during Muscle Development
Benavides Damm, T., & Egli, M. (2014) · Cellular Physiology and Biochemistry · doi:10.1159/000356667 · Cited by 14,502
Thomas, B. H., Ciliska, D., Dobbins, M., & Micucci, S. (2004) · Worldviews on Evidence-Based Nursing · doi:10.1111/j.1524-475x.2004.04006.x · Cited by 2,118
Skeletal muscle loss: cachexia, sarcopenia, and inactivity
Evans, W. J. (2010) · American Journal of Clinical Nutrition · doi:10.3945/ajcn.2010.28608a · Cited by 762
Stimulation of the human motor cortex through the scalp
Rothwell, J. C., Thompson, P. D., Day, B. L., Boyd, S. G., & MARSDEN, C. D. (1991) · Experimental Physiology · doi:10.1113/expphysiol.1991.sp003485 · Cited by 674
Physiological cross‐sectional area of human leg muscles based on magnetic resonance imaging
Fukunaga, T., Roy, R. R., Shellock, F. G., Hodgson, J. A., Day, M. K., Lee, P. L., Kwong-Fu, H. H., & Edgerton, V. R. (1992) · Journal of Orthopaedic Research® · doi:10.1002/jor.1100100623 · Cited by 531
Effects of aging on human skeletal muscle after immobilization and retraining
Suetta, C., Hvid, L. G., Justesen, L., Christensen, U., Neergaard, K., Simonsen, L., Ortenblad, N., Magnusson, S. P., Kjaer, M., & Aagaard, P. (2009) · Journal of Applied Physiology · doi:10.1152/japplphysiol.00290.2009 · Cited by 400
Cited by
Post-COVID-19 Fatigue: Potential Contributing Factors
Rudroff, T., Fietsam, A. C., Deters, J. R., Bryant, A., & Kamholz, J. A. (2020) · Brain Sciences · doi:10.3390/brainsci10121012 · Cited by 264
Nonuniform loss of muscle strength and atrophy during bed rest: a systematic review
Marusic, U., Narici, M., Simunic, B., Pisot, R., & Ritzmann, R. (2021) · Journal of Applied Physiology · doi:10.1152/japplphysiol.00363.2020 · Cited by 185
Kruse, A., Rivares, C., Weide, G., Tilp, M., & Jaspers, R. T. (2021) · Frontiers in Physiology · doi:10.3389/fphys.2021.742034 · Cited by 81
Centner, C., & Lauber, B. (2020) · Frontiers in Physiology · doi:10.3389/fphys.2020.00887 · Cited by 79
Metadata
- Authors
- Campbell, M., Varley-Campbell, J., Fulford, J., Taylor, B., Mileva, K. N., & Bowtell, J. L.
- Affiliations
- University of Exeter (GB)
- University of Leeds (GB)
- London South Bank University (GB)
- Corresponding author
- Campbell, Matthew
- Venue
- Sports Medicine
- Published
- 2019-03-21
- Volume
- 49
- Issue
- 6
- Pages
- 931-950
- ISSN
- 0112-1642 (ISSN-L)
- 1179-2035
- PMC
- PMC6548068
- OpenAlex
- W2923239346
- Cited by
- 94
- References
- 77
- Citations by year
- 2026: 11 · 2025: 20 · 2024: 16 · 2023: 9 · 2022: 12 · 2021: 9 · 2020: 17
- FWCI
- 0.84
- Type
- journal article
- Language
- en
- Update notices
- correction (2019-04-04)
- Open access
- hybrid
- doi.org
- Licence
- cc-by
- creativecommons.org/licenses/by/4.0 (tdm)
- Locations
- Sports Medicine (publishedVersion, cc-by)
- PubMed Central (publishedVersion, cc-by)
- PubMed (publishedVersion)
- Research Open (London South Bank University) (acceptedVersion)
- Research Open (London South Bank University) (acceptedVersion, cc-by)
- UCL Discovery (University College London) (submittedVersion)
- Open Research Exeter (University of Exeter) (submittedVersion, cc-by)
- Topics
- Life Sciences › Biochemistry, Genetics and Molecular Biology › Molecular Biology › Muscle Physiology and Disorders
- Health Sciences › Medicine › Physiology (medical) › Spaceflight effects on biology
- Physical Sciences › Engineering › Biomedical Engineering › Muscle activation and electromyography studies
- Keywords
- neuromuscular function, muscle strength decline, muscle atrophy, muscle size, rate of force development, upper limb, lower extremity, disuse
- MeSH terms
- Electromyography, Humans, Immobilization, Muscle Contraction, Muscular Atrophy, Organ Size, Reflex, Muscle, Skeletal, Evoked Potentials, Motor, Upper Extremity, Lower Extremity, Muscle Strength
About these checks
Registry, retraction, Cites and statistics results are computed, not judged, with one exception: a printed reference that no index lists is read once by a model before it counts as a citation error. Claims are extracted by a model and kept only when their quote appears verbatim in the text; each cited source is then checked, with a model’s help, for whether it says what the claim relies on. Those verdicts can be wrong — read the claim’s quote and the cited source before relying on one.
Statistics and arithmetic are recomputed, not judged.
Confidence bands are shown only for fields calibrated on our annotated test set. None is calibrated yet, so no band is shown.
What counts as a claim ›How we measure confidence ›How we check this ›
Are you an author, or do you see a problem with this page? Request a review
Data sources
Bibliographic data: Semantic Scholar, OpenAlex, Crossref.
Contains information from the Semantic Scholar Academic Graph Datasets, made available under the ODC Attribution License (ODC-BY 1.0).
Semantic Scholar’s data is described in: Kinney, R., et al. (2023). The Semantic Scholar Open Data Platform. arXiv:2301.10140.
