

The DOI matches its Crossref record; 65 of the 66 references it cites were found in a registry or an index; none of the 61 sources its claims cite is checked for support yet.
Convergence of Genes and Cellular Pathways Dysregulated in Autism Spectrum Disorders
Open accessAbstract
Rare copy-number variation (CNV) is an important source of risk for autism spectrum disorders (ASDs). We analyzed 2,446 ASD-affected families and confirmed an excess of genic deletions and duplications in affected versus control groups (1.41-fold, p = 1.0 × 10(-5)) and an increase in affected subjects carrying exonic pathogenic CNVs overlapping known loci associated with dominant or X-linked ASD and intellectual disability (odds ratio = 12.62, p = 2.7 × 10(-15), ∼3% of ASD subjects). Pathogenic CNVs, often showing variable expressivity, included rare de novo and inherited events at 36 loci, implicating ASD-associated genes (CHD2, HDAC4, and GDI1) previously linked to other neurodevelopmental disorders, as well as other genes such as SETD5, MIR137, and HDAC9. Consistent with hypothesized gender-specific modulators, females with ASD were more likely to have highly penetrant CNVs (p = 0.017) and were also overrepresented among subjects with fragile X syndrome protein targets (p = 0.02). Genes affected by de novo CNVs and/or loss-of-function single-nucleotide variants converged on networks related to neuronal signaling and development, synapse function, and chromatin regulation.
Overview
AI snapshot
Written from the paper’s full text.
TL;DR
This study analyzed rare copy-number variation (CNV) in 2,446 autism spectrum disorder (ASD)-affected families and 2,640 controls, confirming excess genic CNV burden and enrichment of pathogenic CNVs at ASD/intellectual disability loci. Genes affected by de novo CNVs and loss-of-function single-nucleotide variants converged on neuronal signaling, synapse, and chromatin-regulation networks.
Key findings
- Affected subjects showed a 1.41-fold increase in genes affected by rare CNVs versus controls (empirical p = 1 × 10⁻⁵). Pathogenic CNVs overlapping autosomal-dominant or X-linked ASD/ID genes and loci were found in 2.8% (60/2,147) of European-ancestry affected subjects (OR = 12.62, 95% CI = 5.44–29.27, p = 2.74 × 10⁻¹⁵); across all ancestries, pathogenic CNVs were identified in ∼3.3% (82/2,446).
- Among 2,096 trios, 102 rare de novo CNVs were found in 99 affected subjects, with 4.7% of trios having at least one de novo CNV. De novo events averaged 1.17 Mb versus 0.67 Mb in unaffected siblings (p = 0.01) and 0.55 Mb in control trios (p = 0.01), and affected 3.8-fold more genes than control de novo CNVs.
- Females were more likely to carry highly penetrant pathogenic CNVs (male-to-female ratio 2:1 versus 6:1 among all affected subjects; p = 0.017) and were overrepresented among subjects with exonic deletions overlapping FMRP targets (17 females in 73 affected subjects, 1.98-fold more than males, p = 0.022).
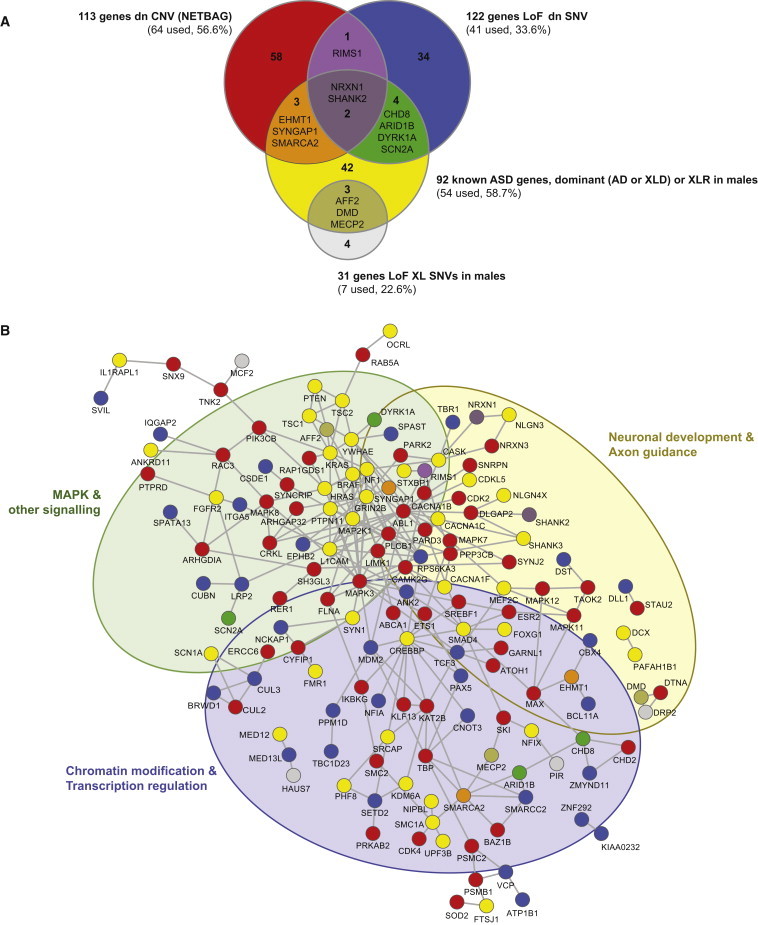
- Network analyses linked de novo CNVs and de novo LoF SNVs to neuronal signaling and development, synapse function, and chromatin regulation: a NETBAG network of 113 genes (global cluster p = 0.02) and a DAPPLE protein-protein interaction network of 151 genes with 1.5-fold more direct interactions than expected (p < 0.001).
Methods
- The Autism Genome Project sample included 2,446 ASD-affected families passing QC (from 2,845 families and 9,050 individuals) and 2,640 unrelated European-ancestry controls; all were genotyped on Illumina 1M arrays and analyzed with the same QC and CNV pipeline.
- CNV burden was compared between affected subjects and controls with Fisher’s exact tests, PLINK, R, and custom scripts; de novo and clinically relevant CNVs were validated by quantitative PCR, MLPA, and/or long-range PCR.
- Analyses included gene-list burden tests (ASD/ID loci, BrainSpan brain-expressed genes, postsynaptic density genes, FMRP targets, HPO/MPO neurological genes, haploinsufficiency probability), logit models for multigene burden, and functional enrichment/network analyses using NETBAG and DAPPLE.
Limitations
- The paper states that many subjects were assessed with clinical diagnostic methods and excluded if positive, and individuals with known congenital malformations or dysmorphic features were not enrolled, so the etiologic yield is likely an underestimate.
- The paper notes that some CNVs were seen in a small fraction of controls, consistent with variable expressivity and/or incomplete penetrance.
- Evident from the text: main analyses were restricted to European-ancestry subjects, and CNV detection relied on array-based calls rather than sequence data.
Model-written summary. Check it against the paper before relying on it.
Integrity signals
Registry
Cites
Statistics
Figures
Verification
Claims the paper makes
83 Own result · 34 Not checked yet · 24 Own interpretation · 6 No basis given · 2 Own method
A result the paper reports from its own data — it cites no other source for it, so there is none to check. The quote shows it is in the paper.
In the paper
“Even after controlling for the difference in CNV size by proportionally scaling the number of intersected genes in each group, we observed a 1.77-fold difference (1.2-fold for deletions and 2.8-fold for duplications, p = 0.02).”
§ Convergence of Genes and Cellular Pathways Dysregulated in Autism Spectrum Disorders > Results > Excess Genome-wide Burden of Rare and De Novo Genic CNVs
plaincorrelationaln = 99 ·- Asserted: passes — The authors put it forward as true.
- Checkable: passes — It can be checked against evidence.
- Load-bearing: passes — The paper’s conclusions depend on it.
- Based: passes — The paper gives a reason why it holds.
- Rests on an assumption: The published control de novo CNV datasets (unaffected siblings from the Simons Simplex Collection and Icelandic control trios) are comparable to the AGP affected subjects for CNV size and gene-content comparisons.
A result the paper reports from its own data — it cites no other source for it, so there is none to check. The quote shows it is in the paper.
In the paper
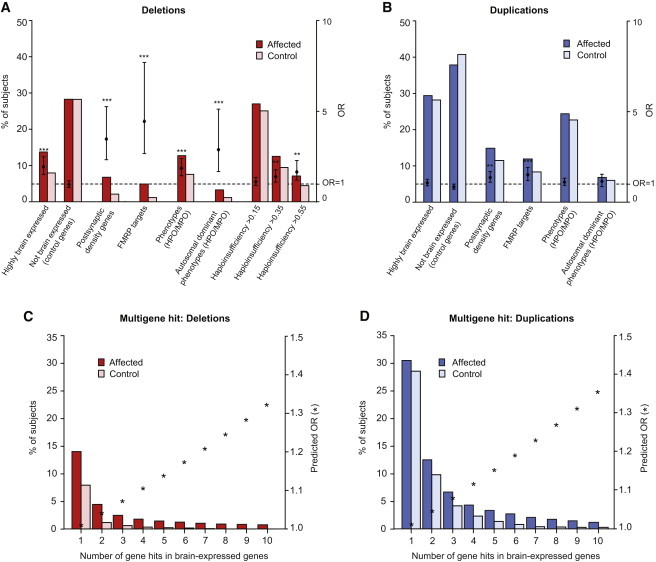
“FMRP targets (n = 842) and PSD genes (n = 1,453) carried a significant excess of both deletions and duplications in affected subjects (Figures 3A and 3B).”
§ Convergence of Genes and Cellular Pathways Dysregulated in Autism Spectrum Disorders > Results > FMRP Targets, PSD Genes, and Other Neuronal Genes Are Implicated in ASD
plaincorrelational- Asserted: passes — The authors put it forward as true.
- Checkable: passes — It can be checked against evidence.
- Load-bearing: passes — The paper’s conclusions depend on it.
- Based: passes — The paper gives a reason why it holds.
A result the paper reports from its own data — it cites no other source for it, so there is none to check. The quote shows it is in the paper.
In the paper
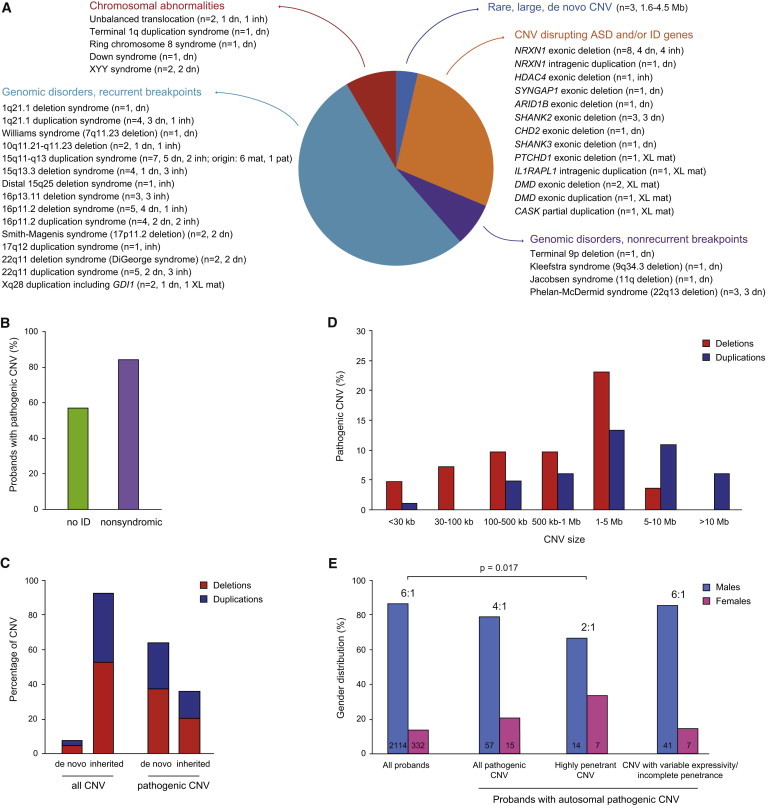
“We also observed that the proportion of females was significantly increased among carriers of highly penetrant pathogenic CNVs (male-to-female ratio of 2:1 versus 6:1 among all affected subjects; two-tailed Fisher’s exact test p = 0.017; Figure 2E).”
§ Convergence of Genes and Cellular Pathways Dysregulated in Autism Spectrum Disorders > Results > CNV Burden in Autosomal-Dominant or X-Linked Genes and Loci Implicated in ASD and/or ID
plaincorrelational- Asserted: passes — The authors put it forward as true.
- Checkable: passes — It can be checked against evidence.
- Load-bearing: unclear — It is unclear whether the paper’s conclusions depend on it.
- Based: passes — The paper gives a reason why it holds.
A result the paper reports from its own data — it cites no other source for it, so there is none to check. The quote shows it is in the paper.
In the paper
“In contrast, the male-to-female ratio among individuals with CNVs associated with variable expressivity was 6:1.”
§ Convergence of Genes and Cellular Pathways Dysregulated in Autism Spectrum Disorders > Results > CNV Burden in Autosomal-Dominant or X-Linked Genes and Loci Implicated in ASD and/or ID
plaincorrelational- Asserted: passes — The authors put it forward as true.
- Checkable: passes — It can be checked against evidence.
- Load-bearing: unclear — It is unclear whether the paper’s conclusions depend on it.
- Based: passes — The paper gives a reason why it holds.
A result the paper reports from its own data — it cites no other source for it, so there is none to check. The quote shows it is in the paper.
In the paper
“This enrichment was apparent for both deletions and duplications and remained after we controlled for potential case-control differences (Table 1).”
§ Convergence of Genes and Cellular Pathways Dysregulated in Autism Spectrum Disorders > Results > Excess Genome-wide Burden of Rare and De Novo Genic CNVs
plaincorrelationaln = 2,446- Asserted: passes — The authors put it forward as true.
- Checkable: passes — It can be checked against evidence.
- Load-bearing: passes — The paper’s conclusions depend on it.
- Based: passes — The paper gives a reason why it holds.
- Rests on an assumption: Unrelated control subjects from SAGE, the Ontario Colorectal Cancer Case-Control Study, and HABC, who had no obvious psychiatric history, are valid controls for ASD CNV burden analyses.
A result the paper reports from its own data — it cites no other source for it, so there is none to check. The quote shows it is in the paper.
In the paper
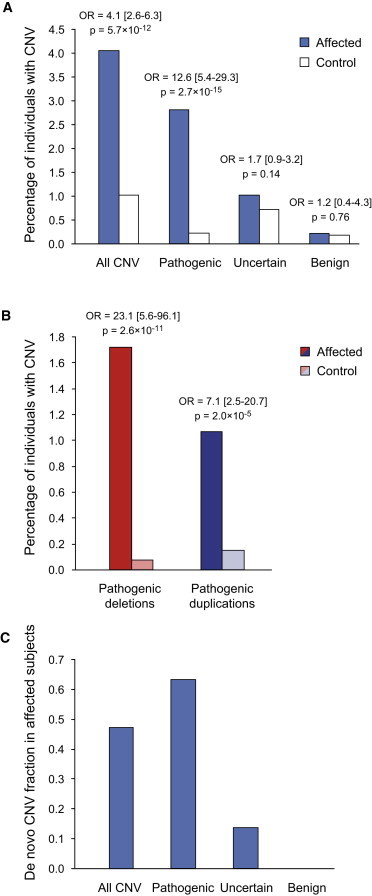
“and pathogenic deletions showed a striking estimated OR of 23.13 (95% CI = 5.57–96.08, p = 2.6 × 10⁻¹¹; Figure 1B).”
§ Convergence of Genes and Cellular Pathways Dysregulated in Autism Spectrum Disorders > Results > CNV Burden in Autosomal-Dominant or X-Linked Genes and Loci Implicated in ASD and/or ID
hedgedcorrelational- Asserted: passes — The authors put it forward as true.
- Checkable: passes — It can be checked against evidence.
- Load-bearing: passes — The paper’s conclusions depend on it.
- Based: passes — The paper gives a reason why it holds.
- Rests on an assumption: Unrelated control subjects from SAGE, the Ontario Colorectal Cancer Case-Control Study, and HABC, who had no obvious psychiatric history, are valid controls for ASD CNV burden analyses.
A result the paper reports from its own data — it cites no other source for it, so there is none to check. The quote shows it is in the paper.
In the paper
“and a small maternally inherited intragenic deletion of HDAC4 (MIM 605314), involved in brachydactyly-mental-retardation syndrome (MIM 600430; Figure S7).”
§ Convergence of Genes and Cellular Pathways Dysregulated in Autism Spectrum Disorders > Results > CNV Burden in Autosomal-Dominant or X-Linked Genes and Loci Implicated in ASD and/or ID
plainSingle case- Asserted: passes — The authors put it forward as true.
- Checkable: passes — It can be checked against evidence.
- Load-bearing: passes — The paper’s conclusions depend on it.
- Based: passes — The paper gives a reason why it holds.
A result the paper reports from its own data — it cites no other source for it, so there is none to check. The quote shows it is in the paper.
In the paper
“Pathogenic (or clinically significant) CNVs were identified in 2.8% (60/2,147) of affected subjects (OR = 12.62, 95% CI = 5.44–29.27, p = 2.74 × 10⁻¹⁵)”
§ Convergence of Genes and Cellular Pathways Dysregulated in Autism Spectrum Disorders > Results > CNV Burden in Autosomal-Dominant or X-Linked Genes and Loci Implicated in ASD and/or ID
plaincorrelational- Asserted: passes — The authors put it forward as true.
- Checkable: passes — It can be checked against evidence.
- Load-bearing: passes — The paper’s conclusions depend on it.
- Based: passes — The paper gives a reason why it holds.
- Rests on an assumption: Unrelated control subjects from SAGE, the Ontario Colorectal Cancer Case-Control Study, and HABC, who had no obvious psychiatric history, are valid controls for ASD CNV burden analyses.
A result the paper reports from its own data — it cites no other source for it, so there is none to check. The quote shows it is in the paper.
In the paper
“Similarly, deletions (and not duplications) overlapping genes implicated in dominant neurological diseases and orthologous genes associated with abnormal phenotypes in heterozygous knockout mice conferred significant increase in ASD risk (OR = 2.94, 95% CI = 1.76–4.93, p = 2.5 × 10⁻⁵).”
§ Convergence of Genes and Cellular Pathways Dysregulated in Autism Spectrum Disorders > Results > FMRP Targets, PSD Genes, and Other Neuronal Genes Are Implicated in ASD
plaincorrelational- Asserted: passes — The authors put it forward as true.
- Checkable: passes — It can be checked against evidence.
- Load-bearing: passes — The paper’s conclusions depend on it.
- Based: passes — The paper gives a reason why it holds.
A result the paper reports from its own data — it cites no other source for it, so there is none to check. The quote shows it is in the paper.
In the paper
“Overall, 4.7% of trios had at least one de novo CNV, whereas control subjects had a frequency of 1%–2%.4,31,38”
§ Convergence of Genes and Cellular Pathways Dysregulated in Autism Spectrum Disorders > Results > Excess Genome-wide Burden of Rare and De Novo Genic CNVs
plainn = 99- Asserted: passes — The authors put it forward as true.
- Checkable: passes — It can be checked against evidence.
- Load-bearing: passes — The paper’s conclusions depend on it.
- Based: passes — The paper gives a reason why it holds.
- It may state two separate claims as one. 39
- Probably not a substantial claim. 13
In the paper
“For example, two unrelated males were found to harbor Xq28 duplications (MIM 300815), one de novo and one maternal, corresponding to a ∼0.3 Mb segmental-duplication-mediated gain (153.2–153.5 Mb), which was previously reported in X-linked ID.42”
§ Convergence of Genes and Cellular Pathways Dysregulated in Autism Spectrum Disorders > Results > CNV Burden in Autosomal-Dominant or X-Linked Genes and Loci Implicated in ASD and/or ID
What the sources say
- Not checked yetcites [42] Vandewalle, 2009, Dosage-dependent severity of the phenotype in patients with mental retardation due to a recurrent copy-number gain at Xq28 mediated by an unusual recombination, Am. J. Hum. Genet. source
plain- Asserted: passes — The authors put it forward as true.
- Checkable: passes — It can be checked against evidence.
- Load-bearing: passes — The paper’s conclusions depend on it.
- Based: passes — The paper gives a reason why it holds.
It may state two separate claims as one.
A result the paper reports from its own data — it cites no other source for it, so there is none to check. The quote shows it is in the paper.
In the paper
“The majority of these duplications were of maternal origin, but two were paternally derived (one without information; Table S9).”
§ Convergence of Genes and Cellular Pathways Dysregulated in Autism Spectrum Disorders > Results > CNV Burden in Autosomal-Dominant or X-Linked Genes and Loci Implicated in ASD and/or ID
plain- Asserted: passes — The authors put it forward as true.
- Checkable: passes — It can be checked against evidence.
- Load-bearing: unclear — It is unclear whether the paper’s conclusions depend on it.
- Based: passes — The paper gives a reason why it holds.
It may state two separate claims as one.
A result the paper reports from its own data — it cites no other source for it, so there is none to check. The quote shows it is in the paper.
In the paper
“Given that the lists of FMRP targets and PSD genes shared 279 genes, we performed conditional analyses showing that the excess of affected subjects carrying deletions overlapping PSD genes was independent of the signal in FMRP targets (OR = 2.62, 95% CI = 1.62–4.32, p = 2.24 × 10⁻⁵) and represented 4% of subjects with exonic events (59/1,486) or 3% after exclusion of pathogenic events (p = 0.007).”
§ Convergence of Genes and Cellular Pathways Dysregulated in Autism Spectrum Disorders > Results > FMRP Targets, PSD Genes, and Other Neuronal Genes Are Implicated in ASD
plaincorrelational- Asserted: passes — The authors put it forward as true.
- Checkable: passes — It can be checked against evidence.
- Load-bearing: passes — The paper’s conclusions depend on it.
- Based: passes — The paper gives a reason why it holds.
It may state two separate claims as one.
A result the paper reports from its own data — it cites no other source for it, so there is none to check. The quote shows it is in the paper.
In the paper
“The clinical relevance of de novo CNVs in ASD is confirmed by the fact that among 102 such events identified, half (n = 46) are considered etiologically relevant, including 40 loci known to be involved in ASD and ID (see below).”
§ Convergence of Genes and Cellular Pathways Dysregulated in Autism Spectrum Disorders > Results > Excess Genome-wide Burden of Rare and De Novo Genic CNVs
boostedn = 46- Asserted: passes — The authors put it forward as true.
- Checkable: passes — It can be checked against evidence.
- Load-bearing: passes — The paper’s conclusions depend on it.
- Based: passes — The paper gives a reason why it holds.
It may state two separate claims as one.
A result the paper reports from its own data — it cites no other source for it, so there is none to check. The quote shows it is in the paper.
In the paper
“Five percent (73/1,486) of affected subjects with exonic CNVs, including 52 subjects with genes not previously implicated in ASD and/or ID, carried deletions overlapping one or more FMRP targets, yielding 43 ASD candidate genes (Figure 3A; Table S10).”
§ Convergence of Genes and Cellular Pathways Dysregulated in Autism Spectrum Disorders > Results > FMRP Targets, PSD Genes, and Other Neuronal Genes Are Implicated in ASD
plaincorrelationaln = 73- Asserted: passes — The authors put it forward as true.
- Checkable: passes — It can be checked against evidence.
- Load-bearing: passes — The paper’s conclusions depend on it.
- Based: passes — The paper gives a reason why it holds.
It may state two separate claims as one.
A result the paper reports from its own data — it cites no other source for it, so there is none to check. The quote shows it is in the paper.
In the paper
“Interestingly, one AGP proband with the duplication had autism and a normal IQ, whereas the second had a borderline IQ (72) (see Table S8 for phenotype information of all affected subjects with pathogenic CNVs).”
§ Convergence of Genes and Cellular Pathways Dysregulated in Autism Spectrum Disorders > Results > CNV Burden in Autosomal-Dominant or X-Linked Genes and Loci Implicated in ASD and/or ID
plain- Asserted: passes — The authors put it forward as true.
- Checkable: passes — It can be checked against evidence.
- Load-bearing: unclear — It is unclear whether the paper’s conclusions depend on it.
- Based: passes — The paper gives a reason why it holds.
It may state two separate claims as one.
None of the sources cited for this claim have been checked yet.
In the paper
“De novo CNVs affected 3.8-fold more genes in affected subjects than in control subjects4,31 (2.6-fold for deletions and 6.1-fold for duplications).”
§ Convergence of Genes and Cellular Pathways Dysregulated in Autism Spectrum Disorders > Results > Excess Genome-wide Burden of Rare and De Novo Genic CNVs
What the sources say
- Not checked yetcites [4] Sanders, 2011, Multiple recurrent de novo CNVs, including duplications of the 7q11.23 Williams syndrome region, are strongly associated with autism, Neuron source
- Not checked yetcites [31] Kirov, 2012, De novo CNV analysis implicates specific abnormalities of postsynaptic signalling complexes in the pathogenesis of schizophrenia, Mol. Psychiatry source
plaincorrelationaln = 99- Asserted: passes — The authors put it forward as true.
- Checkable: passes — It can be checked against evidence.
- Load-bearing: passes — The paper’s conclusions depend on it.
- Based: passes — The paper gives a reason why it holds.
It may state two separate claims as one.
- Rests on an assumption: The published control de novo CNV datasets (unaffected siblings from the Simons Simplex Collection and Icelandic control trios) are comparable to the AGP affected subjects for CNV size and gene-content comparisons.
A result the paper reports from its own data — it cites no other source for it, so there is none to check. The quote shows it is in the paper.
In the paper
“When we analyzed samples of inferred European ancestry, we found that 4% (87/2,147) of ASD-affected subjects had CNVs overlapping autosomal-dominant or X-linked genes and loci implicated in ASD and/or ID; this percentage was significantly higher than that in controls (OR = 4.09, 95% confidence interval [CI] = 2.64–6.32, p = 5.7 × 10⁻¹²; Figure 1A).”
§ Convergence of Genes and Cellular Pathways Dysregulated in Autism Spectrum Disorders > Results > CNV Burden in Autosomal-Dominant or X-Linked Genes and Loci Implicated in ASD and/or ID
plaincorrelational- Asserted: passes — The authors put it forward as true.
- Checkable: passes — It can be checked against evidence.
- Load-bearing: passes — The paper’s conclusions depend on it.
- Based: passes — The paper gives a reason why it holds.
It may state two separate claims as one.
- Rests on an assumption: Unrelated control subjects from SAGE, the Ontario Colorectal Cancer Case-Control Study, and HABC, who had no obvious psychiatric history, are valid controls for ASD CNV burden analyses.
A result the paper reports from its own data — it cites no other source for it, so there is none to check. The quote shows it is in the paper.
In the paper
“Inheritance data showed that 64% (54/84) of pathogenic CNVs were de novo events (59% were deletions, and 41% were duplications) and that the remaining (36%) were inherited, including seven X-linked CNVs maternally transmitted to males and 23 (13 maternal and 10 paternal [27%]) on autosomes (Figure 2C).”
§ Convergence of Genes and Cellular Pathways Dysregulated in Autism Spectrum Disorders > Results > CNV Burden in Autosomal-Dominant or X-Linked Genes and Loci Implicated in ASD and/or ID
plain- Asserted: passes — The authors put it forward as true.
- Checkable: passes — It can be checked against evidence.
- Load-bearing: unclear — It is unclear whether the paper’s conclusions depend on it.
- Based: passes — The paper gives a reason why it holds.
It may state two separate claims as one.
A result the paper reports from its own data — it cites no other source for it, so there is none to check. The quote shows it is in the paper.
In the paper
“For 85 of 102 de novo events, it was possible to determine the parent of origin, and roughly equal numbers of events originated on the paternal allele (n = 45) and the maternal allele (n = 40) (Tables S5A–S5H).”
§ Convergence of Genes and Cellular Pathways Dysregulated in Autism Spectrum Disorders > Results > Excess Genome-wide Burden of Rare and De Novo Genic CNVs
plain- Asserted: passes — The authors put it forward as true.
- Checkable: passes — It can be checked against evidence.
- Load-bearing: fails — The paper’s conclusions may not depend on it.
- Based: passes — The paper gives a reason why it holds.
Probably not a substantial claim. The paper’s conclusions may not depend on it. It may state two separate claims as one.
A result the paper reports from its own data — it cites no other source for it, so there is none to check. The quote shows it is in the paper.
In the paper
“(4) show an increased proportion of females among carriers of highly penetrant pathogenic CNVs, as well as among carriers of deletions affecting FMRP targets;”
§ Convergence of Genes and Cellular Pathways Dysregulated in Autism Spectrum Disorders > Discussion
plaincorrelational- Asserted: passes — The authors put it forward as true.
- Checkable: passes — It can be checked against evidence.
- Load-bearing: passes — The paper’s conclusions depend on it.
- Based: passes — The paper gives a reason why it holds.
It may state two separate claims as one.
In the paper
“The union set of 336 unique genes (Table S15) analyzed by DAPPLE37 resulted in a network of direct PPIs encoded by 151 genes (Figure 5A) from each of the three main lists: 54/92 (58.7%) genes involved in ASD, 64/113 (56.6%) de novo CNV genes, and 41/122 (33.6%) de novo LoF SNV genes.”
§ Convergence of Genes and Cellular Pathways Dysregulated in Autism Spectrum Disorders > Results > De Novo CNVs and LoF SNVs Converge on Functional Gene Networks
What the sources say
- Not checked yetcites [37] Rossin, 2011, Proteins encoded in genomic regions associated with immune-mediated disease physically interact and suggest underlying biology, PLoS Genet. source
plaincorrelational- Asserted: passes — The authors put it forward as true.
- Checkable: passes — It can be checked against evidence.
- Load-bearing: passes — The paper’s conclusions depend on it.
- Based: passes — The paper gives a reason why it holds.
It may state two separate claims as one.
- The authors state this as an assumption: Different genes harboring suspected causative mutations for the same disorder often physically interact.
A result the paper reports from its own data — it cites no other source for it, so there is none to check. The quote shows it is in the paper.
In the paper
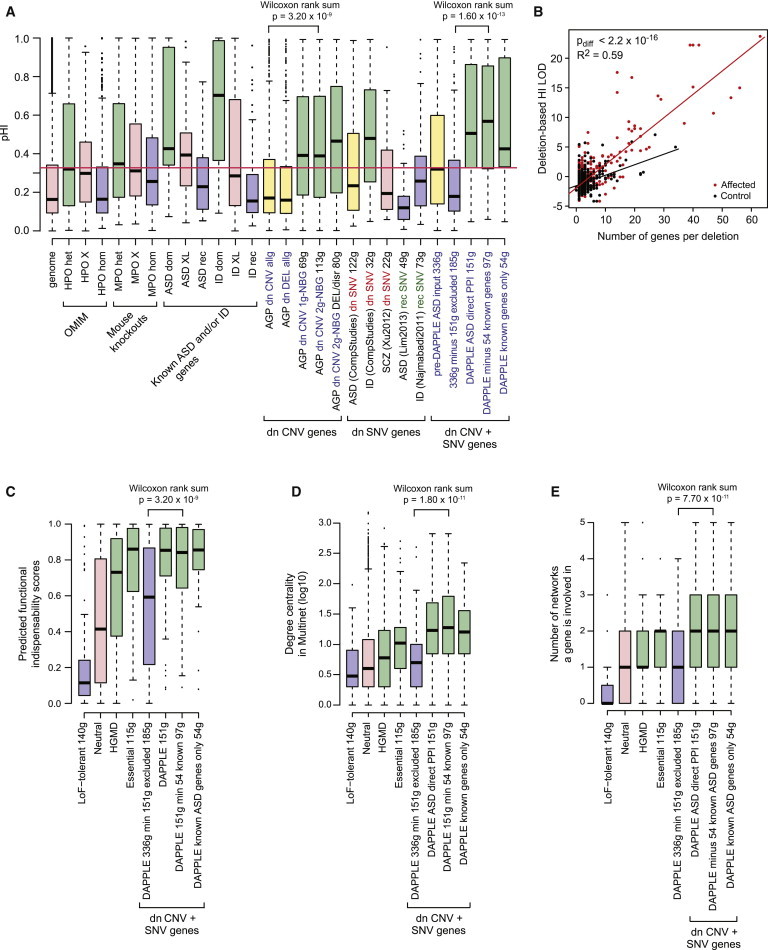
“Furthermore, similar to genes with known disease-causing mutations (Figure 6C), those genes have high functional-indispensability scores and a comparable high degree of centrality (i.e., high number of direct neighbors) and number of networks in which they are involved (Figures 6D and 6E).”
§ Convergence of Genes and Cellular Pathways Dysregulated in Autism Spectrum Disorders > Results > De Novo CNVs and LoF SNVs Converge on Functional Gene Networks
plaincorrelational- Asserted: passes — The authors put it forward as true.
- Checkable: passes — It can be checked against evidence.
- Load-bearing: passes — The paper’s conclusions depend on it.
- Based: passes — The paper gives a reason why it holds.
It may state two separate claims as one.
A result the paper reports from its own data — it cites no other source for it, so there is none to check. The quote shows it is in the paper.
In the paper
“De novo deletions (52 in European affected subjects) were found to be significantly enriched within each gene set or pathway cluster (for 85 of the 86 gene sets or pathways), as well as across clusters (chi-square test p = 9.8 × 10⁻⁹) (Table S12B)”
§ Convergence of Genes and Cellular Pathways Dysregulated in Autism Spectrum Disorders > Results > Genes within De Novo CNVs Cluster in a Gene Network
plaincorrelationaln = 52 ·- Asserted: passes — The authors put it forward as true.
- Checkable: passes — It can be checked against evidence.
- Load-bearing: passes — The paper’s conclusions depend on it.
- Based: passes — The paper gives a reason why it holds.
It may state two separate claims as one.
A result the paper reports from its own data — it cites no other source for it, so there is none to check. The quote shows it is in the paper.
In the paper
“Compared to all other genes within de novo CNVs (or deletion CNVs only), genes in the network exhibited a significantly higher pHI (Wilcoxon rank sum p = 7.07 × 10⁻⁸), and 55% (59/107 [6 without information]) had a pHI > 0.35.”
§ Convergence of Genes and Cellular Pathways Dysregulated in Autism Spectrum Disorders > Results > Genes within De Novo CNVs Cluster in a Gene Network
plaincorrelational- Asserted: passes — The authors put it forward as true.
- Checkable: passes — It can be checked against evidence.
- Load-bearing: passes — The paper’s conclusions depend on it.
- Based: passes — The paper gives a reason why it holds.
It may state two separate claims as one.
A result the paper reports from its own data — it cites no other source for it, so there is none to check. The quote shows it is in the paper.
In the paper
“Our findings implicate many ASD candidate genes altered by de novo, inherited, or X-linked CNVs (e.g., SETD5, miR137, and HDAC9 [MIM 606543]; Supplemental Data section “Highlighted Genes”) or altered by both de novo CNVs and LoF SNVs (e.g., RIMS1, TRIP12, and DLL1; Figures 4B and 5).”
§ Convergence of Genes and Cellular Pathways Dysregulated in Autism Spectrum Disorders > Discussion
plaincorrelational- Asserted: passes — The authors put it forward as true.
- Checkable: passes — It can be checked against evidence.
- Load-bearing: passes — The paper’s conclusions depend on it.
- Based: passes — The paper gives a reason why it holds.
It may state two separate claims as one.
A result the paper reports from its own data — it cites no other source for it, so there is none to check. The quote shows it is in the paper.
In the paper
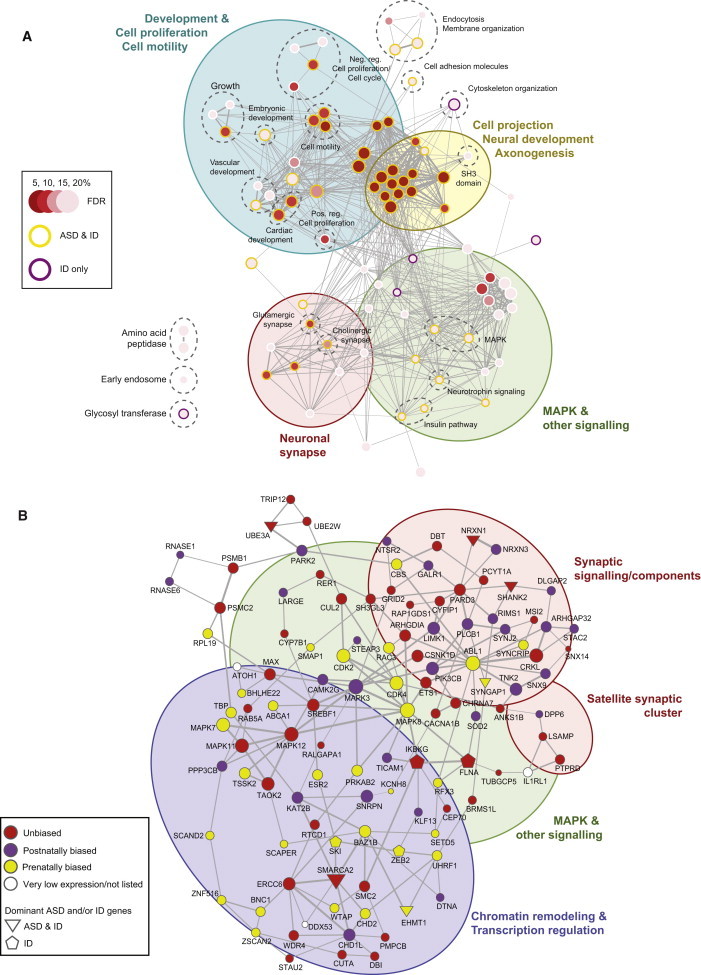
“Eleven genes affected by de novo CNVs (NRXN1, SHANK2, ARID1B, RIMS1 [MIM 606629], TRIP12, SMARCC2 [MIM 601734], DLL1 [MIM 606582], TM4SF19, MLL3 [MIM 606833], PHF2 [MIM 604351], and CSTF2T [MIM 611968]) were found to be altered by de novo LoF SNVs among autism cohorts, and three of them (NRXN1, SHANK2, and RIMS1) were selected by NETBAG (Figure 4B).”
§ Convergence of Genes and Cellular Pathways Dysregulated in Autism Spectrum Disorders > Results > De Novo CNVs and LoF SNVs Converge on Functional Gene Networks
plaincorrelational- Asserted: passes — The authors put it forward as true.
- Checkable: passes — It can be checked against evidence.
- Load-bearing: passes — The paper’s conclusions depend on it.
- Based: passes — The paper gives a reason why it holds.
It may state two separate claims as one.
A result the paper reports from its own data — it cites no other source for it, so there is none to check. The quote shows it is in the paper.
In the paper
“Importantly, when considering highly penetrant pathogenic CNVs, we found a 2:1 male-to-female ratio (deviating from the overall ratio of 6:1 in the study sample).”
§ Convergence of Genes and Cellular Pathways Dysregulated in Autism Spectrum Disorders > Discussion
plaincorrelational- Asserted: passes — The authors put it forward as true.
- Checkable: passes — It can be checked against evidence.
- Load-bearing: passes — The paper’s conclusions depend on it.
- Based: passes — The paper gives a reason why it holds.
It may state two separate claims as one.
A result the paper reports from its own data — it cites no other source for it, so there is none to check. The quote shows it is in the paper.
In the paper
“His ASD-affected brother has mild ID, similar dysmorphic features, and epilepsy with onset at age 9 years and carries the same deletion, which removes the first six exons of CHD2.”
§ Convergence of Genes and Cellular Pathways Dysregulated in Autism Spectrum Disorders > Results > Genes within De Novo CNVs Cluster in a Gene Network
plainSingle case- Asserted: passes — The authors put it forward as true.
- Checkable: passes — It can be checked against evidence.
- Load-bearing: unclear — It is unclear whether the paper’s conclusions depend on it.
- Based: passes — The paper gives a reason why it holds.
It may state two separate claims as one.
A result the paper reports from its own data — it cites no other source for it, so there is none to check. The quote shows it is in the paper.
In the paper
“Compared to the genome average, they are also among the top 75% of more-conserved genes (on the basis of Genomic Evolutionary Rate Profiling scores and PhyloP) and are highly expressed in the brain.”
§ Convergence of Genes and Cellular Pathways Dysregulated in Autism Spectrum Disorders > Results > De Novo CNVs and LoF SNVs Converge on Functional Gene Networks
plaincorrelational- Asserted: passes — The authors put it forward as true.
- Checkable: passes — It can be checked against evidence.
- Load-bearing: unclear — It is unclear whether the paper’s conclusions depend on it.
- Based: passes — The paper gives a reason why it holds.
It may state two separate claims as one.
A result the paper reports from its own data — it cites no other source for it, so there is none to check. The quote shows it is in the paper.
In the paper
“(3) confirm the contribution of de novo CNVs to the etiology of autism and highlight the contribution of inherited pathogenic imbalances (36%);”
§ Convergence of Genes and Cellular Pathways Dysregulated in Autism Spectrum Disorders > Discussion
plaindirectn = 82- Asserted: passes — The authors put it forward as true.
- Checkable: passes — It can be checked against evidence.
- Load-bearing: passes — The paper’s conclusions depend on it.
- Based: passes — The paper gives a reason why it holds.
It may state two separate claims as one.
A result the paper reports from its own data — it cites no other source for it, so there is none to check. The quote shows it is in the paper.
In the paper
“Overall, these findings are consistent among the three different types of analyses shown in Figures 4A, 4B, and 5.”
§ Convergence of Genes and Cellular Pathways Dysregulated in Autism Spectrum Disorders > Results > De Novo CNVs and LoF SNVs Converge on Functional Gene Networks
plain- Asserted: passes — The authors put it forward as true.
- Checkable: passes — It can be checked against evidence.
- Load-bearing: passes — The paper’s conclusions depend on it.
- Based: passes — The paper gives a reason why it holds.
Probably not a substantial claim.
The paper states this without a source or data behind it here, so there is nothing to check it against. The quote shows it is in the paper.
In the paper
“(the deletion arose on the paternal chromosome)”
§ Convergence of Genes and Cellular Pathways Dysregulated in Autism Spectrum Disorders > Results > Genes within De Novo CNVs Cluster in a Gene Network
plainSingle case- Asserted: passes — The authors put it forward as true.
- Checkable: passes — It can be checked against evidence.
- Load-bearing: fails — The paper’s conclusions may not depend on it.
- Based: passes — The paper gives a reason why it holds.
Probably not a substantial claim. The paper’s conclusions may not depend on it.
A result the paper reports from its own data — it cites no other source for it, so there is none to check. The quote shows it is in the paper.
In the paper
“(6) show that both deletions and duplications involving FMRP targets and PSD genes increase ASD risk;”
§ Convergence of Genes and Cellular Pathways Dysregulated in Autism Spectrum Disorders > Discussion
plaindirect- Asserted: passes — The authors put it forward as true.
- Checkable: passes — It can be checked against evidence.
- Load-bearing: passes — The paper’s conclusions depend on it.
- Based: passes — The paper gives a reason why it holds.
It may state two separate claims as one.
A result the paper reports from its own data — it cites no other source for it, so there is none to check. The quote shows it is in the paper.
In the paper
“Interestingly, 39 of the 97 genes are either FMRP-related or PSD genes (of the initial 151 genes identified by DAPPLE, 51 are FMRP interactors and 24 are PSD genes).”
§ Convergence of Genes and Cellular Pathways Dysregulated in Autism Spectrum Disorders > Results > De Novo CNVs and LoF SNVs Converge on Functional Gene Networks
plain- Asserted: passes — The authors put it forward as true.
- Checkable: passes — It can be checked against evidence.
- Load-bearing: passes — The paper’s conclusions depend on it.
- Based: passes — The paper gives a reason why it holds.
It may state two separate claims as one.
A result the paper reports from its own data — it cites no other source for it, so there is none to check. The quote shows it is in the paper.
In the paper
“We recapitulated many of the results of our gene-set analysis (Figure 4A), notably for synapse functions and processes, and also identified genes involved in chromatin and transcription regulation.”
§ Convergence of Genes and Cellular Pathways Dysregulated in Autism Spectrum Disorders > Results > Genes within De Novo CNVs Cluster in a Gene Network
plaincorrelational- Asserted: passes — The authors put it forward as true.
- Checkable: passes — It can be checked against evidence.
- Load-bearing: passes — The paper’s conclusions depend on it.
- Based: passes — The paper gives a reason why it holds.
It may state two separate claims as one.
None of the sources cited for this claim have been checked yet.
In the paper
“Enrichment of synaptic functioning has also been reported among inherited events in the AGRE families47 and among de novo events in the Simons Simplex Collection.36”
§ Convergence of Genes and Cellular Pathways Dysregulated in Autism Spectrum Disorders > Results > Network Analysis Links Exonic Deletions to Neurodevelopmental Processes
What the sources say
- Not checked yetcites [47] Gai, 2012, Rare structural variation of synapse and neurotransmission genes in autism, Mol. Psychiatry source
- Not checked yetcites [36] Gilman, 2011, Rare de novo variants associated with autism implicate a large functional network of genes involved in formation and function of synapses, Neuron source
plaincorrelational- Asserted: passes — The authors put it forward as true.
- Checkable: passes — It can be checked against evidence.
- Load-bearing: unclear — It is unclear whether the paper’s conclusions depend on it.
- Based: passes — The paper gives a reason why it holds.
It may state two separate claims as one.
None of the sources cited for this claim have been checked yet.
In the paper
“Microdeletions of miR137 have been reported in ASD,39 ID,40 and schizophrenia.41”
§ Convergence of Genes and Cellular Pathways Dysregulated in Autism Spectrum Disorders > Results > Excess Genome-wide Burden of Rare and De Novo Genic CNVs
What the sources say
- Not checked yetcites [39] Carter, 2011, Hemizygous deletions on chromosome 1p21.3 involving the DPYD gene in individuals with autism spectrum disorder, Clin. Genet. source
- Not checked yetcites [40] Willemsen, 2011, Chromosome 1p21.3 microdeletions comprising DPYD and MIR137 are associated with intellectual disability, J. Med. Genet. source
- Not checked yetcites [41] 2011, Genome-wide association study identifies five new schizophrenia loci, Nat. Genet. source
plaincorrelationaln = 2- Asserted: passes — The authors put it forward as true.
- Checkable: passes — It can be checked against evidence.
- Load-bearing: fails — The paper’s conclusions may not depend on it.
- Based: passes — The paper gives a reason why it holds.
Probably not a substantial claim. The paper’s conclusions may not depend on it.
In the paper
“Many of the genes implicated in dominant diseases have been related to loss of function or haploinsufficiency, previously suggested to be more frequent and penetrant when deletions rather than duplications are involved.46”
§ Convergence of Genes and Cellular Pathways Dysregulated in Autism Spectrum Disorders > Results > FMRP Targets, PSD Genes, and Other Neuronal Genes Are Implicated in ASD
What the sources say
- Not checked yetcites [46] Turner, 2008, Germline rates of de novo meiotic deletions and duplications causing several genomic disorders, Nat. Genet. source
hedgedcorrelational- Asserted: passes — The authors put it forward as true.
- Checkable: passes — It can be checked against evidence.
- Load-bearing: passes — The paper’s conclusions depend on it.
- Based: passes — The paper gives a reason why it holds.
Probably not a substantial claim. It may state two separate claims as one.
A conclusion the paper draws from its own results — it cites no other source for it, so there is none to check. The quote shows it is in the paper.
In the paper
“Thus, it is likely that de novo and pathogenic CNVs contribute to risk by altering the expression of more than one gene, suggesting that genetic interactions between these genes can underlie ASD risk.”
§ Convergence of Genes and Cellular Pathways Dysregulated in Autism Spectrum Disorders > Results > Increased Multigene Burden in ASD-Affected Subjects
hedgedconditional- Asserted: passes — The authors put it forward as true.
- Checkable: passes — It can be checked against evidence.
- Load-bearing: passes — The paper’s conclusions depend on it.
- Based: passes — The paper gives a reason why it holds.
It may state two separate claims as one.
A conclusion the paper draws from its own results — it cites no other source for it, so there is none to check. The quote shows it is in the paper.
In the paper
“Notably, the signal further decreased 2-fold when the remaining pathogenic CNVs were removed, confirming that pathogenic inherited CNVs alone also carry risk.”
§ Convergence of Genes and Cellular Pathways Dysregulated in Autism Spectrum Disorders > Results > Increased Multigene Burden in ASD-Affected Subjects
boosteddirect- Asserted: passes — The authors put it forward as true.
- Checkable: passes — It can be checked against evidence.
- Load-bearing: passes — The paper’s conclusions depend on it.
- Based: passes — The paper gives a reason why it holds.
It may state two separate claims as one.
In the paper
“At least 124 genes and 55 genomic loci have been implicated in ASD to date (Tables S6A and S6B; updated from Betancur18), all of which have also been implicated in ID.”
§ Convergence of Genes and Cellular Pathways Dysregulated in Autism Spectrum Disorders > Results > CNV Burden in Autosomal-Dominant or X-Linked Genes and Loci Implicated in ASD and/or ID
What the sources say
- Not checked yetcites [18] Betancur, 2011, Etiological heterogeneity in autism spectrum disorders: more than 100 genetic and genomic disorders and still counting, Brain Res. source
plaincorrelational- Asserted: passes — The authors put it forward as true.
- Checkable: passes — It can be checked against evidence.
- Load-bearing: passes — The paper’s conclusions depend on it.
- Based: passes — The paper gives a reason why it holds.
It may state two separate claims as one.
In the paper
“Interestingly, CNV testing and exome sequencing have so far yielded mostly nonoverlapping genes, which might reflect different mutational mechanisms, although they might still perturb connected biological pathways.17”
§ Convergence of Genes and Cellular Pathways Dysregulated in Autism Spectrum Disorders > Introduction
What the sources say
- Not checked yetcites [17] Devlin, 2012, Genetic architecture in autism spectrum disorder, Curr. Opin. Genet. Dev. source
hedgedconditional- Asserted: passes — The authors put it forward as true.
- Checkable: passes — It can be checked against evidence.
- Load-bearing: passes — The paper’s conclusions depend on it.
- Based: passes — The paper gives a reason why it holds.
Probably not a substantial claim. It may state two separate claims as one.
A conclusion the paper draws from its own results — it cites no other source for it, so there is none to check. The quote shows it is in the paper.
In the paper
“Neither parent carries the deletion, suggesting germline mosaicism (the deletion arose on the paternal chromosome).”
§ Convergence of Genes and Cellular Pathways Dysregulated in Autism Spectrum Disorders > Results > Genes within De Novo CNVs Cluster in a Gene Network
hedgeddirectSingle case- Asserted: passes — The authors put it forward as true.
- Checkable: passes — It can be checked against evidence.
- Load-bearing: unclear — It is unclear whether the paper’s conclusions depend on it.
- Based: passes — The paper gives a reason why it holds.
It may state two separate claims as one.
None of the sources cited for this claim have been checked yet.
In the paper
“This is consistent with evidence that FMRP targets belong to multiple signaling and interconnected pathways such as PI3K-Akt-TSC-PTEN-mTOR and PI3K-RAS-MAPK,59,60 which have been linked to ASD through both underexpression and overexpression of genes in these pathways.”
§ Convergence of Genes and Cellular Pathways Dysregulated in Autism Spectrum Disorders > Discussion
What the sources say
plaincorrelational- Asserted: passes — The authors put it forward as true.
- Checkable: passes — It can be checked against evidence.
- Load-bearing: unclear — It is unclear whether the paper’s conclusions depend on it.
- Based: passes — The paper gives a reason why it holds.
It may state two separate claims as one.
None of the sources cited for this claim have been checked yet.
In the paper
“This same phenomenon has recently been shown for SHANK157 and the 16p13.11 CNV.58”
§ Convergence of Genes and Cellular Pathways Dysregulated in Autism Spectrum Disorders > Discussion
What the sources say
plaincorrelational- Asserted: passes — The authors put it forward as true.
- Checkable: passes — It can be checked against evidence.
- Load-bearing: fails — The paper’s conclusions may not depend on it.
- Based: passes — The paper gives a reason why it holds.
Probably not a substantial claim. The paper’s conclusions may not depend on it.
None of the sources cited for this claim have been checked yet.
In the paper
“Three other genes affected by de novo CNVs (also picked by NETBAG)—CHD2, SYNGAP1, and SYNCRIP—are also affected by LoF de novo SNVs in ID,50,52 and two (SYNGAP1 and DPYD [MIM 612779]) are altered in schizophrenia.53”
§ Convergence of Genes and Cellular Pathways Dysregulated in Autism Spectrum Disorders > Results > De Novo CNVs and LoF SNVs Converge on Functional Gene Networks
What the sources say
- Not checked yetcites [50] Rauch, 2012, Range of genetic mutations associated with severe non-syndromic sporadic intellectual disability: an exome sequencing study, Lancet source
- Not checked yetcites [52] de Ligt, 2012, Diagnostic exome sequencing in persons with severe intellectual disability, N. Engl. J. Med. source
- Not checked yetcites [53] Xu, 2012, De novo gene mutations highlight patterns of genetic and neural complexity in schizophrenia, Nat. Genet. source
plaincorrelational- Asserted: passes — The authors put it forward as true.
- Checkable: passes — It can be checked against evidence.
- Load-bearing: unclear — It is unclear whether the paper’s conclusions depend on it.
- Based: passes — The paper gives a reason why it holds.
It may state two separate claims as one.
None of the sources cited for this claim have been checked yet.
In the paper
“PI3K, which is regulated by FMRP,59 is elevated in FXS mouse knockouts,62,63 and downregulation of this pathway has been shown to have therapeutic effect in ASD and FXS mouse models.”
§ Convergence of Genes and Cellular Pathways Dysregulated in Autism Spectrum Disorders > Discussion
What the sources say
- Not checked yetcites [59] Ascano, 2012, FMRP targets distinct mRNA sequence elements to regulate protein expression, Nature source
- Not checked yetcites [62] Gross, 2010, Excess phosphoinositide 3-kinase subunit synthesis and activity as a novel therapeutic target in fragile X syndrome, J. Neurosci. source
- Not checked yetcites [63] Sharma, 2010, Dysregulation of mTOR signaling in fragile X syndrome, J. Neurosci. source
plaindirect- Asserted: passes — The authors put it forward as true.
- Checkable: passes — It can be checked against evidence.
- Load-bearing: passes — The paper’s conclusions depend on it.
- Based: passes — The paper gives a reason why it holds.
It may state two separate claims as one.
What the paper did — it cites no source for this, so there is none to check. The quote shows it is in the paper.
In the paper
“Samples were genotyped on the same array platforms (Illumina 1M single or duo arrays) as those of ASD subjects and parents and were analyzed with the same quality-control (QC) procedures and CNV analysis pipeline.”
§ Convergence of Genes and Cellular Pathways Dysregulated in Autism Spectrum Disorders > Subjects and Methods > Control Subjects
plain- Asserted: passes — The authors put it forward as true.
- Checkable: passes — It can be checked against evidence.
- Load-bearing: passes — The paper’s conclusions depend on it.
- Based: passes — The paper gives a reason why it holds.
Probably not a substantial claim. It may state two separate claims as one.
What the paper did — it cites no source for this, so there is none to check. The quote shows it is in the paper.
In the paper
“Rare de novo CNVs, clinically relevant CNVs, and other selected rare CNVs were validated by at least one method (quantitative PCR, MLPA, and/or long-range PCR).”
§ Convergence of Genes and Cellular Pathways Dysregulated in Autism Spectrum Disorders > Subjects and Methods > CNV Analysis
plain- Asserted: passes — The authors put it forward as true.
- Checkable: passes — It can be checked against evidence.
- Load-bearing: passes — The paper’s conclusions depend on it.
- Based: passes — The paper gives a reason why it holds.
Probably not a substantial claim.
A conclusion the paper draws from its own results — it cites no other source for it, so there is none to check. The quote shows it is in the paper.
In the paper
“Whereas the majority of the 97 genes in the CNV or SNV network (not including the genes already known to be involved in ASD) most likely act via haploinsufficiency, a few are affected by duplications.”
§ Convergence of Genes and Cellular Pathways Dysregulated in Autism Spectrum Disorders > Discussion
hedgeddirect- Asserted: passes — The authors put it forward as true.
- Checkable: passes — It can be checked against evidence.
- Load-bearing: unclear — It is unclear whether the paper’s conclusions depend on it.
- Based: unclear — It is unclear why the paper says it holds.
It may state two separate claims as one.
None of the sources cited for this claim have been checked yet.
In the paper
“Affected AGP participants were classified according to the Autism Diagnostic Observation Schedule (ADOS)22 and the Autism Diagnostic Interview, Revised (ADI-R).23”
§ Convergence of Genes and Cellular Pathways Dysregulated in Autism Spectrum Disorders > Subjects and Methods > Autism Classification
What the sources say
- Not checked yetcites [22] Lord, 1989, Autism diagnostic observation schedule: a standardized observation of communicative and social behavior, J. Autism Dev. Disord. source
- Not checked yetcites [23] Lord, 1994, Autism Diagnostic Interview-Revised: a revised version of a diagnostic interview for caregivers of individuals with possible pervasive developmental disorders, J. Autism Dev. Disord. source
plain- Asserted: passes — The authors put it forward as true.
- Checkable: passes — It can be checked against evidence.
- Load-bearing: passes — The paper’s conclusions depend on it.
- Based: passes — The paper gives a reason why it holds.
Probably not a substantial claim.
The paper states this without a source or data behind it here, so there is nothing to check it against. The quote shows it is in the paper.
In the paper
“Other chromatin regulator genes, such as MBD5 (MIM 611472) and KMT2D (MIM 602113), have been implicated in ID and ASD, highlighting the need to further study this category of genes as ASD risk factors.”
§ Convergence of Genes and Cellular Pathways Dysregulated in Autism Spectrum Disorders > Discussion
plaincorrelational- Asserted: passes — The authors put it forward as true.
- Checkable: passes — It can be checked against evidence.
- Load-bearing: fails — The paper’s conclusions may not depend on it.
- Based: passes — The paper gives a reason why it holds.
Probably not a substantial claim. The paper’s conclusions may not depend on it.
A conclusion the paper draws from its own results — it cites no other source for it, so there is none to check. The quote shows it is in the paper.
In the paper
“One example is the duplication of PIK3CB (MIM 602925), which is likely to increase its expression and thus lead to excessive phosphatidylinositol 3-kinase (PI3K) activity.”
§ Convergence of Genes and Cellular Pathways Dysregulated in Autism Spectrum Disorders > Discussion
hedgedconditional- Asserted: passes — The authors put it forward as true.
- Checkable: passes — It can be checked against evidence.
- Load-bearing: passes — The paper’s conclusions depend on it.
- Based: passes — The paper gives a reason why it holds.
It may state two separate claims as one.
In the paper
“CHD2 (discussed above) and SYNGAP1 (encoding a Ras/Rap GTP-activating protein) are both involved in autosomal-dominant ID, ASD, and epilepsy.54”
§ Convergence of Genes and Cellular Pathways Dysregulated in Autism Spectrum Disorders > Results > De Novo CNVs and LoF SNVs Converge on Functional Gene Networks
What the sources say
- Not checked yetcites [54] Berryer, 2013, Mutations in SYNGAP1 cause intellectual disability, autism, and a specific form of epilepsy by inducing haploinsufficiency, Hum. Mutat. source
plaincorrelational- Asserted: passes — The authors put it forward as true.
- Checkable: passes — It can be checked against evidence.
- Load-bearing: unclear — It is unclear whether the paper’s conclusions depend on it.
- Based: passes — The paper gives a reason why it holds.
It may state two separate claims as one.
In the paper
“The clinical relevance of CNVs was interpreted according to the American College of Medical Genetics guidelines32 irrespective of the subjects’ affected status, and CNVs were classified as pathogenic, uncertain, or benign.”
§ Convergence of Genes and Cellular Pathways Dysregulated in Autism Spectrum Disorders > Subjects and Methods > CNV Analysis
What the sources say
- Not checked yetcites [32] Kearney, 2011, American College of Medical Genetics standards and guidelines for interpretation and reporting of postnatal constitutional copy number variants, Genet. Med. source
plain- Asserted: passes — The authors put it forward as true.
- Checkable: passes — It can be checked against evidence.
- Load-bearing: fails — The paper’s conclusions may not depend on it.
- Based: passes — The paper gives a reason why it holds.
Probably not a substantial claim. The paper’s conclusions may not depend on it.
A conclusion the paper draws from its own results — it cites no other source for it, so there is none to check. The quote shows it is in the paper.
In the paper
“(8) show that ASD-associated deletions impair synapse function and neurodevelopmental processes;”
§ Convergence of Genes and Cellular Pathways Dysregulated in Autism Spectrum Disorders > Discussion
plaindirect- Asserted: passes — The authors put it forward as true.
- Checkable: passes — It can be checked against evidence.
- Load-bearing: passes — The paper’s conclusions depend on it.
- Based: passes — The paper gives a reason why it holds.
It may state two separate claims as one.
In the paper
“An increasing number of genes involved in chromatin structure and epigenetic regulation have been implicated in a variety of developmental disorders.61”
§ Convergence of Genes and Cellular Pathways Dysregulated in Autism Spectrum Disorders > Discussion
What the sources say
- Not checked yetcites [61] Day, 2011, Epigenetic mechanisms in cognition, Neuron source
plaincorrelational- Asserted: passes — The authors put it forward as true.
- Checkable: passes — It can be checked against evidence.
- Load-bearing: fails — The paper’s conclusions may not depend on it.
- Based: passes — The paper gives a reason why it holds.
Probably not a substantial claim. The paper’s conclusions may not depend on it.
The paper relies on this without support.
Unrelated control subjects from SAGE, the Ontario Colorectal Cancer Case-Control Study, and HABC, who had no obvious psychiatric history, are valid controls for ASD CNV burden analyses.
“Unrelated control subjects were assembled from three studies in which individuals had no obvious psychiatric history: the Study of Addiction Genetics and Environment (SAGE),26 the Ontario Colorectal Cancer Case-Control Study,27,28 and Health, Aging, and Body Composition (HABC) (Table S1B).29”
The paper relies on this without support.
The published control de novo CNV datasets (unaffected siblings from the Simons Simplex Collection and Icelandic control trios) are comparable to the AGP affected subjects for CNV size and gene-content comparisons.
“Secondary analyses included comparisons of CNV number, length, and intersected gene number between our 102 de novo CNVs identified in affected subjects and the 76 de novo CNVs in control subjects of two published data sets: (1) 17 de novo CNVs identified in 15 unaffected siblings from 872 families with a single ASD-affected offspring and an unaffected sibling from the Simons Simplex Collection4”
The authors state this as an assumption.
If genomic regions are perturbed by genetic variants associated with the same phenotype, they will contain genes forming connected clusters.
“NETBAG identifies networks of genes under the premise that if genomic regions are perturbed by genetic variants associated with the same phenotype, they will contain genes forming connected clusters.”
The authors state this as an assumption.
Different genes harboring suspected causative mutations for the same disorder often physically interact.
“Under the assumption that different genes harboring suspected causative mutations for the same disorder often physically interact, we sought to evaluate protein-protein interactions (PPIs) encoded by genes known to be implicated in ASD and genes affected by rare CNVs or SNVs”
Claims other papers make about this one
Each is checked against this paper’s own text: does it say what the citing paper says it does?
In the citing paper
“Studies of large CNVs in ASD have shown that genes within ASD CNVs are highly connected with each other (Corominas et al., 2014) and with other ASD genes (Pinto et al., 2014).”
From Getting to the cores of autism (2019) · cites this paper as Pinto et al., 2014
In the citing paper
“(iv) Pinto et al.33 compiled a list of 124 genes (ASD [Pinto]) that have been implicated in ASD and was updated from a list provided by Betancur in 2011 (ref. 55). All of the 124 genes have also been implicated in ID.”
From Transcriptome analysis reveals dysregulation of innate immune response genes and neuronal activity-dependent genes in autism (2014) · cites this paper as [33]
In the citing paper
“Subsets of human genes have been previously identified as “missense constrained” (based on a lack of functional coding variation in controls) or “loss-of-function intolerant” (based on a smaller-than-expected number of loss-of-function mutations in population-scale data)13,21.”
From Increased burden of ultra-rare protein-altering variants among 4,877 individuals with schizophrenia (2016) · cites this paper as [21]
In the citing paper
“Consistently, studies on hcASD genes and iPSC-derived ASD neurons highlight signaling pathways that are commonly disrupted, such as PI3K/AKT [79, 80], RAS/ERK [79, 80, 82, 83], WNT and β-catenin [57, 83, 84].”
From The ASD Living Biology: from cell proliferation to clinical phenotype (2019) · cites this paper as [79]
Self-check
Percentages, sums and reported differences re-computed from the paper’s own numbers.
Rated minor: it would not touch a result — a value no result rests on, a p-value that stays on the same side of the significance level, or a conflict that is clerical, resolved elsewhere in the paper, or outside its own findings.
In the paper
“The control data set used in the primary CNV analysis was composed of 2,640 control individuals of European ancestry (1,241 males and 1,399 females) who passed QC (Table S1B). Secondary analyses included 1,843 subjects from other ancestries (SAGE and HABC non-European control individuals), giving a total of 4,768 control subjects of all ancestries.”
§ Convergence of Genes and Cellular Pathways Dysregulated in Autism Spectrum Disorders > Subjects and Methods > Control Subjects
Reported 4768 · recomputed 4483
Citations
Cites
Lord, C., Rutter, M., & Le Couteur, A. (1994) · Journal of Autism and Developmental Disorders · doi:10.1007/bf02172145 · Cited by 9,065
Self-citationSporadic autism exomes reveal a highly interconnected protein network of de novo mutations
O’Roak, B. J., Vives, L., Girirajan, S., Karakoc, E., Krumm, N., Coe, B. P., Levy, R., Ko, A., Lee, C., Smith, J. D., et al. (2012) · Nature · doi:10.1038/nature10989 · Cited by 2,165
Self-citationDe novo mutations revealed by whole-exome sequencing are strongly associated with autism
Sanders, S. J., Murtha, M. T., Gupta, A. R., Murdoch, J. D., Raubeson, M. J., Willsey, A. J., Ercan-Sencicek, A. G., DiLullo, N. M., Parikshak, N. N., Stein, J. L., et al. (2012) · Nature · doi:10.1038/nature10945 · Cited by 2,084
FMRP Stalls Ribosomal Translocation on mRNAs Linked to Synaptic Function and Autism
Darnell, J. C., Van Driesche, S. J., Zhang, C., Hung, K. Y. S., Mele, A., Fraser, C. E., Stone, E. F., Chen, C., Fak, J. J., Chi, S. W., et al. (2011) · Cell · doi:10.1016/j.cell.2011.06.013 · Cited by 2,072
Lord, C., Rutter, M., Goode, S., Heemsbergen, J., Jordan, H., Mawhood, L., & Schopler, E. (1989) · Journal of Autism and Developmental Disorders · doi:10.1007/bf02211841 · Cited by 2,030
Self-citationFunctional impact of global rare copy number variation in autism spectrum disorders
Pinto, D., Pagnamenta, A. T., Klei, L., Anney, R., Merico, D., Regan, R., Conroy, J., Magalhaes, T. R., Correia, C., Abrahams, B. S., et al. (2010) · Nature · doi:10.1038/nature09146 · Cited by 2,013 · cited 4×
“The second phase was divided in two stages; the results of stage 1, involving the first half of the families, were published in 2010.(6,20) In stage 2, we genotyped the remaining families (n 1⁄4 1,604) for a total of over 2,845 families and performed genomewide CNV (this study) and association studies.”
BackgroundMethodInfluentialSelf-citationGenome-wide association study identifies five new schizophrenia loci
The Schizophrenia Psychiatric Genome-Wide Association Study (GWAS) Consortium (2011) · Nature Genetics · doi:10.1038/ng.940 · Cited by 1,919
Structural Variation of Chromosomes in Autism Spectrum Disorder
Marshall, C. R., Noor, A., Vincent, J. B., Lionel, A. C., Feuk, L., Skaug, J., Shago, M., Moessner, R., Pinto, D., Ren, Y., et al. (2008) · The American Journal of Human Genetics · doi:10.1016/j.ajhg.2007.12.009 · Cited by 1,815
Self-citationPatterns and rates of exonic de novo mutations in autism spectrum disorders
Neale, B. M., Kou, Y., Liu, L., Ma’ayan, A., Samocha, K. E., Sabo, A., Lin, C.-F., Stevens, C., Wang, L.-S., Makarov, V., et al. (2012) · Nature · doi:10.1038/nature11011 · Cited by 1,734
Self-citationDiagnostic exome sequencing in persons with severe intellectual disability
de Ligt, J., Willemsen, M. H., van Bon, B. W. M., Kleefstra, T., Yntema, H. G., Kroes, T., Vulto-van Silfhout, A. T., Koolen, D. A., de Vries, P., Gilissen, C., et al. (2012) · New England Journal of Medicine · doi:10.1056/nejmoa1206524 · Cited by 1,546
Cited by
Sorted by citations
Synaptic, transcriptional and chromatin genes disrupted in autism
Study, T. D., De Rubeis, S., Autism, H. M. C. F., UK10K Consortium, The Autism Sequencing Consortium, He, X., Goldberg, A. P., Poultney, C. S., Samocha, K., Ercument Cicek, A., et al. (2014) · Nature · doi:10.1038/nature13772 · Cited by 2,746
Self-citationReimand, J., Isserlin, R., Voisin, V., Kucera, M., Tannus-Lopes, C., Rostamianfar, A., Wadi, L., Meyer, M., Wong, J., Xu, C., et al. (2019) · Nature Protocols · doi:10.1038/s41596-018-0103-9 · Cited by 1,970
Self-citationLord, C., Brugha, T. S., Charman, T., Cusack, J., Dumas, G., Frazier, T., Jones, E. J. H., Jones, R. M., Pickles, A., State, M. W., et al. (2020) · Nature Reviews Disease Primers · doi:10.1038/s41572-019-0138-4 · Cited by 1,859
Self-citationInsights into autism spectrum disorder genomic architecture and biology from 71 risk loci
Sanders, S. J., He, X., Willsey, A. J., Ercan-Sencicek, A. G., Samocha, K. E., Cicek, A. E., Murtha, M. T., Bal, V. H., Bishop, S. L., Dong, S., et al. (2015) · Neuron · doi:10.1016/j.neuron.2015.09.016 · Cited by 1,430
Self-citationMost genetic risk for autism resides with common variation
Gaugler, T., Klei, L., Sanders, S. J., Bodea, C. A., Goldberg, A. P., Lee, A. B., Mahajan, M., Manaa, D., Pawitan, Y., Reichert, J., et al. (2014) · Nature Genetics · doi:10.1038/ng.3039 · Cited by 1,239
Self-citation
Metadata
- Authors
- Pinto, D., Delaby, E., Merico, D., Barbosa, M., Merikangas, A., Klei, L., Thiruvahindrapuram, B., Xu, X., Ziman, R., Wang, Z., Vorstman, J. A. S., Thompson, A., Regan, R., Pilorge, M., Pellecchia, G., Pagnamenta, A. T., Oliveira, B., Marshall, C. R., Magalhaes, T. R., Lowe, J. K., Howe, J. L., Griswold, A. J., Gilbert, J., Duketis, E., Dombroski, B. A., De Jonge, M. V., Cuccaro, M., Crawford, E. L., Correia, C. T., Conroy, J., Conceição, I. C., Chiocchetti, A. G., Casey, J. P., Cai, G., Cabrol, C., Bolshakova, N., Bacchelli, E., Anney, R., Gallinger, S., Cotterchio, M., Casey, G., Zwaigenbaum, L., Wittemeyer, K., Wing, K., Wallace, S., van Engeland, H., Tryfon, A., Thomson, S., Soorya, L., Rogé, B., Roberts, W., Poustka, F., Mouga, S., Minshew, N., McInnes, L. A., McGrew, S. G., Lord, C., Leboyer, M., Le Couteur, A. S., Kolevzon, A., Jiménez González, P., Jacob, S., Holt, R., Guter, S., Green, J., Green, A., Gillberg, C., Fernandez, B. A., Duque, F., Delorme, R., Dawson, G., Chaste, P., Café, C., Brennan, S., Bourgeron, T., Bolton, P. F., Bölte, S., Bernier, R., Baird, G., Bailey, A. J., Anagnostou, E., Almeida, J., Wijsman, E. M., Vieland, V. J., Vicente, A. M., Schellenberg, G. D., Pericak-Vance, M., Paterson, A. D., Parr, J. R., Oliveira, G., Nurnberger, J. I., Monaco, A. P., Maestrini, E., Klauck, S. M., Hakonarson, H., Haines, J. L., Geschwind, D. H., Freitag, C. M., Folstein, S. E., Ennis, S., Coon, H., Battaglia, A., Szatmari, P., Sutcliffe, J. S., Hallmayer, J., Gill, M., Cook, E. H., Buxbaum, J. D., Devlin, B., Gallagher, L., Betancur, C., & Scherer, S. W.
- Affiliations
- Icahn School of Medicine at Mount Sinai (US)
- Centre National de la Recherche Scientifique (FR)
- Hospital for Sick Children (CA)
- Trinity College Dublin (IE)
- University of Pittsburgh (US)
- University Medical Center Utrecht (NL)
- McMaster University (CA)
- University College Dublin (IE)
- Centre for Human Genetics (GB)
- University of Lisbon (PT)
- University of Toronto (CA)
- University of California, Los Angeles (US)
- University of Miami (US)
- Goethe University Frankfurt (DE)
- University of Pennsylvania (US)
- Vanderbilt University (US)
- University of Bologna (IT)
- Cancer Care Ontario (CA)
- University of Southern California (US)
- University of Alberta (CA)
- University of Birmingham (GB)
- Warneford Hospital (GB)
- Laboratoire de NeuroPsychoLinguistique (FR)
- Unidade Local de Saúde de Coimbra (PT)
- Weill Cornell Medical Center (US)
- Inserm (FR)
- University of Minnesota (US)
- University of Illinois Chicago (US)
- Manchester Academic Health Science Centre (GB)
- University of Gothenburg (SE)
- Memorial University of Newfoundland (CA)
- King's College London (GB)
- University of Washington (US)
- Nationwide Children's Hospital (US)
- Newcastle University (GB)
- Tufts University (US)
- German Cancer Research Center (DE)
- Children's Hospital of Philadelphia (US)
- University of Utah (US)
- Stanford Medicine (US)
- Corresponding author
- Betancur, Catalina
- Scherer, Stephen W.
- ORCID
- Pinto, Dalila
- Merico, Daniele
- Barbosa, Mafalda
- Merikangas, Alison
- Klei, Lambertus
- Thiruvahindrapuram, Bhooma
- Xu, Xiao
- Wang, Zhuozhi
- Vorstman, Jacob A.S.
- Pellecchia, Giovanna
- Pagnamenta, Alistair T.
- Oliveira, Bárbara
- Marshall, Christian R.
- Lowe, Jennifer K.
- Griswold, Anthony J.
- Gilbert, John
- Dombroski, Beth A.
- Cuccaro, Michael
- Correia, Catarina T.
- Conceição, Inês C.
- Chiocchetti, Andreas G.
- Casey, Jillian P.
- Bolshakova, Nadia
- Bacchelli, Elena
- Anney, Richard
- Cotterchio, Michelle
- Casey, Graham
- Zwaigenbaum, Lonnie
- Wallace, Simon
- Soorya, Latha
- Mouga, Susana
- Minshew, Nancy
- McInnes, L. Alison
- Lord, Catherine
- Leboyer, Marion
- Kolevzon, Alexander
- Jacob, Suma
- Guter, Stephen
- Green, Jonathan
- Green, Andrew
- Gillberg, Christopher
- Fernandez, Bridget A.
- Duque, Frederico
- Delorme, Richard
- Chaste, Pauline
- Bourgeron, Thomas
- Bolton, Patrick F.
- Bölte, Sven
- Bernier, Raphael
- Baird, Gillian
- Anagnostou, Evdokia
- Almeida, Joana
- Wijsman, Ellen M.
- Vieland, Veronica J.
- Vicente, Astrid M.
- Schellenberg, Gerard D.
- Paterson, Andrew D.
- Parr, Jeremy R.
- Oliveira, Guiomar
- Monaco, Anthony P.
- Maestrini, Elena
- Hakonarson, Hakon
- Haines, Jonathan L.
- Geschwind, Daniel H.
- Freitag, Christine M.
- Ennis, Sean
- Coon, Hilary
- Battaglia, Agatino
- Sutcliffe, James S.
- Hallmayer, Joachim
- Gill, Michael
- Cook, Edwin H.
- Buxbaum, Joseph D.
- Devlin, Bernie
- Gallagher, Louise
- Betancur, Catalina
- Scherer, Stephen W.
- Venue
- The American Journal of Human Genetics
- Publisher
- Elsevier BV
- Published
- 2014-05
- Volume
- 94
- Issue
- 5
- Pages
- 677-694
- ISSN
- 0002-9297 (ISSN-L)
- PMC
- PMC4067558
- OpenAlex
- W2129867386
- Semantic Scholar
- 243b54688dac51ccb4b409e63029323c9858f738
- Cited by
- 969
- References
- 66
- Citations by year
- 2026: 26 · 2025: 35 · 2024: 62 · 2023: 63 · 2022: 80 · 2021: 98 · 2020: 100 · 2019: 91 · 2018: 80 · 2017: 100 · 2016: 102 · 2015: 92 · 2014: 40
- FWCI
- 62.30
- Type
- journal article
- Language
- en
- Open access
- hybrid
- doi.org
- Licence
- Locations
- The American Journal of Human Genetics (publishedVersion, cc-by-nc-nd)
- PubMed Central (publishedVersion, cc-by-nc-nd)
- PubMed (publishedVersion)
- ENLIGHTEN (Jurnal Bimbingan dan Konseling Islam) (acceptedVersion)
- Arrow@dit (Dublin Institute of Technology) (submittedVersion)
- HAL (submittedVersion, other-oa)
- Portuguese National Funding Agency for Science, Research and Technology (RCAAP Project by FCT) (submittedVersion, other-oa)
- Archivio istituzionale della ricerca (Alma Mater Studiorum Università di Bologna) (submittedVersion)
- eScholarship (California Digital Library) (submittedVersion, cc-by-nc-nd)
- ORCA Online Research @Cardiff (Cardiff University) (submittedVersion)
- Research Portal (King's College London) (submittedVersion, other-oa)
- Publication Server of Goethe University Frankfurt am Main (Goethe University Frankfurt) (submittedVersion, cc-by-nc-nd)
- Research Explorer (The University of Manchester) (submittedVersion)
- Portuguese National Funding Agency for Science, Research and Technology (RCAAP Project by FCT) (submittedVersion)
- IUScholarWorks (Indiana University) (submittedVersion, cc-by-nc-nd)
- PMC
- Newcastle University ePrints (Newcastle Univesity) (cc-by-nc-nd)
- Funders
- Brain and Behavior Research Foundation
- Medical Research Council
- Genome Canada
- Hospital for Sick Children
- National Alliance for Research on Schizophrenia and Depression
- Health Research Board (AUT/2006/1, AUT/2006/2, PD/2006/48)
- Ontario Genomics Institute
- Canadian Institutes of Health Research
- Topics
- Life Sciences › Neuroscience › Cognitive Neuroscience › Autism Spectrum Disorder Research
- Life Sciences › Biochemistry, Genetics and Molecular Biology › Genetics › Genetics and Neurodevelopmental Disorders
- Life Sciences › Biochemistry, Genetics and Molecular Biology › Genetics › Genomic variations and chromosomal abnormalities
- Keywords
- autism spectrum disorder, copy number variation, de novo CNVs, intellectual disability, CHD2, HDAC4, GDI1, SETD5, microRNA-137, HDAC9, neuronal signaling, synaptic function, chromatin regulation, gene networks
- MeSH terms
- Child, Child Development Disorders, Pervasive, Female, Multigene Family, Humans, Male, Pedigree, Sequence Deletion, Gene Regulatory Networks, Metabolic Networks and Pathways, DNA Copy Number Variations
About these checks
Registry, retraction, Cites and statistics results are computed, not judged, with one exception: a printed reference that no index lists is read once by a model before it counts as a citation error. Claims are extracted by a model and kept only when their quote appears verbatim in the text; each cited source is then checked, with a model’s help, for whether it says what the claim relies on. Those verdicts can be wrong — read the claim’s quote and the cited source before relying on one.
A language model drew the claims from the paper on 2026-10-06, under version 3 of the claim definition (model deepseek-v4.1-flash, prompt extract-v3).
A second model labelled each claim on 2026-10-06 (model jev-1.13-20260917, definition revision gold-guideline-v0.2).
Statistics and arithmetic are recomputed, not judged.
Confidence bands are shown only for fields calibrated on our annotated test set. None is calibrated yet, so no band is shown.
What counts as a claim ›How we measure confidence ›How we check this ›
Are you an author, or do you see a problem with this page? Request a review
