

The DOI matches its Crossref record; 42 of the 42 references it cites were found in a registry or an index.
Freshwater use of the energy sector in Africa
Abstract
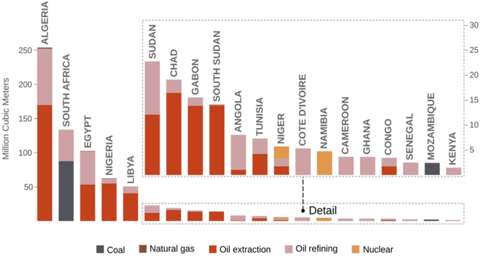
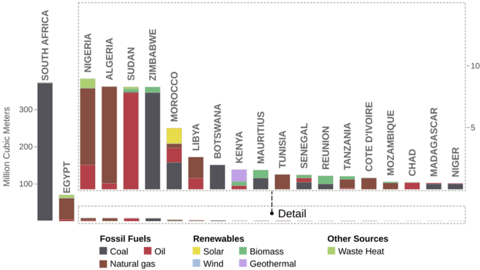
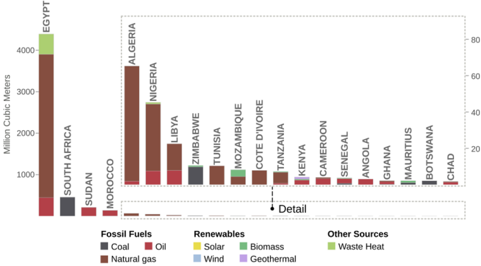
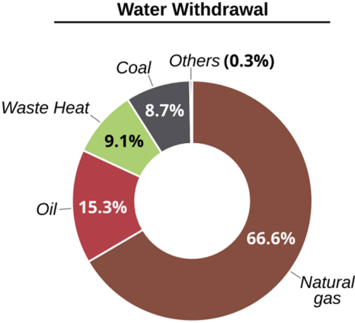
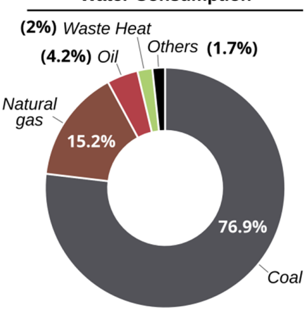
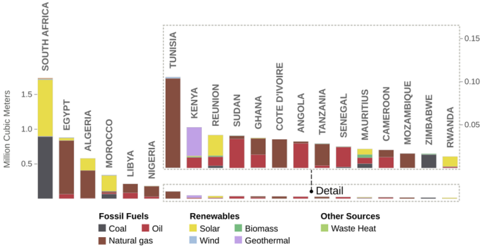
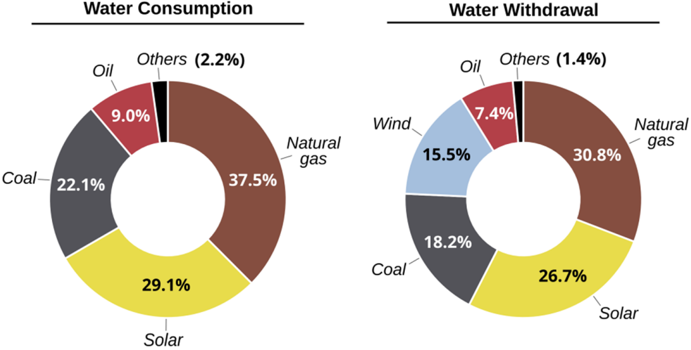
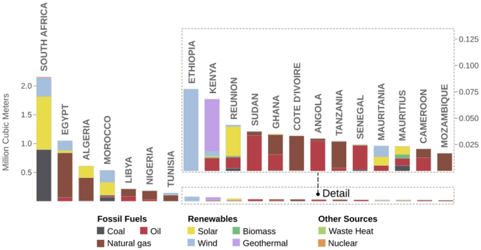
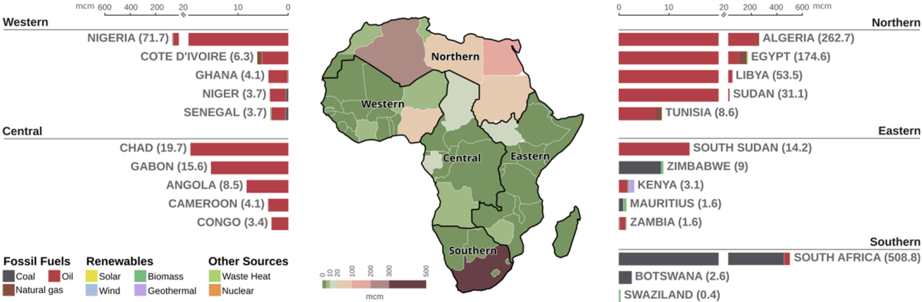
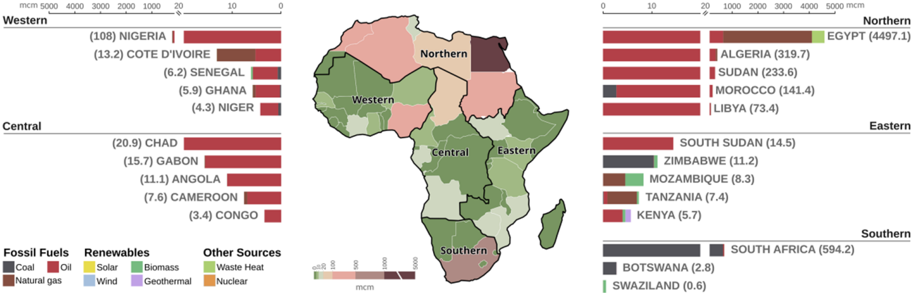
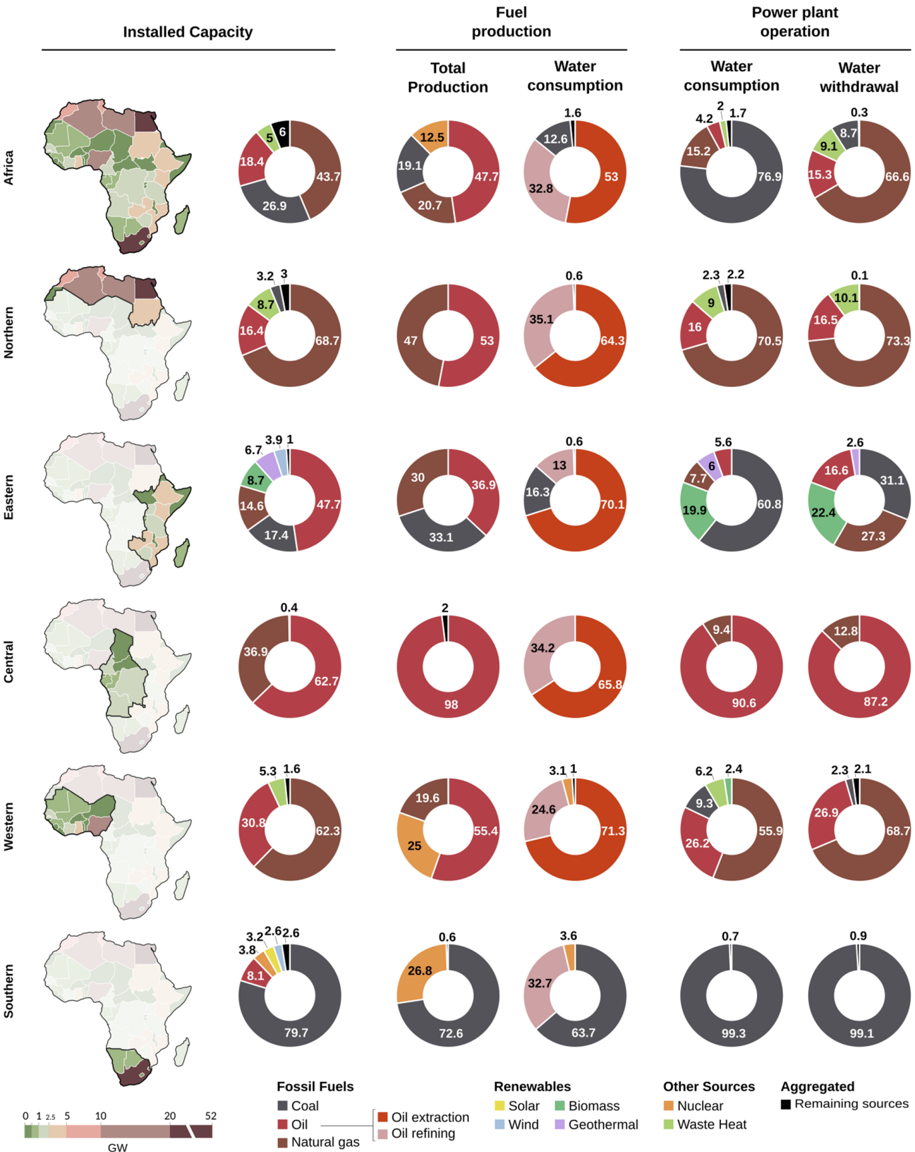
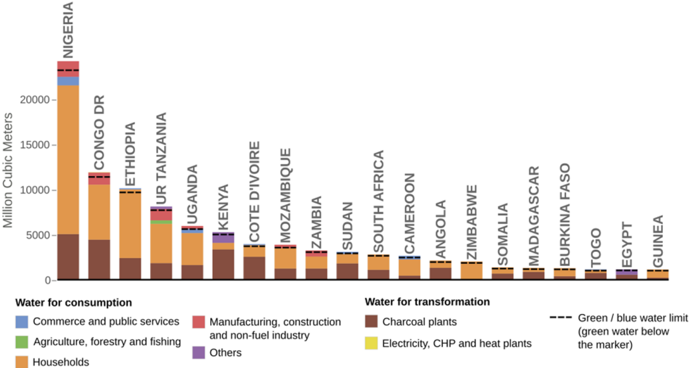
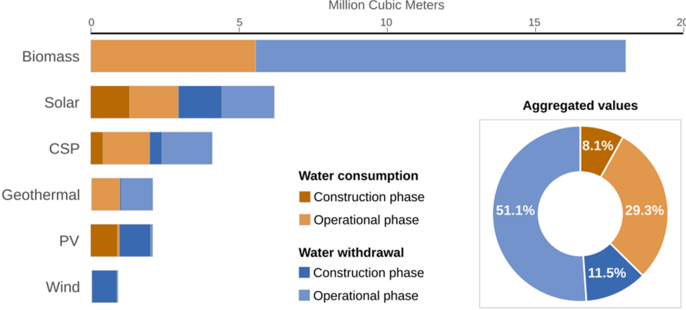
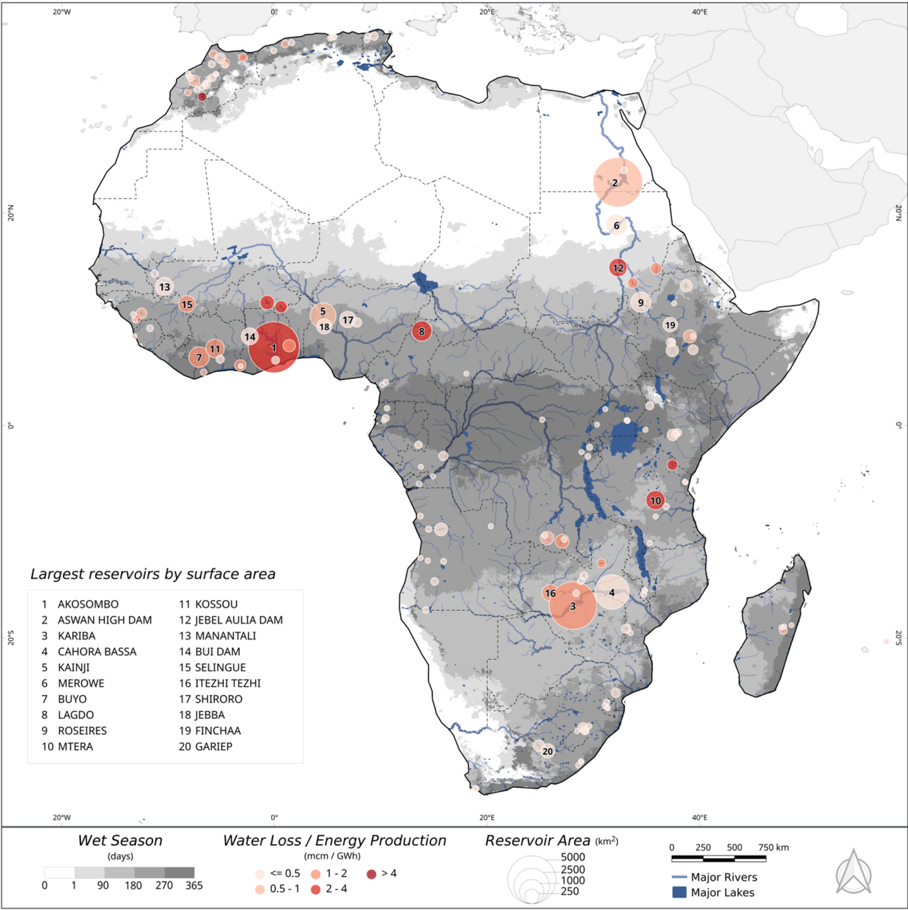
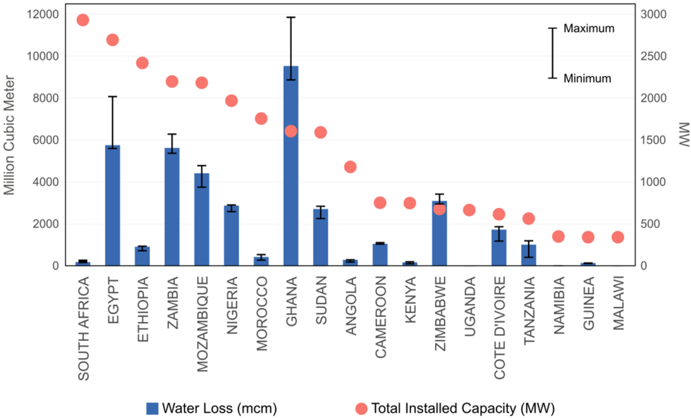
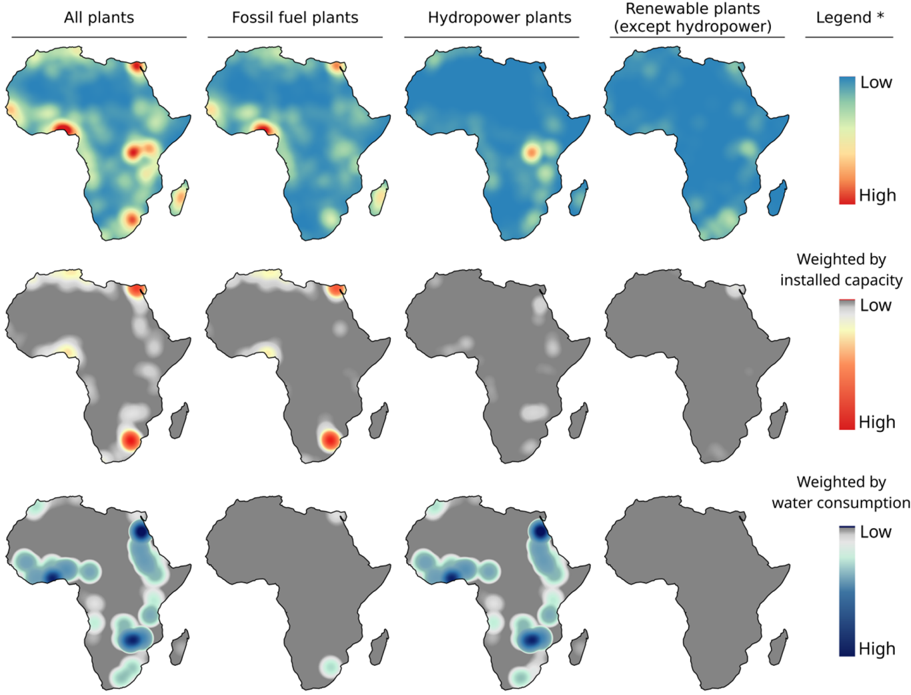
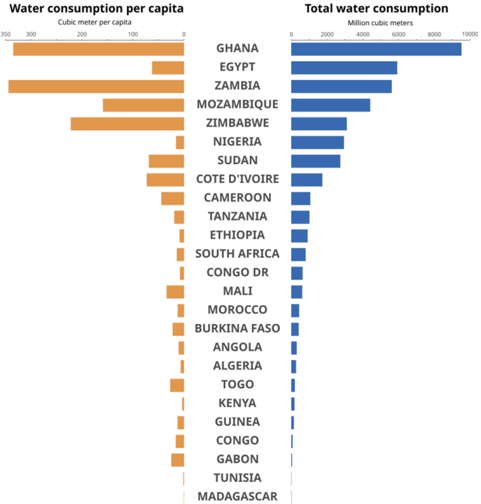
The fast economic and population growth in the African continent will lead to an important increase in demand for energy and water resources. Unfortunately, very few studies have addressed water use for energy production in Africa. This study focuses on water consumption and withdrawals throughout the different stages of energy production (fuel production, power plant construction and operation) in African countries. An in-depth analysis of water loss through evaporation in hydropower reservoirs is also performed due to the important role it plays in many countries and its severe impacts on electricity generation during the increasingly frequent droughts in Africa. The results indicate that in the year 2016, a total of 42 billion cubic meters of water was lost through evaporation in hydropower reservoirs compared to 1.2 billion cubic meters from all the other fuel types combined. Oil extraction and refining dominate water use for fuel production and non-hydro renewable energies have an almost negligible impact on the overall water use (10 million cubic meters). Fuelwood is shown to be a high consumer of water accounting for 4.5 billion cubic meters. The use of non-hydro renewable energies instead of fossil fuels can contribute significantly to reduce water use while covering the growing energy needs in Africa. Modern technologies that substitute fuelwood use in households would also reduce the impacts on water resources. The hydropower potential remains largely untapped in several regions of the continent. Nevertheless, new hydropower developments need to be carefully considered especially in regions characterized by severe water scarcity.
Overview
The claims and statistics of this paper haven’t been checked yet.
Run the check — free, no account needed. It reads the open-access text and checks the sources it cites.
Integrity signals
Registry
Cites
Statistics
Figures
Verification
Claims the paper makes
The claims and statistics of this paper haven’t been checked yet.
Run the check — free, no account needed. It reads the open-access text and checks the sources it cites.
Claims other papers make about this one
Each is checked against this paper’s own text: does it say what the citing paper says it does?
The cited source doesn’t support the claim as written.
In the citing paper
“hydropower, where Africa's deep, high-head reservoirs yield 𝑤 𝑘 = 5 . 32 L/kWh [39] versus global estimates of ∼ 22 L/kWh [27]”
From A Water Efficiency Dataset for African Data Centers (2025) · cites this paper as [39]
Checked by a reasoning model — may be wrong.
Experimental — accuracy not yet measuredThe source backs part of the claim, not all of it — or backs it for a different population, condition or comparison.
In the citing paper
“which has the highest water intensity due to reservoir evaporation [27, 39].”
From A Water Efficiency Dataset for African Data Centers (2025) · cites this paper as [39]
Experimental — accuracy not yet measured
Self-check
Percentages, sums and reported differences re-computed from the paper’s own numbers.
The self-check needs the paper’s full text.
Citations
Cites
Google Earth Engine: Planetary-scale geospatial analysis for everyone
Gorelick, N., Hancher, M., Dixon, M., Ilyushchenko, S., Thau, D., & Moore, R. (2017) · Remote Sensing of Environment · doi:10.1016/j.rse.2017.06.031 · Cited by 14,719
Funk, C. C., Peterson, P. J., Landsfeld, M. F., Pedreros, D. H., Verdin, J. P., Shukla, S., Husak, G. J., Rowland, J., Harrison, L., Hoell, A., et al. (2015) · Scientific Data · doi:10.1038/sdata.2015.66 · Cited by 6,812
High-resolution mapping of global surface water and its long-term changes
Pekel, J.-F., Cottam, A., Gorelick, N., & Belward, A. S. (2016) · Nature · doi:10.1038/nature20584 · Cited by 5,513
High‐resolution mapping of the world's reservoirs and dams for sustainable river‐flow management
Lehner, B., Liermann, C. R., Revenga, C., Vörösmarty, C., Fekete, B., Crouzet, P., Döll, P., Endejan, M., Frenken, K., Magome, J., et al. (2011) · Frontiers in Ecology and the Environment · doi:10.1890/100125 · Cited by 2,515
Estimated use of water in the United States in 2005
Kenny, J. F., Barber, N. L., Hutson, S. S., Linsey, K. S., Lovelace, J. K., & Maupin, M. A. (2009) · Circular · doi:10.3133/cir1344 · Cited by 1,070
Estimated use of water in the United States in 2015
Dieter, C. A., Maupin, M. A., Caldwell, R. R., Harris, M. A., Ivahnenko, T. I., Lovelace, J. K., Barber, N. L., & Linsey, K. S. (2018) · Circular · doi:10.3133/cir1441 · Cited by 755
International Energy Agency (2014) · World energy outlook · doi:10.1787/weo-2014-en · Cited by 663
Macknick, J., Newmark, R., Heath, G., & Hallett, K. C. (2012) · Environmental Research Letters · doi:10.1088/1748-9326/7/4/045802 · Cited by 631
Flörke, M., Kynast, E., Bärlund, I., Eisner, S., Wimmer, F., & Alcamo, J. (2013) · Global Environmental Change · doi:10.1016/j.gloenvcha.2012.10.018 · Cited by 580
Gleick, P. H. (1994) · Annual Review of Energy and the Environment · doi:10.1146/annurev.eg.19.110194.001411 · Cited by 500
Research works printed but not linked: 2
- IEA. World energy balances; 2018. https://www.oecd-ilibrary.org/energy/data/iea-world-energy-statistics-and-balances/world-energy-balances_data-00512-en [accessed September 15, 2018].
- FAO, 2005, Irrigation in Africa in figures, AQUASTAT Survey, 29
Cited by
A Water Efficiency Dataset for African Data Centers
Shumba, N., Tshekiso, O., Li, P., Fanti, G., & Ren, S. (2025) · Proceedings of the ACM SIGCAS/SIGCHI Conference on Computing and Sustainable Societies · doi:10.1145/3715335.3735483 · Cited by 10
Metadata
- Authors
- Gonzalez Sanchez, R., Seliger, R., Fahl, F., De Felice, L., Ouarda, T. B. M. J., & Farinosi, F.
- Venue
- Applied Energy
- Publisher
- Elsevier BV
- Published
- 2020-07
- Volume
- 270
- Pages
- 115171
- ISSN
- 0306-2619
- Cited by
- 36
- References
- 42
- Language
- en
- Licence
- www.elsevier.com/tdm/userlicense/1.0/ (tdm)
- www.elsevier.com/legal/tdmrep-license (tdm)
- creativecommons.org/licenses/by/4.0/ (vor)
- Funders
- Joint Research Centre
About these checks
Registry, retraction, Cites and statistics results are computed, not judged, with one exception: a printed reference that no index lists is read once by a model before it counts as a citation error. Claims are extracted by a model and kept only when their quote appears verbatim in the text; each cited source is then checked, with a model’s help, for whether it says what the claim relies on. Those verdicts can be wrong — read the claim’s quote and the cited source before relying on one.
Statistics and arithmetic are recomputed, not judged.
Confidence bands are shown only for fields calibrated on our annotated test set. None is calibrated yet, so no band is shown.
What counts as a claim ›How we measure confidence ›How we check this ›
Are you an author, or do you see a problem with this page? Request a review
Data sources
Bibliographic data: Semantic Scholar, OpenAlex, Crossref.
Contains information from the Semantic Scholar Academic Graph Datasets, made available under the ODC Attribution License (ODC-BY 1.0).
Semantic Scholar’s data is described in: Kinney, R., et al. (2023). The Semantic Scholar Open Data Platform. arXiv:2301.10140.
