

The DOI matches its Crossref record; 37 of the 38 references it cites were found in a registry or an index.
SHP2 inhibition triggers anti-tumor immunity and synergizes with PD-1 blockade
Open accessAbstract
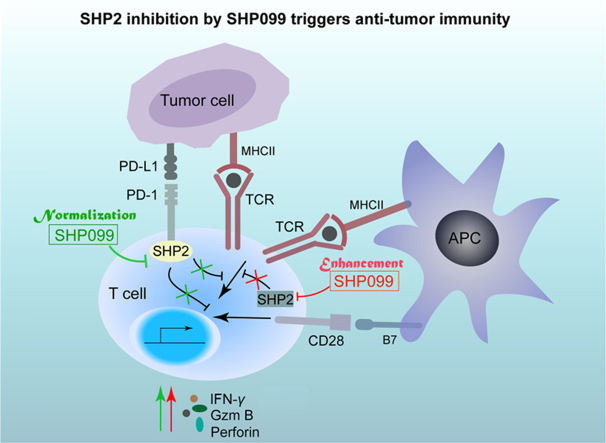
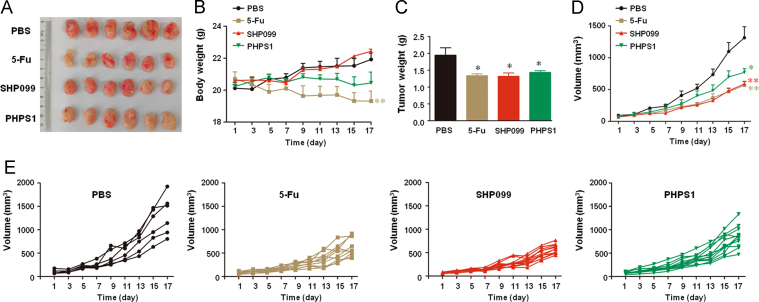
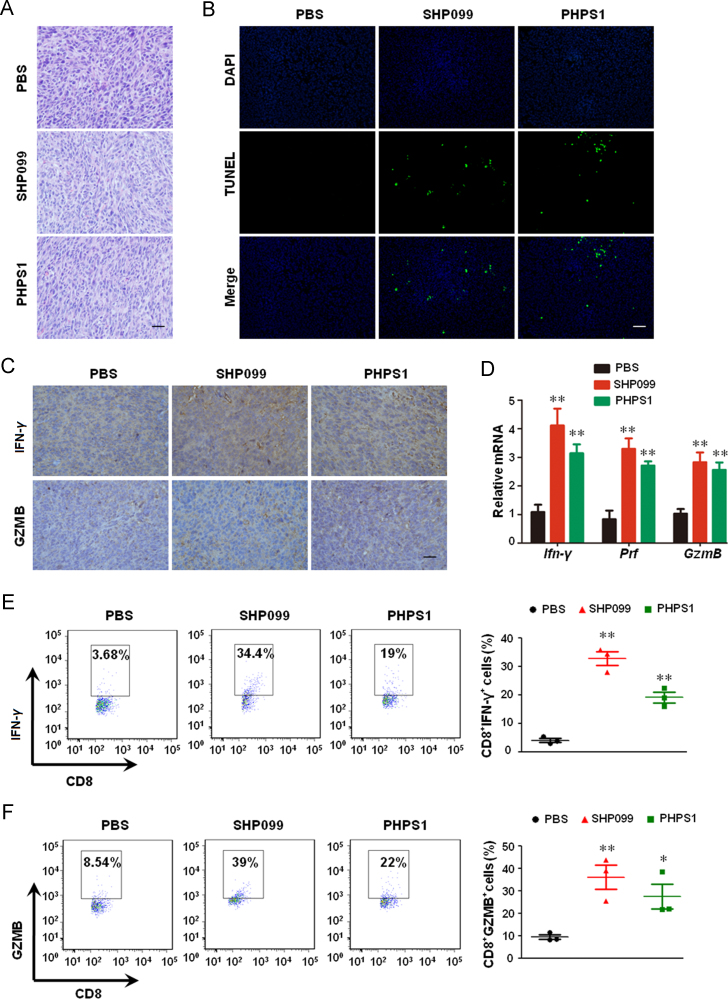
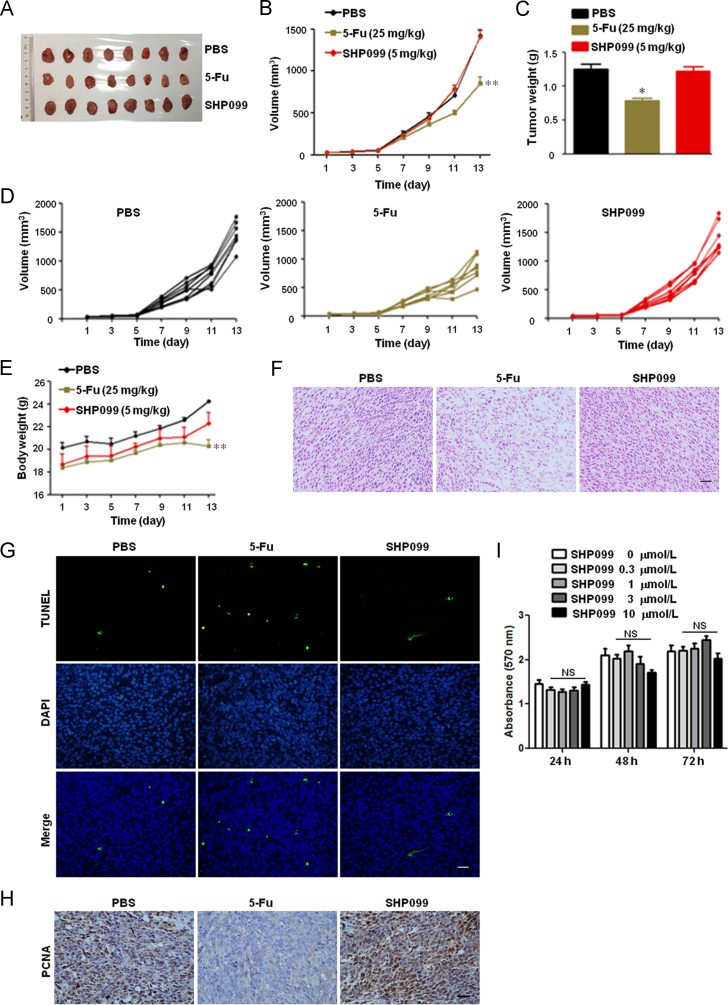
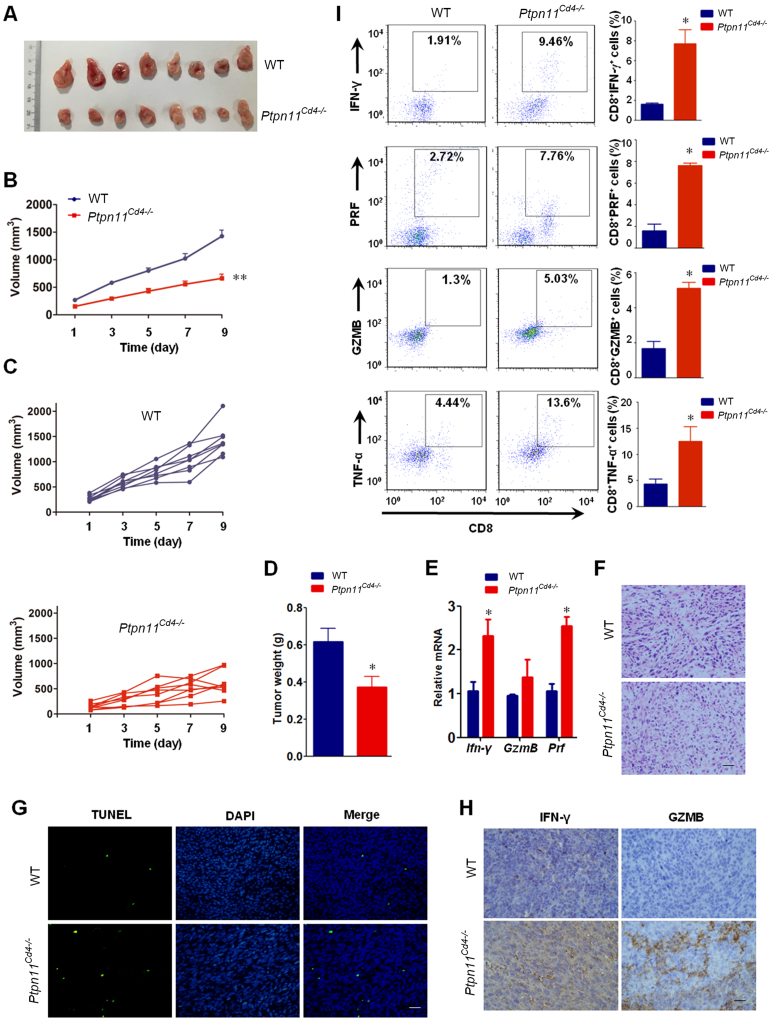
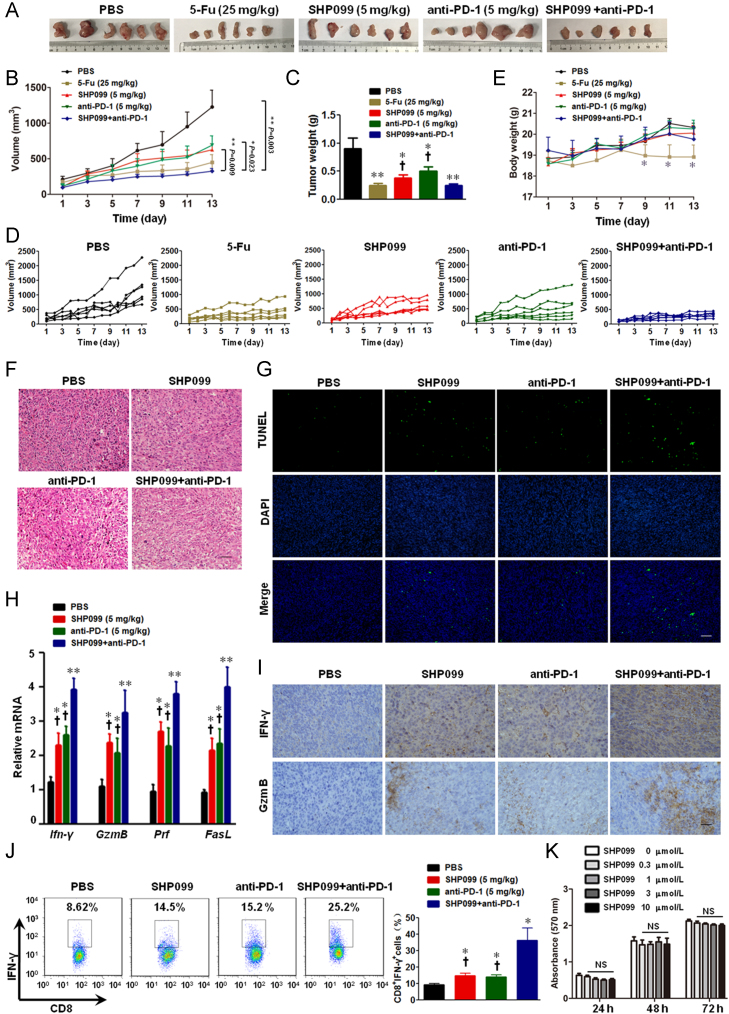
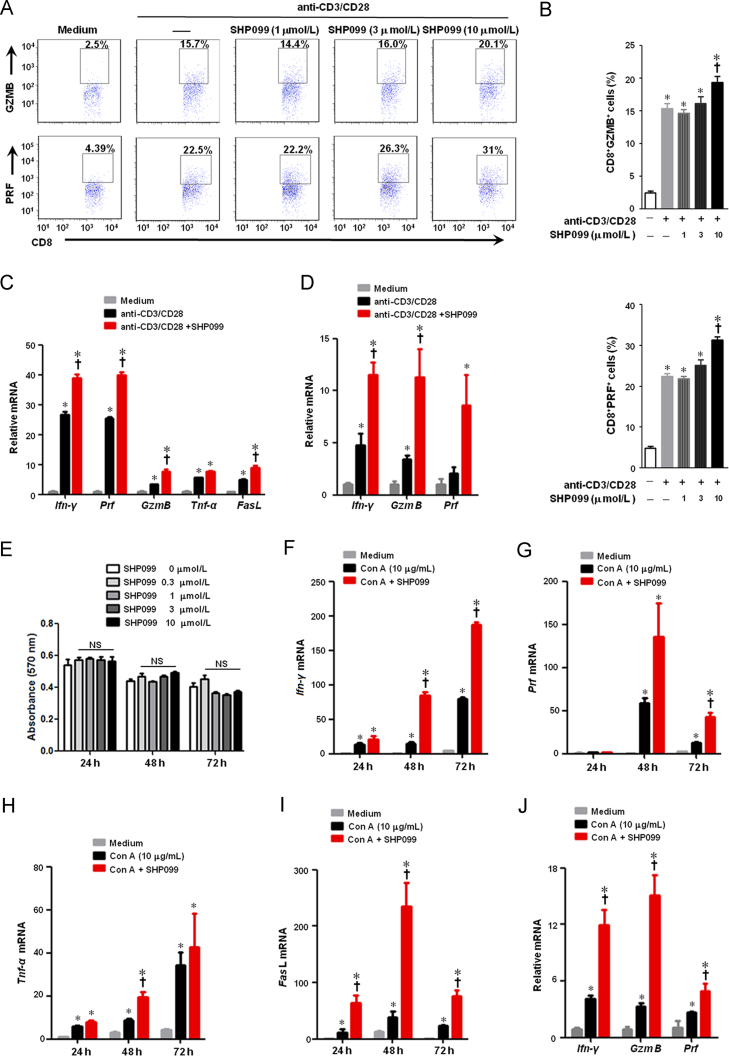
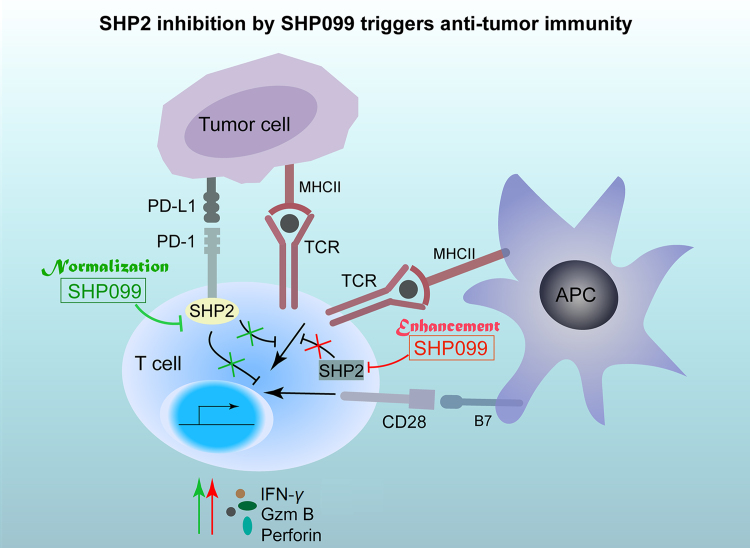
Tyrosine phosphatase SHP2 is a promising drug target in cancer immunotherapy due to its bidirectional role in both tumor growth promotion and T-cell inactivation. Its allosteric inhibitor SHP099 is known to inhibit cancer cell growth both in vitro and in vivo. However, whether SHP099-mediated SHP2 inhibition retards tumor growth in vivo via anti-tumor immunity remains elusive. To address this, a CT-26 colon cancer xenograft model was established in mice since this cell line is insensitive to SHP099. Consequently, SHP099 minimally affected CT-26 tumor growth in immuno-deficient nude mice, but significantly decreased the tumor burden in CT-26 tumor-bearing mice with intact immune system. SHP099 augmented anti-tumor immunity, as shown by the elevated proportion of CD8+IFN-γ+ T cells and the upregulation of cytotoxic T-cell related genes including Granzyme B andPerforin, which decreased the tumor load. In addition, tumor growth in mice with SHP2-deficient T-cells was markedly slowed down because of enhanced anti-tumor responses. Finally, the combination of SHP099 and anti-PD-1 antibody showed a higher therapeutic efficacy than either monotherapy in controlling tumor growth in two colon cancer xenograft models, indicating that these agents complement each other. Our study suggests that SHP2 inhibitor SHP099 is a promising candidate drug for cancer immunotherapy.
Overview
The claims and statistics of this paper haven’t been checked yet.
Run the check — free, no account needed. It reads the open-access text and checks the sources it cites.
Integrity signals
Registry
Cites
Statistics
Figures
Verification
Claims the paper makes
The claims and statistics of this paper haven’t been checked yet.
Run the check — free, no account needed. It reads the open-access text and checks the sources it cites.
Claims other papers make about this one
Each is checked against this paper’s own text: does it say what the citing paper says it does?
In the citing paper
“SHP2 inhibitor enhanced the efficacy of α-PD-1 in murine tumor models [252–254].”
From Combination strategies with PD-1/PD-L1 blockade: current advances and future directions (2022) · cites this paper as [254]
Self-check
Percentages, sums and reported differences re-computed from the paper’s own numbers.
The self-check needs the paper’s full text.
Citations
Cites
PD-1 and PD-L1 Immune Checkpoint Blockade to Treat Breast Cancer
Hartkopf, A. D., Taran, F., Wallwiener, M., Walter, C. B., Krämer, B., Grischke, E., & Brucker, S. Y. (2016) · Breast Care · doi:10.1159/000453569 · Cited by 30,989
The blockade of immune checkpoints in cancer immunotherapy
Pardoll, D. M. (2012) · Nature Reviews Cancer · doi:10.1038/nrc3239 · Cited by 13,838
Molecular mechanisms of T cell co-stimulation and co-inhibition
Chen, L., & Flies, D. B. (2013) · Nature Reviews Immunology · doi:10.1038/nri3405 · Cited by 3,114
CTLA-4 and PD-1 Receptors Inhibit T-Cell Activation by Distinct Mechanisms
Parry, R. V., Chemnitz, J. M., Frauwirth, K. A., Lanfranco, A. R., Braunstein, I., Kobayashi, S. V., Linsley, P. S., Thompson, C. B., & Riley, J. L. (2005) · Molecular and Cellular Biology · doi:10.1128/mcb.25.21.9543-9553.2005 · Cited by 1,931
T cell costimulatory receptor CD28 is a primary target for PD-1–mediated inhibition
Hui, E., Cheung, J., Zhu, J., Su, X., Taylor, M. J., Wallweber, H. A., Sasmal, D. K., Huang, J., Kim, J. M., Mellman, I., et al. (2017) · Science · doi:10.1126/science.aaf1292 · Cited by 1,689
Yokosuka, T., Takamatsu, M., Kobayashi-Imanishi, W., Hashimoto-Tane, A., Azuma, M., & Saito, T. (2012) · Journal of Experimental Medicine · doi:10.1084/jem.20112741 · Cited by 1,161
Crystal Structure of the Tyrosine Phosphatase SHP-2
Hof, P., Pluskey, S., Dhe‐Paganon, S., Eck, M. J., & Shoelson, S. E. (1998) · Cell · doi:10.1016/s0092-8674(00)80938-1 · Cited by 997
LAG 3 ( CD 223) as a cancer immunotherapy target
Andrews, L. P., Marciscano, A. E. E., Drake, C. G., & Vignali, D. A. A. (2017) · Immunological Reviews · doi:10.1111/imr.12519 · Cited by 980
Allosteric inhibition of SHP2 phosphatase inhibits cancers driven by receptor tyrosine kinases
Chen, Y.-N. P., LaMarche, M. J., Chan, H. M., Fekkes, P., Garcia-Fortanet, J., Acker, M. G., Antonakos, B., Chen, C. H.-T., Chen, Z., Cooke, V. G., et al. (2016) · Nature · doi:10.1038/nature18621 · Cited by 925 · cited 2×
“Recently, Chen et al.16 found that cancer cell lines sensitive to SHP2 depletion were also sensitive to EGFR depletion, which validated reports that RTK-driven cancer cells depend on SHP2 for survival.”
BackgroundMelanoma Cell-Intrinsic PD-1 Receptor Functions Promote Tumor Growth
Kleffel, S., Posch, C., Barthel, S. R., Mueller, H., Schlapbach, C., Guenova, E., Elco, C. P., Lee, N., Juneja, V. R., Zhan, Q., et al. (2015) · Cell · doi:10.1016/j.cell.2015.08.052 · Cited by 672
SH2-Containing Phosphotyrosine Phosphatase as a Target of Protein-Tyrosine Kinases
Feng, G., Hui, C., & Pawson, T. J. (1993) · Science · doi:10.1126/science.8096088 · Cited by 663
Šedý, J. R., Gavrieli, M., Potter, K. G., Hurchla, M. A., Lindsley, R. C., Hildner, K., Scheu, S., Pfeffer, K., Ware, C. F., Murphy, T. L., et al. (2004) · Nature Immunology · doi:10.1038/ni1144 · Cited by 640
Immune suppressive mechanisms in the tumor microenvironment
Munn, D. H., & Bronte, V. (2015) · Current Opinion in Immunology · doi:10.1016/j.coi.2015.10.009 · Cited by 527
VISTA is an immune checkpoint molecule for human T cells
Lines, J. L., Pantazi, E., Mak, J., Sempere, L. F., Wang, L., O'Connell, S., Ceeraz, S., Suriawinata, A. A., Yan, S., Ernstoff, M. S., et al. (2014) · Cancer Research · doi:10.1158/0008-5472.can-13-1504 · Cited by 510
Mutant KRAS-driven cancers depend on PTPN11/SHP2 phosphatase
Ruess, D. A., Heynen, G. J., Ciecielski, K. J., Ai, J., Berninger, A., Kabacaoglu, D., Görgülü, K., Dantes, Z., Wörmann, S. M., Diakopoulos, K. N., et al. (2018) · Nature Medicine · doi:10.1038/s41591-018-0024-8 · Cited by 370
SHP2 is required for growth of KRAS-mutant non-small-cell lung cancer in vivo
Mainardi, S., Mulero-Sánchez, A., Prahallad, A., Germano, G., Bosma, A., Krimpenfort, P., Lieftink, C., Steinberg, J. D., de Wit, N., Gonçalves-Ribeiro, S., et al. (2018) · Nature Medicine · doi:10.1038/s41591-018-0023-9 · Cited by 320
Garcia Fortanet, J., Chen, C. H.-T., Chen, Y.-N. P., Chen, Z., Deng, Z., Firestone, B., Fekkes, P., Fodor, M., Fortin, P. D., Fridrich, C., et al. (2016) · Journal of Medicinal Chemistry · doi:10.1021/acs.jmedchem.6b00680 · Cited by 298
Targeting wild-type KRAS-amplified gastroesophageal cancer through combined MEK and SHP2 inhibition
Wong, G. S., Zhou, J., Liu, J. B., Wu, Z., Xu, X., Li, T., Xu, D., Schumacher, S. E., Puschhof, J., McFarland, J., et al. (2018) · Nature Medicine · doi:10.1038/s41591-018-0022-x · Cited by 266
Aceto, N., Sausgruber, N., Brinkhaus, H., Gaidatzis, D., Martiny‐Baron, G., Mazzarol, G., Confalonieri, S., Quarto, M., Hu, G., Balwierz, P. J., et al. (2012) · Nature Medicine · doi:10.1038/nm.2645 · Cited by 265
Li, J., Jie, H.-B., Lei, Y. L., Gildener‐Leapman, N., Trivedi, S., Green, T., Kane, L., & Ferris, R. L. (2014) · Cancer Research · doi:10.1158/0008-5472.can-14-1215 · Cited by 256
The Programmed Death-1 Immune-Suppressive Pathway: Barrier to Antitumor Immunity
Ostrand‐Rosenberg, S., Horn, L. A., & Haile, S. T. (2014) · The Journal of Immunology · doi:10.4049/jimmunol.1401572 · Cited by 240
Protein tyrosine phosphatase SHP-2: A proto-oncogene product that promotes Ras activation
Matozaki, T., Murata, Y., Saito, Y., Okazawa, H., & Ohnishi, H. (2009) · Cancer Science · doi:10.1111/j.1349-7006.2009.01257.x · Cited by 240
SHP2 sails from physiology to pathology
Tajan, M., de Rocca Serra, A., Valet, P., Edouard, T., & Yart, A. (2015) · European Journal of Medical Genetics · doi:10.1016/j.ejmg.2015.08.005 · Cited by 232
The SHP-2 tyrosine phosphatase: Signaling mechanisms and biological functions
Qu, C. (2000) · Cell Research · doi:10.1038/sj.cr.7290055 · Cited by 167
Shp-2 Is Dispensable for Establishing T Cell Exhaustion and for PD-1 Signaling In Vivo
Rota, G., Niogret, C., Dang, A. T., Barros, C. R., Fonta, N. P., Alfei, F., Morgado, L., Zehn, D., Birchmeier, W., Vivier, E., et al. (2018) · Cell Reports · doi:10.1016/j.celrep.2018.03.026 · Cited by 155
PTPN11/Shp2 overexpression enhances liver cancer progression and predicts poor prognosis of patients
Han, T., Xiang, D., Sun, W. C., Liu, N., Sun, H., Wen, W., Shen, W.-F., Wang, R., Chen, C. Y., Wang, X. B., et al. (2015) · Journal of Hepatology · doi:10.1016/j.jhep.2015.03.036 · Cited by 141
Overexpression of Shp2 tyrosine phosphatase is implicated in leukemogenesis in adult human leukemia
Xu, R., Yu, Y., Zheng, S. S., Zhao, X., Dong, Q., He, Z., Liang, Y., Lu, Q., Fang, Y., Gan, X., et al. (2005) · Blood · doi:10.1182/blood-2004-10-4057 · Cited by 121
Peng, S., Hang, N., Liu, W., Guo, W., Jiang, C., Yang, X., Xu, Q., & Sun, Y. (2016) · Acta Pharmaceutica Sinica B · doi:10.1016/j.apsb.2016.02.002 · Cited by 113
Self-citationSHP-2/PTPN11 mediates gliomagenesis driven by PDGFRA and INK4A/ARF aberrations in mice and humans
Liu, K.-W., Feng, H., Bachoo, R. M., Kazlauskas, A., Smith, E. M., Symes, K., Hamilton, R. L., Nagane, M., Nishikawa, R., Hu, B., et al. (2011) · Journal of Clinical Investigation · doi:10.1172/jci43690 · Cited by 92
T Cell Ig and Mucin Domain Proteins and Immunity
Kane, L. (2010) · The Journal of Immunology · doi:10.4049/jimmunol.0902937 · Cited by 76
Liu, J. J., Li, Y., Chen, W. S., Liang, Y., Wang, G., Zong, M., Kaneko, K., Xu, R., Karin, M., & Feng, G. (2018) · Journal of Hepatology · doi:10.1016/j.jhep.2018.02.014 · Cited by 64
SHP2 forecast for the immune system: fog gradually clearing
Salmond, R. J., & Alexander, D. R. (2006) · Trends in Immunology · doi:10.1016/j.it.2006.01.007 · Cited by 63
Wu, X., Guo, W., Wu, L., Gu, Y., Gu, L., Xu, S.-H., Wu, X., Shen, Y., Ke, Y., Tan, R. X., et al. (2012) · The Journal of Immunology · doi:10.4049/jimmunol.1201006 · Cited by 56
Self-citationSang, X., Wang, R., Han, Y., Zhang, C., Shen, H., Yang, Z., Xiong, Y., Liu, H., Liu, S., Li, R., et al. (2017) · Acta Pharmaceutica Sinica B · doi:10.1016/j.apsb.2017.02.005 · Cited by 37
Liu, W., Guo, W., Shen, L., Chen, Z., Luo, Q., Luo, X., Feng, G., Shu, Y., Gu, Y., Xu, Q., et al. (2016) · Oncotarget · doi:10.18632/oncotarget.13812 · Cited by 35
Self-citationMiah, S. M. S., Jayasuriya, C. T., Salter, A. I., Reilly, E. C., Fugère, C., Yang, W., Chen, Q., & Brossay, L. (2017) · Frontiers in Immunology · doi:10.3389/fimmu.2017.01326 · Cited by 18
Dong, B., Gao, Y., Zheng, X., Gao, G., Gu, H., Chen, X., & Zhang, J. (2015) · PubMed Central · Cited by 7
Cited by
Sorted by citations
Combination strategies with PD-1/PD-L1 blockade: current advances and future directions
Yi, M., Zheng, X., Niu, M., Zhu, S., Ge, H., & Wu, K. (2022) · Molecular Cancer · doi:10.1186/s12943-021-01489-2 · Cited by 1,445
JAK-STAT Signaling: A Double-Edged Sword of Immune Regulation and Cancer Progression
Owen, K. L., Brockwell, N. K., & Parker, B. S. (2019) · Cancers · doi:10.3390/cancers11122002 · Cited by 728
Rational combinations of targeted cancer therapies: background, advances and challenges
Jin, H., Wang, L., & Bernards, R. (2023) · Nature Reviews Drug Discovery · doi:10.1038/s41573-022-00615-z · Cited by 503
Yang, Q., Guo, N., Zhou, Y., Chen, J., Wei, Q., & Han, M. (2020) · Acta Pharmaceutica Sinica B · doi:10.1016/j.apsb.2020.04.004 · Cited by 471
Molecular mechanism of SHP2 activation by PD-1 stimulation
Marasco, M., Berteotti, A., Weyershaeuser, J., Thorausch, N., Sikorska, J., Krausze, J., Brandt, H., Kirkpatrick, J., Ríos, P., Schamel, W. W. A., et al. (2020) · Science Advances · doi:10.1126/sciadv.aay4458 · Cited by 277
Metadata
- Authors
- Zhao, M., Guo, W., Wu, Y., Yang, C., Zhong, L., Deng, G., Zhu, Y., Liu, W., Gu, Y., Lu, Y., Kong, L., Meng, X., Xu, Q., & Sun, Y.
- Affiliations
- State Key Laboratory of Pharmaceutical Biotechnology (CN)
- Nanjing University of Chinese Medicine (CN)
- Peking University (CN)
- Jiangsu Province Hospital (CN)
- Corresponding author
- Meng, Xiangbao
- Xu, Qiang
- Sun, Yang
- ORCID
- Venue
- Acta Pharmaceutica Sinica B
- Publisher
- Elsevier BV
- Published
- 2019-03
- Volume
- 9
- Issue
- 2
- Pages
- 304-315
- ISSN
- 2211-3835 (ISSN-L)
- PMC
- PMC6437555
- OpenAlex
- W2891517856
- Cited by
- 190
- References
- 38
- Citations by year
- 2026: 15 · 2025: 25 · 2024: 25 · 2023: 18 · 2022: 37 · 2021: 27 · 2020: 33 · 2019: 10
- FWCI
- 6.23
- Type
- journal article
- Language
- en
- Update notices
- erratum (2025-05-01)
- Open access
- gold
- doi.org
- Licence
- Locations
- Acta Pharmaceutica Sinica B (publishedVersion, cc-by-nc-nd)
- Europe PMC (PubMed Central) (publishedVersion, cc-by-nc-nd)
- PubMed Central (publishedVersion, cc-by-nc-nd)
- PubMed (publishedVersion)
- DOAJ (DOAJ: Directory of Open Access Journals) (submittedVersion, cc-by-sa)
- Funders
- National Natural Science Foundation of China (81673436, 81673437, 21472091, 81872877)
- Nanjing University
- Priority Academic Program Development of Jiangsu Higher Education Institutions
- State Key Laboratory of Pharmaceutical Biotechnology (KF-GN-201703)
- Jiangsu Key Laboratory for Pharmacology and Safety Evaluation of Chinese Materia Medica (JKLPSE201802)
- Topics
- Life Sciences › Biochemistry, Genetics and Molecular Biology › Molecular Biology › Protein Tyrosine Phosphatases
- Health Sciences › Medicine › Oncology › Cancer Immunotherapy and Biomarkers
- Life Sciences › Immunology and Microbiology › Immunology › Immunotherapy and Immune Responses
- Keywords
- SHP2, SHP099, protein tyrosine phosphatase inhibition, antitumor immunity, anti-PD-1 therapy, combination immunotherapy, colon cancer, CD8+ T cells, cytotoxic T lymphocytes, T cell exhaustion, allosteric inhibitors
About these checks
Registry, retraction, Cites and statistics results are computed, not judged, with one exception: a printed reference that no index lists is read once by a model before it counts as a citation error. Claims are extracted by a model and kept only when their quote appears verbatim in the text; each cited source is then checked, with a model’s help, for whether it says what the claim relies on. Those verdicts can be wrong — read the claim’s quote and the cited source before relying on one.
Statistics and arithmetic are recomputed, not judged.
Confidence bands are shown only for fields calibrated on our annotated test set. None is calibrated yet, so no band is shown.
What counts as a claim ›How we measure confidence ›How we check this ›
Are you an author, or do you see a problem with this page? Request a review
