Cited by 15

The DOI matches its Crossref record; 2 of the 2 references it cites were found in a registry or an index.

Modulating active targeting nanoparticle design according to tumor progressions

Nie, Huifang, Huang, Rong, Jiang, Guangwei, Li, Wenshuai, Yang, Lan, Zhang, Meng, Qian, Min, Guo, Wei, Ye, Tao, Huang, Rongqin·2025·Acta Pharmaceutica Sinica B

Overview

The claims and statistics of this paper haven’t been checked yet.

Run the check — free, no account needed. It reads the open-access text and checks the sources it cites.

A few free checks a day · papers already verified open instantly · results are public

Integrity signals

Registry

Crossref · 10.1016/j.apsb.2024.12.016

Cites

2 of 2 references verified0 citation errors · 0 not checkable

Statistics

Figures

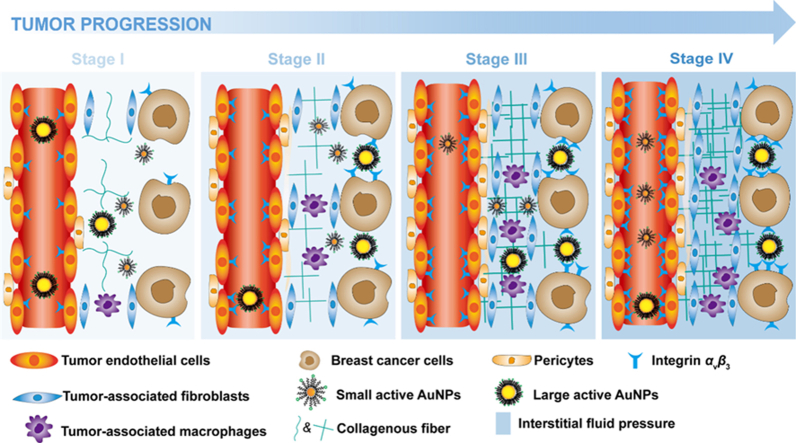
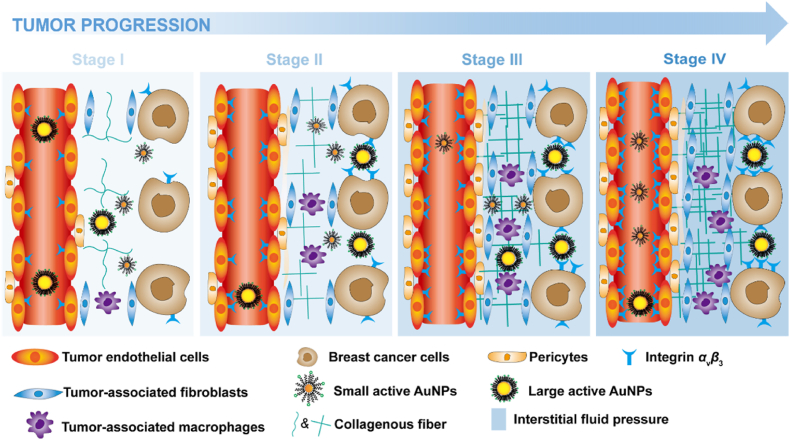
Graphical abstract Graphical abstract The changes in pathophysiology characterizations with the tumor development influence the accumulation and permeation behavior of actively targeted nanoparticles with different sizes.
Graphical abstract Graphical abstract The changes in pathophysiology characterizations with the tumor development influence the accumulation and permeation behavior of actively targeted nanoparticles with different sizes.CC BY-NC-ND · PubMed Central
Figure 1 Schematic illustration of nanoparticles entering the blood circulation, passing through the blood vessel wall and tumor stroma, and entering the tumor tissues.
Figure 1 Schematic illustration of nanoparticles entering the blood circulation, passing through the blood vessel wall and tumor stroma, and entering the tumor tissues.CC BY-NC-ND · PubMed Central
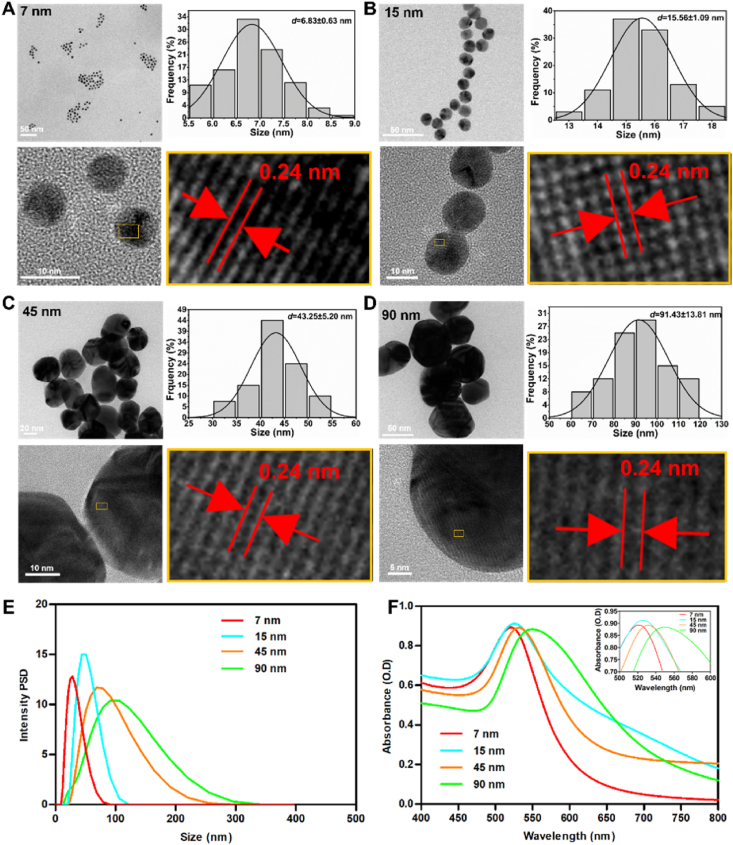
Figure 2 Nanoparticle synthesis and characterizations. (A–D) TEM images, corresponding histograms, and Gaussian fits of the measured AuNP size distribution as determined from their TEM micrographs, high-resolution TEM image, and locally enlarged image of AuNP with sizes 7 nm (A), 15 nm (B), 45 nm (C) and 90 nm (D). Hydrodynamic diameter distribution (E) and UV–Vis spectra (F) of different-sized AuNPs dispersed in water.
Figure 2 Nanoparticle synthesis and characterizations. (A–D) TEM images, corresponding histograms, and Gaussian fits of the measured AuNP size distribution as determined from their TEM micrographs, high-resolution TEM image, and locally enlarged image of AuNP with sizes 7 nm (A), 15 nm (B), 45 nm (C) and 90 nm (D). Hydrodynamic diameter distribution (E) and UV–Vis spectra (F) of different-sized AuNPs dispersed in water.CC BY-NC-ND · PubMed Central
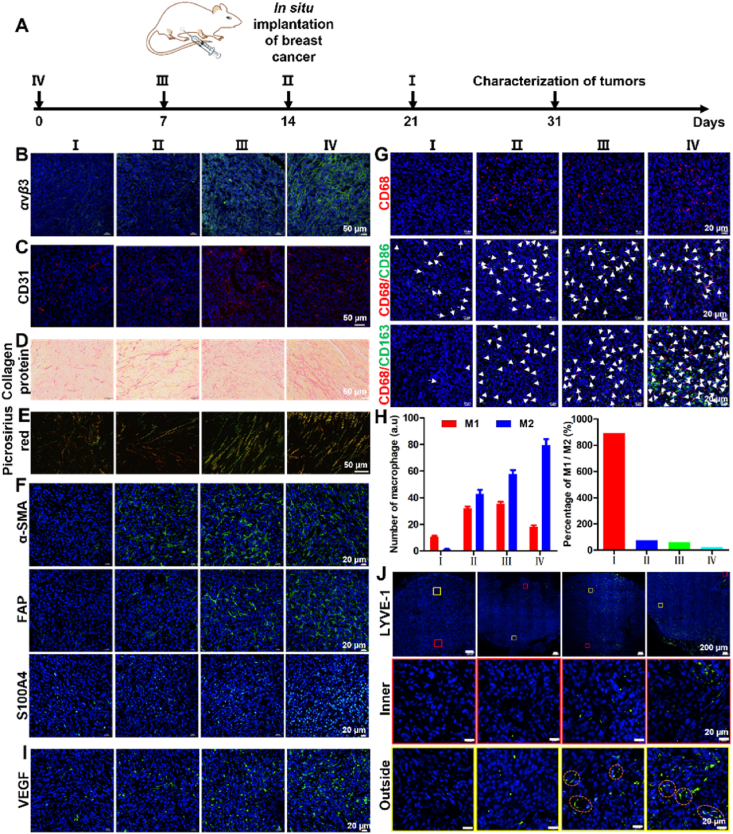
Figure 3 Physiological and pathological characterizations of tumor tissues during growth. (A) Schematic illustration of the establishment of the four stages of in-situ breast cancer mouse models by the time interval method. (B, C) Representative fluorescence images depicting the evolution of the expression of integrin αvβ3 (B) and vascular density (C) with tumor sizes. (D, E) Representative bright-field and polarized light images of sections stained with Picrosirius red describing the development of collagen with tumor sizes. (F) Immunofluorescence images of tumor section to analyze the expression of α-SMA, FAP, and S100A4 with tumor sizes. (G) Representative photographs of CD68/CD86/CD163 immunofluorescence staining depicting the change in the density of tumor-associated macrophages (CD68), M1 (CD68/CD86), and M2 (CD68/CD163) with tumor sizes. The white arrows indicate M1 or M2 cells. (H) Quantitative analysis of the amount of M1 and M2 macrophages in tumor tissues (left) and percentage of M1/M2 (right). (I) Representative photographs of VEGF immunofluorescence staining depicting the change of vascular permeability with tumor sizes. (J) Representative photographs of LYVE-1 immunofluorescence staining depicting the change of lymphatic permeability with tumor sizes. The yellow box is located at the edge of the tumor tissue, while the red box is located inside the tumor tissue. The lower panels are enlarged sections of the boxed regions from the upper panels. Dashed circles indicate lymphatic vessels. Data are mean ± SEM (n = 10).
Figure 3 Physiological and pathological characterizations of tumor tissues during growth. (A) Schematic illustration of the establishment of the four stages of in-situ breast cancer mouse models by the time interval method. (B, C) Representative fluorescence images depicting the evolution of the expression of integrin αvβ3 (B) and vascular density (C) with tumor sizes. (D, E) Representative bright-field and polarized light images of sections stained with Picrosirius red describing the development of collagen with tumor sizes. (F) Immunofluorescence images of tumor section to analyze the expression of α-SMA, FAP, and S100A4 with tumor sizes. (G) Representative photographs of CD68/CD86/CD163 immunofluorescence staining depicting the change in the density of tumor-associated macrophages (CD68), M1 (CD68/CD86), and M2 (CD68/CD163) with tumor sizes. The white arrows indicate M1 or M2 cells. (H) Quantitative analysis of the amount of M1 and M2 macrophages in tumor tissues (left) and percentage of M1/M2 (right). (I) Representative photographs of VEGF immunofluorescence staining depicting the change of vascular permeability with tumor sizes. (J) Representative photographs of LYVE-1 immunofluorescence staining depicting the change of lymphatic permeability with tumor sizes. The yellow box is located at the edge of the tumor tissue, while the red box is located inside the tumor tissue. The lower panels are enlarged sections of the boxed regions from the upper panels. Dashed circles indicate lymphatic vessels. Data are mean ± SEM (n = 10).CC BY-NC-ND · PubMed Central
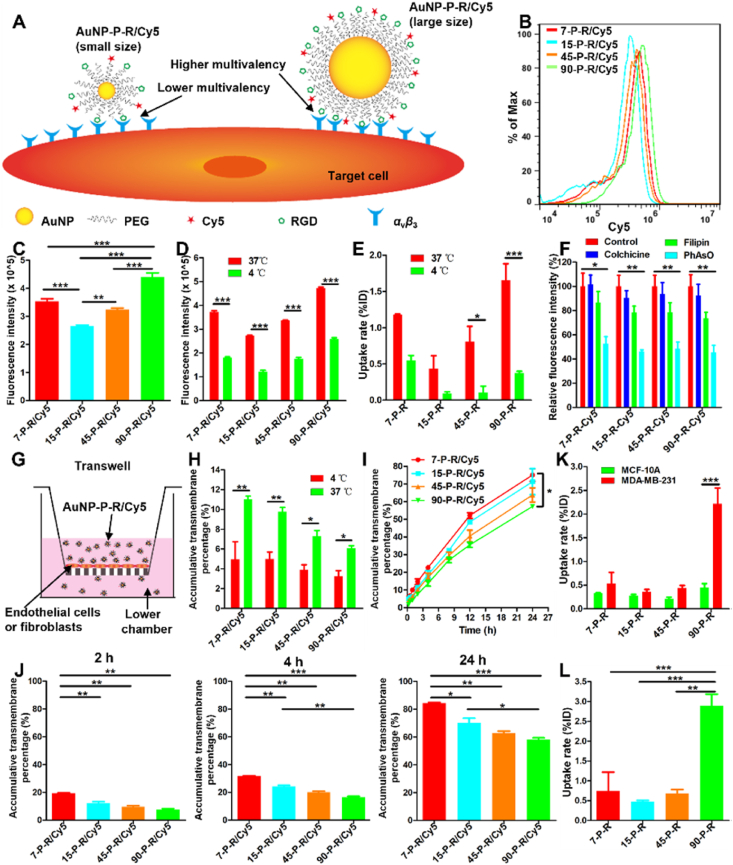
Figure 4 Analysis of the ability of nanoparticles to cross vascular endothelial HUVEC cell monolayers, fibroblast M 20 cell monolayers, and be taken up by tumor cells. (A) Diagrammatic sketch of the multivalent interactions between RGD and integrin αvβ3. (B, C) Flow cytometry analysis of endothelial cellular uptake of active AuNPs with different sizes. (D, E) Quantitative comparisons of endothelial cellular uptake of active AuNPs at 4 and 37 °C by flow cytometry (D) and ICP-OES (E). (F) Relative fluorescence intensity of active AuNPs taken up by endothelial cells incubated with endocytosis inhibitors such as colchicine, filipin, and PhAsO. Results were normalized to the fluorescence intensity of the control. (G) Schematic representations of the Transwell assay imitating the vascular wall or tumoral matrix barrier in vitro. (H) Transwell assay analysis of the ability of active AuNPs to cross vascular endothelial cells within 2 h at 4 and 37 °C. (I) Transwell assay analysis of the ability of active AuNPs to cross vascular endothelial cells within 24 h at 37 °C. (J) Transwell assay analysis of the ability of active AuNPs to pass through M 20 human embryonic fibroblast layers at 2, 4, and 24 h. (K) Recognition and uptake of active AuNPs by MCF-10A and MDA-MB-231 cells by ICP-OES. (L) ICP-OES analysis of MDA-MB-231 cellular uptake of active AuNPs with different sizes. Data are mean ± SEM. ∗P < 0.05; ∗∗P < 0.01; ∗∗∗P < 0.001; one-way ANOVA (C, I, J) and two-way ANOVA (D–F, H, K).
Figure 4 Analysis of the ability of nanoparticles to cross vascular endothelial HUVEC cell monolayers, fibroblast M 20 cell monolayers, and be taken up by tumor cells. (A) Diagrammatic sketch of the multivalent interactions between RGD and integrin αvβ3. (B, C) Flow cytometry analysis of endothelial cellular uptake of active AuNPs with different sizes. (D, E) Quantitative comparisons of endothelial cellular uptake of active AuNPs at 4 and 37 °C by flow cytometry (D) and ICP-OES (E). (F) Relative fluorescence intensity of active AuNPs taken up by endothelial cells incubated with endocytosis inhibitors such as colchicine, filipin, and PhAsO. Results were normalized to the fluorescence intensity of the control. (G) Schematic representations of the Transwell assay imitating the vascular wall or tumoral matrix barrier in vitro. (H) Transwell assay analysis of the ability of active AuNPs to cross vascular endothelial cells within 2 h at 4 and 37 °C. (I) Transwell assay analysis of the ability of active AuNPs to cross vascular endothelial cells within 24 h at 37 °C. (J) Transwell assay analysis of the ability of active AuNPs to pass through M 20 human embryonic fibroblast layers at 2, 4, and 24 h. (K) Recognition and uptake of active AuNPs by MCF-10A and MDA-MB-231 cells by ICP-OES. (L) ICP-OES analysis of MDA-MB-231 cellular uptake of active AuNPs with different sizes. Data are mean ± SEM. ∗P < 0.05; ∗∗P < 0.01; ∗∗∗P < 0.001; one-way ANOVA (C, I, J) and two-way ANOVA (D–F, H, K).CC BY-NC-ND · PubMed Central
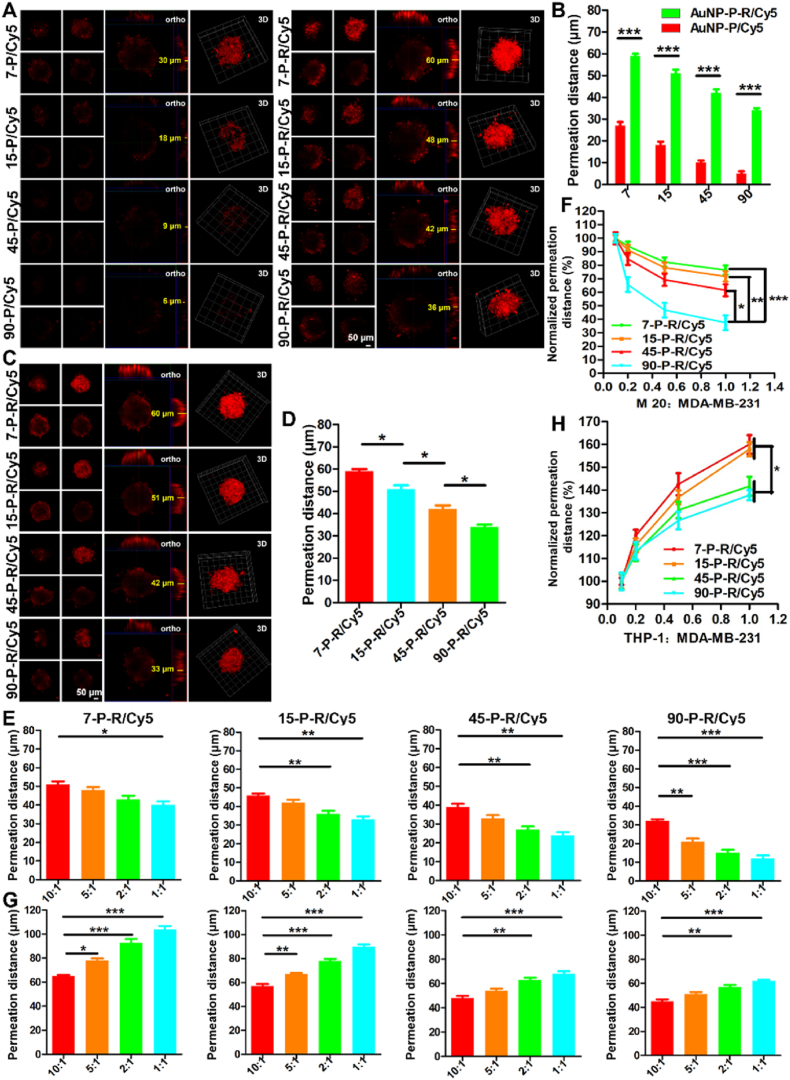
Figure 5 Permeation behavior of active AuNPs into tumor spheroids. (A) Representative confocal microscope images and (B) quantitative analysis of the pervasion distance of active and passive AuNPs into MDA-MB-231 tumor spheroids. (C) Representative confocal microscope images and (D) quantitative analysis of the pervasion distance of active AuNPs with different sizes into MDA-MB-231 tumor spheroids. (E) The analysis of the pervasion distance of active AuNPs with different sizes into 3D coculture of MDA-MB-231 with M 20 cells in a ratio of 10:1, 5:1, 2:1, and 1:1. (F) All the penetration distance in (E) was normalized to the mean of penetration distance in a ratio of 10:1. (G) The analysis of the penetration distance of active AuNPs with different sizes into 3D coculture of MDA-MB-231 with THP-1 cells in a ratio of 10:1, 5:1, 2:1, and 1:1. (H) All the penetration distance in (E) was normalized to the mean of penetration distance in a ratio of 10:1. Data are mean ± SEM (n = 3). ∗P < 0.05; ∗∗P < 0.01; ∗∗∗P < 0.001; two-way ANOVA (B) and one-way ANOVA (D–H).
Figure 5 Permeation behavior of active AuNPs into tumor spheroids. (A) Representative confocal microscope images and (B) quantitative analysis of the pervasion distance of active and passive AuNPs into MDA-MB-231 tumor spheroids. (C) Representative confocal microscope images and (D) quantitative analysis of the pervasion distance of active AuNPs with different sizes into MDA-MB-231 tumor spheroids. (E) The analysis of the pervasion distance of active AuNPs with different sizes into 3D coculture of MDA-MB-231 with M 20 cells in a ratio of 10:1, 5:1, 2:1, and 1:1. (F) All the penetration distance in (E) was normalized to the mean of penetration distance in a ratio of 10:1. (G) The analysis of the penetration distance of active AuNPs with different sizes into 3D coculture of MDA-MB-231 with THP-1 cells in a ratio of 10:1, 5:1, 2:1, and 1:1. (H) All the penetration distance in (E) was normalized to the mean of penetration distance in a ratio of 10:1. Data are mean ± SEM (n = 3). ∗P < 0.05; ∗∗P < 0.01; ∗∗∗P < 0.001; two-way ANOVA (B) and one-way ANOVA (D–H).CC BY-NC-ND · PubMed Central
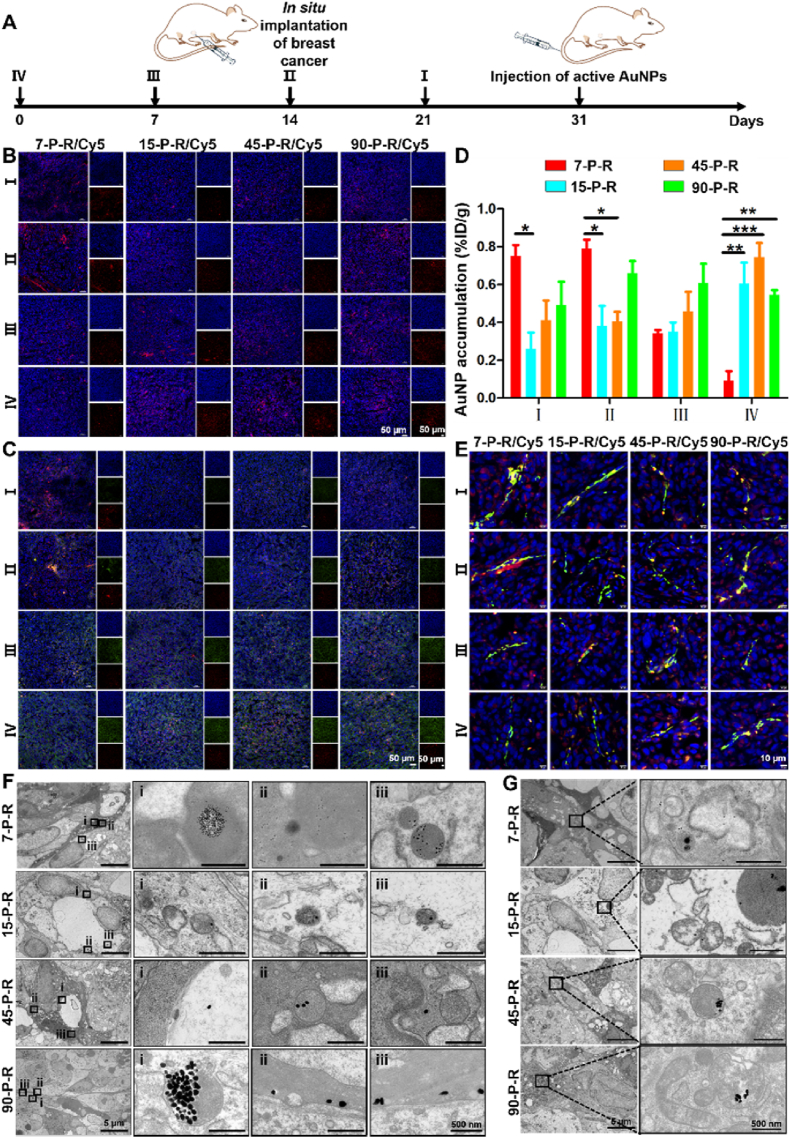
Figure 6 Accumulation and permeation of active AuNPs in tumor tissues. (A) Schematic illustration for evaluating the accumulation and permeation of active AuNPs on orthotopic breast cancer mouse models. (B) Fluorescence distribution of active AuNPs with different sizes in tumors of different volumes at 24 h after intravenous administration. (C) Fluorescence distribution of active AuNPs depicting how tumoral accumulation of AuNPs with different sizes varies with tumor volume and the expression of integrin αvβ3 at 24 h after intravenous administration. Red: Cy5-labeled active AuNPs; green: FITC-marked integrin αvβ3. (D) Quantitative analysis of active AuNPs levels in tumors with different volumes as measured by ICP-OES at 24 h after intravenous administration. Results were normalized to injection dose per gram of tumor. Data are mean ± SEM (n = 3). ∗P < 0.05; ∗∗P < 0.01; ∗∗∗P < 0.001; two-way ANOVA. (E) Distribution of active AuNPs with different sizes away from tumor blood vessels at 24 h after intravenous administration. Red: Cy5-labeled active AuNPs; green: integrin αvβ3. (F, G) Representative TEM images of the transvascular (F) and tumor tissue permeability (G) of active AuNPs with different sizes in II tumors. Scale bars, 5 μm; insets, 500 nm.
Figure 6 Accumulation and permeation of active AuNPs in tumor tissues. (A) Schematic illustration for evaluating the accumulation and permeation of active AuNPs on orthotopic breast cancer mouse models. (B) Fluorescence distribution of active AuNPs with different sizes in tumors of different volumes at 24 h after intravenous administration. (C) Fluorescence distribution of active AuNPs depicting how tumoral accumulation of AuNPs with different sizes varies with tumor volume and the expression of integrin αvβ3 at 24 h after intravenous administration. Red: Cy5-labeled active AuNPs; green: FITC-marked integrin αvβ3. (D) Quantitative analysis of active AuNPs levels in tumors with different volumes as measured by ICP-OES at 24 h after intravenous administration. Results were normalized to injection dose per gram of tumor. Data are mean ± SEM (n = 3). ∗P < 0.05; ∗∗P < 0.01; ∗∗∗P < 0.001; two-way ANOVA. (E) Distribution of active AuNPs with different sizes away from tumor blood vessels at 24 h after intravenous administration. Red: Cy5-labeled active AuNPs; green: integrin αvβ3. (F, G) Representative TEM images of the transvascular (F) and tumor tissue permeability (G) of active AuNPs with different sizes in II tumors. Scale bars, 5 μm; insets, 500 nm.CC BY-NC-ND · PubMed Central
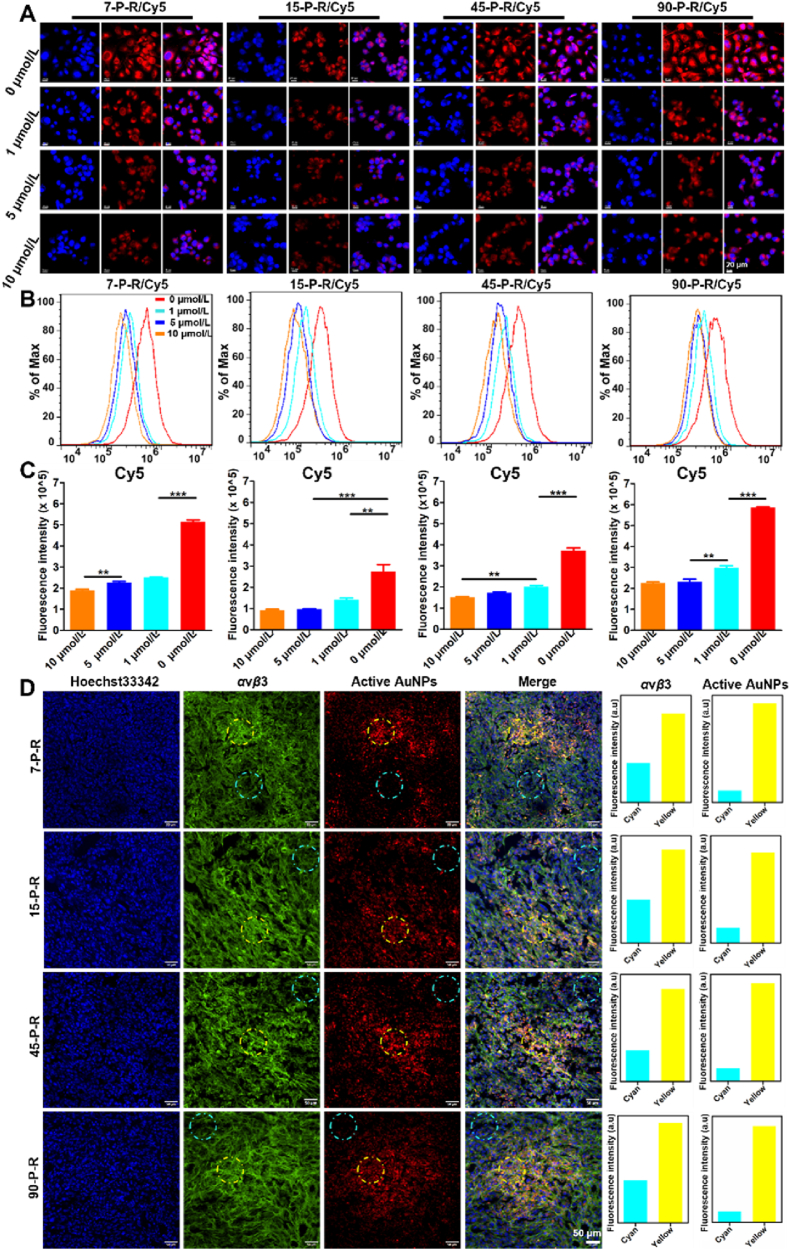
Figure 7 Effect of integrin αvβ3 expression on tumor cellular uptake and tumor tissue accumulation of active AuNPs. Confocal microscopy (A) and flow cytometric analysis (B) of the internalization of active AuNPs by MDA-MB-231 cells pretreated with RGD at concentrations of 1, 5, and 10 μmol/L. (C) Quantitative analysis of flow cytometric results. Data are mean ± SEM (n = 3). ∗∗P < 0.01; ∗∗∗P < 0.001; one-way ANOVA. (D) Confocal microscopy images of tumor tissue distribution of active AuNPs depicting the distribution of active AuNPs with the expression of integrin αvβ3 in the tumor. Right: quantitative analysis of fluorescence intensity of integrin αvβ3 and active AuNPs in cyan and yellow circles by Image J.
Figure 7 Effect of integrin αvβ3 expression on tumor cellular uptake and tumor tissue accumulation of active AuNPs. Confocal microscopy (A) and flow cytometric analysis (B) of the internalization of active AuNPs by MDA-MB-231 cells pretreated with RGD at concentrations of 1, 5, and 10 μmol/L. (C) Quantitative analysis of flow cytometric results. Data are mean ± SEM (n = 3). ∗∗P < 0.01; ∗∗∗P < 0.001; one-way ANOVA. (D) Confocal microscopy images of tumor tissue distribution of active AuNPs depicting the distribution of active AuNPs with the expression of integrin αvβ3 in the tumor. Right: quantitative analysis of fluorescence intensity of integrin αvβ3 and active AuNPs in cyan and yellow circles by Image J.CC BY-NC-ND · PubMed Central

Verification

Claims the paper makes

The claims and statistics of this paper haven’t been checked yet.

Run the check — free, no account needed. It reads the open-access text and checks the sources it cites.

A few free checks a day · papers already verified open instantly · results are public

Claims other papers make about this one

Each is checked against this paper’s own text: does it say what the citing paper says it does?

Self-check

Percentages, sums and reported differences re-computed from the paper’s own numbers.

The self-check needs the paper’s full text.

Citations

Cites

Show all 2 references

Research works printed but not linked: 35

  1. Yetisgin, 2020, Therapeutic nanoparticles and their targeted delivery applications, Molecules, 25, 2193, 10.3390/molecules25092193 · DOI
  2. Zhang, 2020, The progress and perspective of nanoparticle-enabled tumor metastasis treatment, Acta Pharm Sin B, 10, 2037, 10.1016/j.apsb.2020.07.013 · DOI
  3. Dilliard, 2023, Passive, active and endogenous organ-targeted lipid and polymer nanoparticles for delivery of genetic drugs, Nat Rev Mater, 8, 282, 10.1038/s41578-022-00529-7 · DOI
  4. Shao, 2022, Responsive shape-shifting nanoarchitectonics and its application in tumor diagnosis and therapy, J Control Release, 352, 600, 10.1016/j.jconrel.2022.10.046 · DOI
  5. He, 2022, pH-Responsive size-shrinkable mesoporous silica-based nanocarriers for improving tumor penetration and therapeutic efficacy, Nanoscale, 14, 1271, 10.1039/D1NR07513F · DOI · Paper page
  6. Hong, 2021, Enzyme-induced morphological transformation of drug carriers: implications for cytotoxicity and the retention time of antitumor agents, Mater Sci Eng C Mater Biol Appl, 129, 10.1016/j.msec.2021.112389 · DOI
  7. Zhao, 2019, Effect of physicochemical and surface properties on in vivo fate of drug nanocarriers, Adv Drug Deliv Rev, 143, 3, 10.1016/j.addr.2019.01.002 · DOI
  8. Deng, 2022, Tailoring the physicochemical properties of nanomaterials for immunomodulation, Adv Drug Deliv Rev, 180, 10.1016/j.addr.2021.114039 · DOI
  9. Cong, 2022, How can we use the endocytosis pathways to design nanoparticle drug-delivery vehicles to target cancer cells over healthy cells?., Chem Soc Rev, 51, 7531, 10.1039/D1CS00707F · DOI
  10. Wang, 2021, Effect of physicochemical properties on in vivo fate of nanoparticle-based cancer immunotherapies, Acta Pharm Sin B, 11, 886, 10.1016/j.apsb.2021.03.007 · DOI
  11. Dai, 2017, Nanoparticle design strategies for enhanced anticancer therapy by exploiting the tumour microenvironment, Chem Soc Rev, 46, 3830, 10.1039/C6CS00592F · DOI
  12. Barua, 2014, Challenges associated with penetration of nanoparticles across cell and tissue barriers: a review of current status and future prospects, Nano Today, 9, 223, 10.1016/j.nantod.2014.04.008 · DOI
  13. Fang, 2020, Exploiting the dynamics of the EPR effect and strategies to improve the therapeutic effects of nanomedicines by using EPR effect enhancers, Adv Drug Deliv Rev, 157, 142, 10.1016/j.addr.2020.06.005 · DOI · Paper page
  14. Zhao, 2017, Remodeling the blood-brain barrier microenvironment by natural products for brain tumor therapy, Acta Pharm Sin B, 7, 541, 10.1016/j.apsb.2017.07.002 · DOI
  15. Gao, 2020, Simulation study of the effects of interstitial fluid pressure and blood flow velocity on transvascular transport of nanoparticles in tumor microenvironment, Comput Methods Programs Biomed, 193, 10.1016/j.cmpb.2020.105493 · DOI
  16. Liu, 2022, Nanocarriers for pancreatic cancer imaging, treatments, and immunotherapies, Theranostics, 12, 1030, 10.7150/thno.64805 · DOI
  17. Wang, 2022, Targeting tumor physical microenvironment for improved radiotherapy, Small Methods, 6
  18. Chen, 2017, Rethinking cancer nanotheranostics, Nat Rev Mater, 2, 10.1038/natrevmats.2017.24 · DOI
  19. Kesharwani, 2023, Gold nanoparticles and gold nanorods in the landscape of cancer therapy, Mol Cancer, 22, 98, 10.1186/s12943-023-01798-8 · DOI
  20. Rai, 2023, Advances in the design of amino acid and peptide synthesized gold nanoparticles for their applications, Adv Colloid Interf Sci, 318, 10.1016/j.cis.2023.102951 · DOI
  21. Innocenti, 2022, Design, synthesis and evaluation of RGD peptidomimetic‒gold nanostar conjugates as M21 cell adhesion inhibitors, Bioorg Chem, 126, 10.1016/j.bioorg.2022.105873 · DOI
  22. Liang, 2017, RGD peptide-modified fluorescent gold nanoclusters as highly efficient tumor-targeted radiotherapy sensitizers, Biomaterials, 144, 95, 10.1016/j.biomaterials.2017.08.017 · DOI
  23. Qin, 2023, New opportunities for RGD-engineered metal nanoparticles in cancer, Mol Cancer, 22, 87, 10.1186/s12943-023-01784-0 · DOI
  24. Jana, 2001, Seeding growth for size control of 5‒40 nm diameter gold nanoparticles, Langmuir, 17, 6782, 10.1021/la0104323 · DOI
  25. Liu, 2017, Suppressing nanoparticle-mononuclear phagocyte system interactions of two-dimensional gold nanorings for improved tumor accumulation and photothermal ablation of tumors, ACS Nano, 11, 10539, 10.1021/acsnano.7b05908 · DOI
  26. Minchinton, 2006, Drug penetration in solid tumours, Nat Rev Cancer, 6, 583, 10.1038/nrc1893 · DOI · Paper page
  27. Stylianopoulos, 2018, Reengineering the physical microenvironment of tumors to improve drug delivery and efficacy: from mathematical modeling to bench to bedside, Trends Cancer, 4, 292, 10.1016/j.trecan.2018.02.005 · DOI
  28. Liu, 2021, Tumor microenvironment remodeling-based penetration strategies to amplify nanodrug accessibility to tumor parenchyma, Adv Drug Deliv Rev, 172, 80, 10.1016/j.addr.2021.02.019 · DOI
  29. Zhang, 2021, A smart O2-generating nanocarrier optimizes drug transportation comprehensively for chemotherapy improving, Acta Pharm Sin B, 11, 3608, 10.1016/j.apsb.2021.04.021 · DOI
  30. Chen, 2019, Turning foes to friends: targeting cancer-associated fibroblasts, Nat Rev Drug Discov, 18, 99, 10.1038/s41573-018-0004-1 · DOI
  31. Ngambenjawong, 2017, Progress in tumor-associated macrophage (TAM)-targeted therapeutics, Adv Drug Deliv Rev, 114, 206, 10.1016/j.addr.2017.04.010 · DOI
  32. Lin, 2022, Macrophages actively transport nanoparticles in tumors after extravasation, ACS Nano, 16, 6080, 10.1021/acsnano.1c11578 · DOI
  33. Nong, 2023, Targeted nanocarriers co-opting pulmonary intravascular leukocytes for drug delivery to the injured brain, ACS Nano, 17, 13121, 10.1021/acsnano.2c08275 · DOI
  34. MacParland, 2017, Phenotype determines nanoparticle uptake by human macrophages from liver and blood, ACS Nano, 11, 2428, 10.1021/acsnano.6b06245 · DOI
  35. Heldin, 2004, High interstitial fluid pressure―an obstacle in cancer therapy, Nat Rev Cancer, 4, 806, 10.1038/nrc1456 · DOI · Paper page

Cited by

Sorted by citations

See all 15

Metadata

Authors
Nie, H., Huang, R., Jiang, G., Li, W., Yang, L., Zhang, M., Qian, M., Guo, W., Ye, T., & Huang, R.
Venue
Acta Pharmaceutica Sinica B
Publisher
Elsevier BV
Published
2025-02
Volume
15
Issue
2
Pages
1143-1158
ISSN
2211-3835
Cited by
15
References
2
Language
en
Funders
National Natural Science Foundation of China (82172746, 82473342)

About these checks

Registry, retraction, Cites and statistics results are computed, not judged, with one exception: a printed reference that no index lists is read once by a model before it counts as a citation error. Claims are extracted by a model and kept only when their quote appears verbatim in the text; each cited source is then checked, with a model’s help, for whether it says what the claim relies on. Those verdicts can be wrong — read the claim’s quote and the cited source before relying on one.

Statistics and arithmetic are recomputed, not judged.

Confidence bands are shown only for fields calibrated on our annotated test set. None is calibrated yet, so no band is shown.

What counts as a claim ›How we measure confidence ›How we check this ›

Are you an author, or do you see a problem with this page? Request a review

How to cite

Cite CoChat for the checks on this page, and the paper for its own findings.

This page
CoChat. (2026). Citation check: Modulating active targeting nanoparticle design according to tumor progressions. https://app.cochat.ai/papers/10.1016/j.apsb.2024.12.016
The paper
Nie, H., Huang, R., Jiang, G., Li, W., Yang, L., Zhang, M., Qian, M., Guo, W., Ye, T., & Huang, R. (2025). Modulating active targeting nanoparticle design according to tumor progressions. Acta Pharmaceutica Sinica B. https://doi.org/10.1016/j.apsb.2024.12.016