

The DOI matches its Crossref record; 57 of the 58 references it cites were found in a registry or an index.
Microglia regulate hippocampal neurogenesis during chronic neurodegeneration
Open accessAbstract
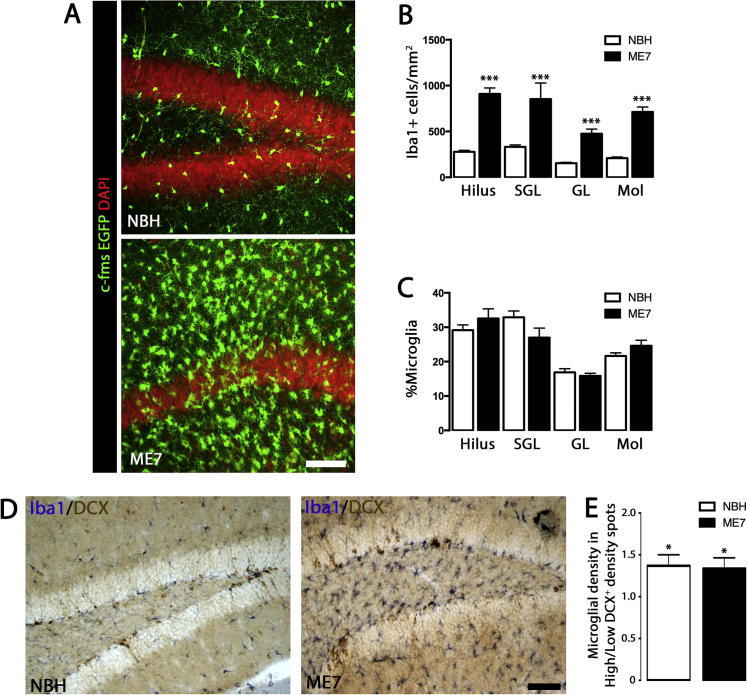
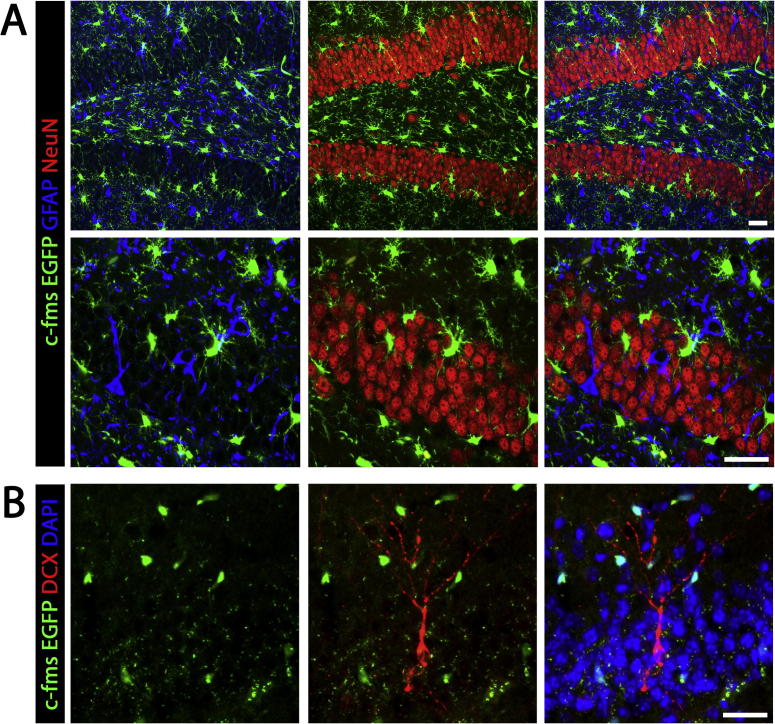
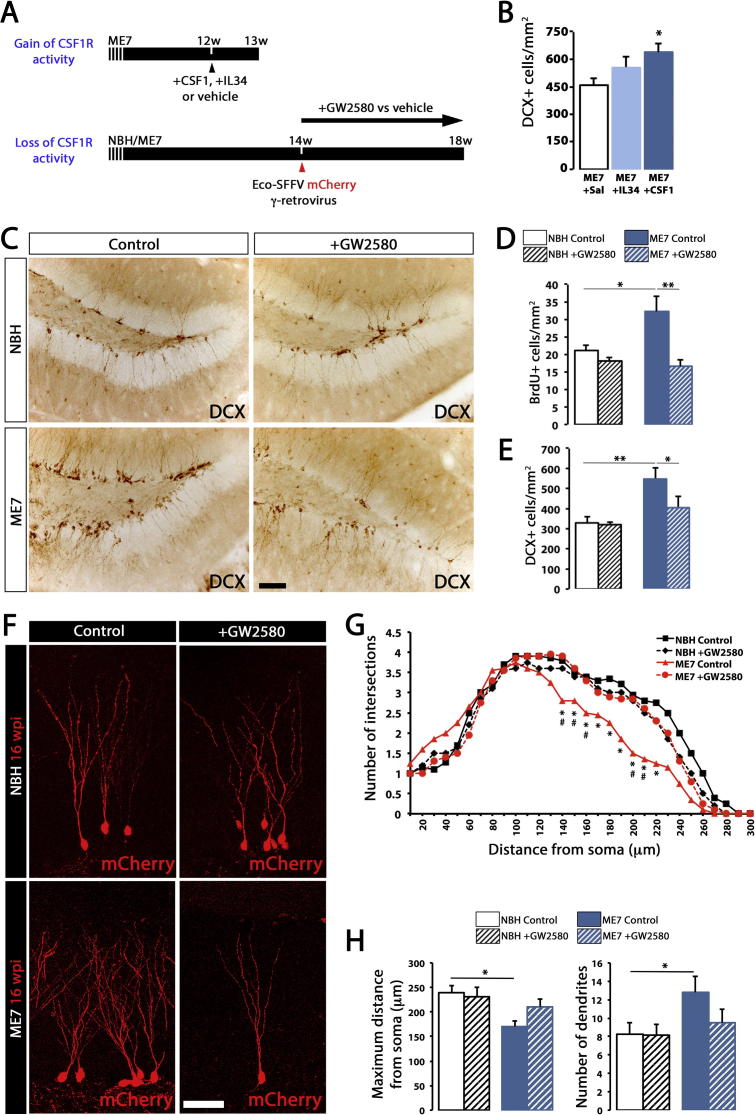
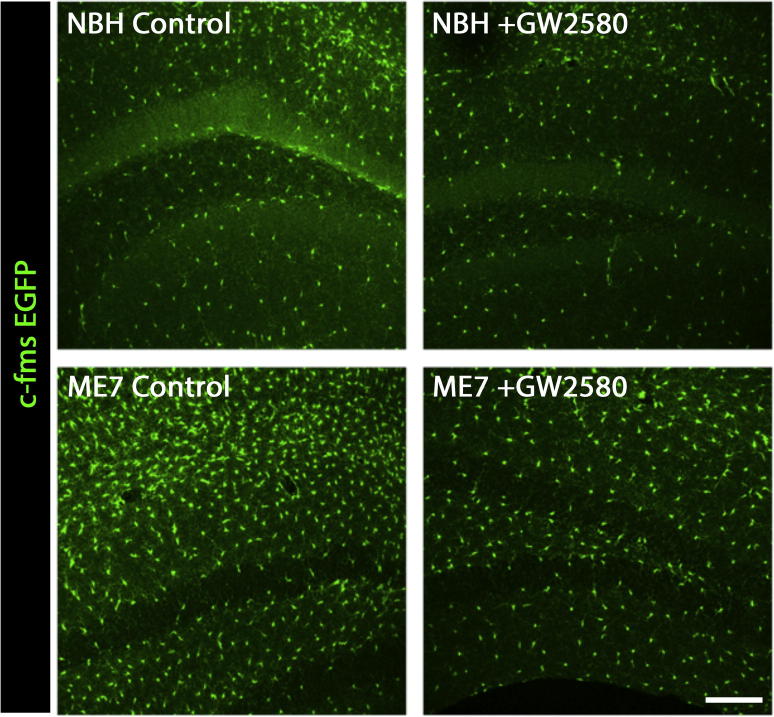
Neurogenesis is altered in neurodegenerative disorders, partly regulated by inflammatory factors. We have investigated whether microglia, the innate immune brain cells, regulate hippocampal neurogenesis in neurodegeneration. Using the ME7 model of prion disease we applied gain- or loss-of CSF1R function, as means to stimulate or inhibit microglial proliferation, respectively, to dissect the contribution of these cells to neurogenesis. We found that increased hippocampal neurogenesis correlates with the expansion of the microglia population. The selective inhibition of microglial proliferation caused a reduction in neurogenesis and a restoration of normal neuronal differentiation, supporting a pro-neurogenic role for microglia. Using a gene screening strategy, we identified TGFβ as a molecule controlling the microglial pro-neurogenic response in chronic neurodegeneration, supported by loss-of-function mechanistic experiments. By the selective targeting of microglial proliferation we have been able to uncover a pro-neurogenic role for microglia in chronic neurodegeneration, suggesting promising therapeutic targets to normalise the neurogenic niche during neurodegeneration.
Overview
The claims and statistics of this paper haven’t been checked yet.
Run the check — free, no account needed. It reads the open-access text and checks the sources it cites.
Integrity signals
Registry
Cites
Statistics
Figures
Verification
Claims the paper makes
The claims and statistics of this paper haven’t been checked yet.
Run the check — free, no account needed. It reads the open-access text and checks the sources it cites.
Claims other papers make about this one
Each is checked against this paper’s own text: does it say what the citing paper says it does?
The source backs part of the claim, not all of it — or backs it for a different population, condition or comparison.
In the citing paper
“Microgliosis and astrocytosis were previously described in the dentate gyrus area of the hippocampus of prion disease mice [32, 38, 39].”
From Pharmacological modulation of TSPO in microglia/macrophages and neurons in a chronic neurodegenerative model of prion disease (2023) · cites this paper as [38]
Experimental — accuracy not yet measuredThe source backs part of the claim, not all of it — or backs it for a different population, condition or comparison.
In the citing paper
“pharmacological modulation of microglia with another CSF1R inhibitor, GW2580 was able to reduce neuronal population and aberrant neurogenesis and restore the normal neuronal differentiation [38].”
From Pharmacological modulation of TSPO in microglia/macrophages and neurons in a chronic neurodegenerative model of prion disease (2023) · cites this paper as [38]
Experimental — accuracy not yet measuredThe source backs part of the claim, not all of it — or backs it for a different population, condition or comparison.
In the citing paper
“However, CSF1R is not known to be expressed in neurons [38].”
From Pharmacological modulation of TSPO in microglia/macrophages and neurons in a chronic neurodegenerative model of prion disease (2023) · cites this paper as [38]
Experimental — accuracy not yet measuredThe cited source says what the claim attributes to it.
In the citing paper
“pharmacological modulation of microglia with another CSF1R inhibitor, GW2580 was able to reduce neuronal population and aberrant neurogenesis and restore the normal neuronal differentiation [38].”
From Pharmacological modulation of TSPO in microglia/macrophages and neurons in a chronic neurodegenerative model of prion disease (2023) · cites this paper as [38]
The cited source says what the claim attributes to it.
In the citing paper
“pharmacological modulation of microglia with another CSF1R inhibitor, GW2580 was able to reduce neuronal population and aberrant neurogenesis and restore the normal neuronal differentiation [38].”
From Pharmacological modulation of TSPO in microglia/macrophages and neurons in a chronic neurodegenerative model of prion disease (2023) · cites this paper as [38]
Self-check
Percentages, sums and reported differences re-computed from the paper’s own numbers.
The self-check needs the paper’s full text.
Citations
Cites
Polazzi, E., Mengoni, I., Caprini, M., Peña‐Altamira, E., Kurtys, E., & Monti, B. (2012) · Neurosignals · doi:10.1159/000337115 · Cited by 9,023
Molecular Mechanisms of Depression: Perspectives on New Treatment Strategies
Lang, U. E., & Borgwardt, S. (2013) · Cellular Physiology and Biochemistry · doi:10.1159/000350094 · Cited by 8,526
Inflammatory Blockade Restores Adult Hippocampal Neurogenesis
Monje, M. L., Toda, H., & Palmer, T. D. (2003) · Science · doi:10.1126/science.1088417 · Cited by 2,426
Inflammation is detrimental for neurogenesis in adult brain
Ekdahl, C. T., Claasen, J.-H., Bonde, S., Kokaia, Z., & Lindvall, O. (2003) · Proceedings of the National Academy of Sciences · doi:10.1073/pnas.2234031100 · Cited by 1,559
Ziv, Y., Ron, N., Butovsky, O., Landa, G., Sudai, E., Greenberg, N., Cohen, H., Kipnis, J., & Schwartz, M. (2006) · Nature Neuroscience · doi:10.1038/nn1629 · Cited by 1,209
Trejo, J. L., Carro, E., & Torres-Alemán, I. (2001) · The Journal of Neuroscience · doi:10.1523/jneurosci.21-05-01628.2001 · Cited by 1,017
Butovsky, O., Ziv, Y., Schwartz, A., Landa, G., Talpalar, A. E., Pluchino, S., Martino, G., & Schwartz, M. (2006) · Molecular and Cellular Neuroscience · doi:10.1016/j.mcn.2005.10.006 · Cited by 923
Peripheral Infusion of IGF-I Selectively Induces Neurogenesis in the Adult Rat Hippocampus
Åberg, M. A. I., Åberg, N. D., Hedbäcker, H., Oscarsson, J., & Eriksson, P. S. (2000) · The Journal of Neuroscience · doi:10.1523/jneurosci.20-08-02896.2000 · Cited by 852
Brain inflammation and adult neurogenesis: The dual role of microglia
Ekdahl, C. T., Kokaia, Z., & Lindvall, O. (2009) · Neuroscience · doi:10.1016/j.neuroscience.2008.06.052 · Cited by 801
Bett, A. J., Haddara, W. M. R., PREVEC, L., & Graham, F. L. (1994) · Proceedings of the National Academy of Sciences · doi:10.1073/pnas.91.19.8802 · Cited by 742
Cited by
Sorted by citations
Coupled Proliferation and Apoptosis Maintain the Rapid Turnover of Microglia in the Adult Brain
Askew, K., Li, K., Olmos-Alonso, A., Garcia-Moreno, F., Liang, Y., Richardson, P., Tipton, T., Chapman, M. A., Riecken, K., Beccari, S., et al. (2017) · Cell Reports · doi:10.1016/j.celrep.2016.12.041 · Cited by 726
Self-citationDevelopment of a Chimeric Model to Study and Manipulate Human Microglia In Vivo
Hasselmann, J., Coburn, M. A., England, W., Figueroa Velez, D. X., Kiani Shabestari, S., Tu, C. H., McQuade, A., Kolahdouzan, M., Echeverria, K., Claes, C., et al. (2019) · Neuron · doi:10.1016/j.neuron.2019.07.002 · Cited by 380
To Kill a Microglia: A Case for CSF1R Inhibitors
Green, K. N., Crapser, J. D., & Hohsfield, L. A. (2020) · Trends in Immunology · doi:10.1016/j.it.2020.07.001 · Cited by 265
Shaping Neuronal Fate: Functional Heterogeneity of Direct Microglia-Neuron Interactions
Cserép, C., Pósfai, B., & Dénes, Á. (2021) · Neuron · doi:10.1016/j.neuron.2020.11.007 · Cited by 256
Infectious immunity in the central nervous system and brain function
Klein, R. S., Garber, C., & Howard, N. (2017) · Nature Immunology · doi:10.1038/ni.3656 · Cited by 235
Inflammatory Mediators and Pain in Endometriosis: A Systematic Review
Machairiotis, N., Vasilakaki, S., & Thomakos, N. (2021) · Biomedicines · doi:10.3390/biomedicines9010054 · Cited by 177
The P2X7 Receptor: Central Hub of Brain Diseases
Andrejew, R., Oliveira-Giacomelli, Á., Ribeiro, D. E., Glaser, T., Arnaud-Sampaio, V. F., Lameu, C., & Ulrich, H. (2020) · Frontiers in Molecular Neuroscience · doi:10.3389/fnmol.2020.00124 · Cited by 162
Born this way: Hippocampal neurogenesis across the lifespan
Kozareva, D. A., Cryan, J. F., & Nolan, Y. M. (2019) · Aging Cell · doi:10.1111/acel.13007 · Cited by 155
Lannes, N., Eppler, E., Etemad, S., Yotovski, P., & Filgueira, L. (2017) · Oncotarget · doi:10.18632/oncotarget.23106 · Cited by 155
Phenotypic clustering: a novel method for microglial morphology analysis
Verdonk, F., Roux, P., Flamant, P., Fiette, L., Bozza, F. A., Simard, S., Lemaire, M., Plaud, B., Shorte, S. L., Sharshar, T., et al. (2016) · Journal of Neuroinflammation · doi:10.1186/s12974-016-0614-7 · Cited by 142
Gerber, Y. N., Saint-Martin, G., Bringuier, C. M., Bartolami, S., Goze‐Bac, C., Noristani, H. N., & Perrin, F. E. (2018) · Frontiers in Cellular Neuroscience · doi:10.3389/fncel.2018.00368 · Cited by 119
Grabert, K., Sehgal, A., Irvine, K. M., Wollscheid-Lengeling, E., Ozdemir, D. D., Stables, J., Luke, G. A., Ryan, M. D., Adamson, A., Humphreys, N. E., et al. (2020) · The Journal of Immunology · doi:10.4049/jimmunol.2000835 · Cited by 114
Cellular and molecular pathophysiology in the progression of Parkinson’s disease
Zaman, V., Shields, D. C., Shams, R., Drasites, K. P., Matzelle, D. D., Haque, A., & Banik, N. L. (2021) · Metabolic Brain Disease · doi:10.1007/s11011-021-00689-5 · Cited by 119
Insights Into the Role of CSF1R in the Central Nervous System and Neurological Disorders
Hu, B., Duan, S., Wang, Z., Li, X., Zhou, Y., Zhang, X., Zhang, Y., Xu, H., & Zheng, H. (2021) · Frontiers in Aging Neuroscience · doi:10.3389/fnagi.2021.789834 · Cited by 112
New Insights into Microglia–Neuron Interactions: A Neuron’s Perspective
Pósfai, B., Cserép, C., Orsolits, B., & Dénes, Á. (2019) · Neuroscience · doi:10.1016/j.neuroscience.2018.04.046 · Cited by 98
Engineering an inhibitor-resistant human CSF1R variant for microglia replacement
Chadarevian, J. P., Lombroso, S. I., Peet, G. C., Hasselmann, J., Tu, C. H., Marzan, D. E., Capocchi, J. K., Purnell, F. S., Nemec, K. M., Lahian, A., et al. (2022) · The Journal of Experimental Medicine · doi:10.1084/jem.20220857 · Cited by 101
The emerging tale of microglia in psychiatric disorders
Rahimian, R., Wakid, M., O’Leary, L. A., & Mechawar, N. (2021) · Neuroscience & Biobehavioral Reviews · doi:10.1016/j.neubiorev.2021.09.023 · Cited by 96
Indulekha, K., Alam, S., Surendar, J., Frohberger, S. J., Hansen, J. N., Kuehlwein, J. M., Hölbling, B. V., Schumak, B., Hübner, M. P., Gräler, M. H., et al. (2019) · Glia · doi:10.1002/glia.23663 · Cited by 89
Jiang, X., Yi, S., Liu, Q., Su, D., Li, L., Xiao, C., & Zhang, J. (2022) · Journal of Neuroinflammation · doi:10.1186/s12974-022-02478-y · Cited by 89
High-Fat Diet-Induced Obesity Causes Sex-Specific Deficits in Adult Hippocampal Neurogenesis in Mice
Robison, L. S., Albert, N. M., Camargo, L. A., Anderson, B. M., Salinero, A. E., Riccio, D. A., Abi‐Ghanem, C., Gannon, O. J., & Zuloaga, K. L. (2019) · eNeuro · doi:10.1523/eneuro.0391-19.2019 · Cited by 90
Microglia as Therapeutic Target for Radiation-Induced Brain Injury
Liu, Q., Yan, H., Duan, M., Yang, Q., Ren, B., & Tang, F. R. (2022) · International Journal of Molecular Sciences · doi:10.3390/ijms23158286 · Cited by 84
Gray, S. C., Kinghorn, K. J., & Woodling, N. S. (2020) · Neural Regeneration Research · doi:10.4103/1673-5374.272571 · Cited by 76
Microglial control of neuronal development via somatic purinergic junctions
Cserép, C., Schwarcz, A. D., Pósfai, B., László, Z. I., Kellermayer, A., Környei, Z., Kisfali, M., Nyerges, M., Lele, Z., Katona, I., et al. (2022) · Cell Reports · doi:10.1016/j.celrep.2022.111369 · Cited by 73
Hare, D. J., Raven, E. P., Roberts, B. R., Bogeski, M., Portbury, S. D., McLean, C., Masters, C. L., Connor, J. R., Bush, A. I., Crouch, P. J., et al. (2016) · NeuroImage · doi:10.1016/j.neuroimage.2016.05.057 · Cited by 70
Mastroeni, D., Nolz, J., Sekar, S., Delvaux, E., Serrano, G. E., Cuyugan, L., Liang, W. S., Beach, T. G., Rogers, J., & Coleman, P. D. (2017) · Neurobiology of Aging · doi:10.1016/j.neurobiolaging.2017.10.019 · Cited by 67
Microbiome Influence in the Pathogenesis of Prion and Alzheimer’s Diseases
D’Argenio, V., & Sarnataro, D. (2019) · International Journal of Molecular Sciences · doi:10.3390/ijms20194704 · Cited by 64
Poulen, G., Aloy, E., Bringuier, C. M., Mestre‐Francés, N., Artus, E. V. F., Cardoso, M., Perez, J., Goze‐Bac, C., Boukhaddaoui, H., Lonjon, N., et al. (2021) · Theranostics · doi:10.7150/thno.61833 · Cited by 64
Schartz, N. D., Liang, H. Y., Carvalho, K., Chu, S., Mendoza‐Arvilla, A., Petrisko, T. J., Gómez-Arboledas, Á., Mortazavi, A., & Tenner, A. J. (2024) · Nature Communications · doi:10.1038/s41467-024-51163-6 · Cited by 66
Fatty Acid Synthesis in Glial Cells of the CNS
Corrales, A. V. G., Haidar, M., Bogie, J. F. J., & Hendriks, J. J. A. (2021) · International Journal of Molecular Sciences · doi:10.3390/ijms22158159 · Cited by 59
Glucocorticoids as Regulators of Macrophage-Mediated Tissue Homeostasis
Díaz-Jiménez, D., Kolb, J. P., & Cidlowski, J. A. (2021) · Frontiers in Immunology · doi:10.3389/fimmu.2021.669891 · Cited by 59
Role of Microglia in Modulating Adult Neurogenesis in Health and Neurodegeneration
Al‐Onaizi, M., Al-Khalifah, A., Qasem, D., & ElAli, A. (2020) · International Journal of Molecular Sciences · doi:10.3390/ijms21186875 · Cited by 60
Faust, A. E., Kandakatla, A., van der Merwe, Y., Ren, T., Huleihel, L., Hussey, G. S., Naranjo, J. D., Johnson, S. A., Badylak, S. F., & Steketee, M. B. (2017) · Journal of Biomaterials Applications · doi:10.1177/0885328217698062 · Cited by 49
Wilkins, H., Koppel, S. J., Weidling, I. W., Roy, N., Ryan, L. N., Stanford, J. A., & Swerdlow, R. H. (2016) · Journal of Neuroimmune Pharmacology · doi:10.1007/s11481-016-9704-7 · Cited by 52
Disruption of the Microglial ADP Receptor P2Y13 Enhances Adult Hippocampal Neurogenesis
Stefani, J., Tschesnokowa, O., Parrilla, M., Robaye, B., Boeynaems, J. M., Acker‐Palmer, A., Zimmermann, H., & Gampe, K. (2018) · Frontiers in Cellular Neuroscience · doi:10.3389/fncel.2018.00134 · Cited by 50
FKBP5 and early life stress affect the hippocampus by an age-dependent mechanism
Criado‐Marrero, M., Smith, T. M., Gould, L. A., Kim, S., Penny, H. J., Sun, Z., Gulick, D., Dickey, C. A., & Blair, L. J. (2020) · Brain Behavior & Immunity - Health · doi:10.1016/j.bbih.2020.100143 · Cited by 45
Morris, G., Puri, B. K., Maes, M. H. J., OLIVE, L. S., Berk, M., & Carvalho, A. F. (2020) · Progress in Neuro-Psychopharmacology and Biological Psychiatry · doi:10.1016/j.pnpbp.2020.109858 · Cited by 42
Microglia-induced neuroinflammation in hippocampal neurogenesis following traumatic brain injury
Navabi, S. P., Badreh, F., Shooshtari, M. K., Hajipour, S., Vastegani, S. M., & Khoshnam, S. E. (2024) · Heliyon · doi:10.1016/j.heliyon.2024.e35869 · Cited by 42
Carrier, M., Šimončičová, E., St‐Pierre, M., McKee, C., & Tremblay, M. (2021) · Frontiers in Molecular Neuroscience · doi:10.3389/fnmol.2021.749737 · Cited by 37
Yao, X., Yang, C., Wang, C., Li, H., Zhao, J., Kang, X., Liu, Z., Chen, L., Chen, X., Pu, T., et al. (2022) · International Journal of Molecular Sciences · doi:10.3390/ijms23158316 · Cited by 37
An overview of microglia ontogeny and maturation in the homeostatic and pathological brain
Mendes, M. S., & Majewska, A. K. (2021) · European Journal of Neuroscience · doi:10.1111/ejn.15225 · Cited by 35
Identifying molecular mediators of environmentally enhanced neurogenesis
Eisinger, B. E., & Zhao, X. (2017) · Cell and Tissue Research · doi:10.1007/s00441-017-2718-5 · Cited by 35
Park, B.-K., Kim, Y. H., Kim, Y. R., Choi, J. J., Yang, C., Jang, I., & Lee, M. Y. (2019) · Evidence-based Complementary and Alternative Medicine · doi:10.1155/2019/7585896 · Cited by 33
Yadav, A., Tandon, A., Seth, B., Goyal, S., Singh, S. J., Tiwari, S. K., Agarwal, S., Nair, S., & Chaturvedi, R. K. (2020) · Molecular Neurobiology · doi:10.1007/s12035-020-02108-9 · Cited by 33
Yang, F. Y., Shi, B., Liu, X., Luo, J., Rao, Z., Rong, L., & Zeng, N. (2020) · Neural Plasticity · doi:10.1155/2020/8841332 · Cited by 31
Let’s make microglia great again in neurodegenerative disorders
Guillot‐Sestier, M., & Town, T. (2017) · Journal of Neural Transmission · doi:10.1007/s00702-017-1792-x · Cited by 26
Steroid hormones: risk and resilience in women’s Alzheimer disease
Calvo, N., & Einstein, G. (2023) · Frontiers in Aging Neuroscience · doi:10.3389/fnagi.2023.1159435 · Cited by 27
CNS Resident Innate Immune Cells: Guardians of CNS Homeostasis
Muzio, L., & Perego, J. (2024) · International Journal of Molecular Sciences · doi:10.3390/ijms25094865 · Cited by 27
Honig, M. G., Dorian, C. C., Worthen, J. D., Micetich, A. C., Mulder, I. A., Sanchez, K. B., Pierce, W. F., Mar, N. A. D., & Reiner, A. J. (2020) · European Journal of Neuroscience · doi:10.1111/ejn.14711 · Cited by 26
Cai, Q., Li, Y., Mao, J., & Pei, G. (2016) · Frontiers in Cellular Neuroscience · doi:10.3389/fncel.2016.00280 · Cited by 23
The Effects of Immune System Modulation on Prion Disease Susceptibility and Pathogenesis
Mabbott, N. A., Bradford, B. M., Pal, R., Young, R. A., & Donaldson, D. S. (2020) · International Journal of Molecular Sciences · doi:10.3390/ijms21197299 · Cited by 22
Microglial Transforming Growth Factor-β Signaling in Alzheimer’s Disease
Vidovic, N., & Spittau, B. (2024) · International Journal of Molecular Sciences · doi:10.3390/ijms25063090 · Cited by 22
Prion disease pathogenesis in the absence of the commensal microbiota
Bradford, B. M., Tetlow, L., & Mabbott, N. A. (2017) · Journal of General Virology · doi:10.1099/jgv.0.000860 · Cited by 19
Neuroprotective and Anti—Neuroinflammatory Effects of a Poisonous Plant Croton tiglium Linn. Extract
Gupta, D. P., Park, S. H., Yang, H., Suk, K., & Song, G. J. (2020) · Toxins · doi:10.3390/toxins12040261 · Cited by 20
Giacobbe, J., Pariante, C. M., & Borsini, A. (2020) · Journal of Psychopharmacology · doi:10.1177/0269881120936538 · Cited by 20
Vicente-Rodríguez, M., Mancuso, R., Peris-Yague, A., Simmons, C., NIMA Consortium, Wlazly, D., Dickinson, A., Foster, A., Knight, C., Leckey, C., et al. (2023) · Journal of Neuroinflammation · doi:10.1186/s12974-023-02769-y · Cited by 17
“Microgliosis and astrocytosis were previously described in the dentate gyrus area of the hippocampus of prion disease mice [32, 38, 39].”
BackgroundResultInfluentialIntranasally delivered mesenchymal stromal cells decrease glial inflammation early in prion disease
Hay, A. J. D., Latham, A. S., Mumford, G., Hines, A. D., Risen, S. J., Gordon, E., Siebenaler, C., Gilberto, V. S., Zabel, M. D., & Moreno, J. A. (2023) · Frontiers in Neuroscience · doi:10.3389/fnins.2023.1158408 · Cited by 17
The role of the immune system in prion infection
Mabbott, N. A., Alibhai, J. D., & Manson, J. C. (2018) · Handbook of clinical neurology · doi:10.1016/b978-0-444-63945-5.00005-2 · Cited by 17
Microglia, synaptic dynamics and forgetting
Wang, C., Wang, L., & Gu, Y. (2021) · Brain Research Bulletin · doi:10.1016/j.brainresbull.2021.06.005 · Cited by 20
The influence of the commensal and pathogenic gut microbiota on prion disease pathogenesis
Donaldson, D. S., & Mabbott, N. A. (2016) · Journal of General Virology · doi:10.1099/jgv.0.000507 · Cited by 17
Hoeijmakers, L., Amelianchik, A., Verhaag, F., Kotah, J. M., Lucassen, P. J., & Kőrösi, A. (2018) · Frontiers in Aging Neuroscience · doi:10.3389/fnagi.2018.00061 · Cited by 18
Zeller, M. V., Sebastião, A. M., & Valente, C. A. (2022) · Biomolecules · doi:10.3390/biom12050666 · Cited by 14
Microglia, physiology and behavior: A brief commentary
Walker, F. R., & Yirmiya, R. (2016) · Brain Behavior and Immunity · doi:10.1016/j.bbi.2016.03.006 · Cited by 14
Immunology of Prion Protein and Prions
Mabbott, N. A. (2017) · Progress in molecular biology and translational science · doi:10.1016/bs.pmbts.2017.06.004 · Cited by 541
Manganese induces neuroinflammation via NF-κB/ROS NLRP3 pathway in rat brain striatum and HAPI cells
Zhao, X., Yin, L., Wu, Y., Han, M., Zhuang, Y., Cong, Y., Liu, Y., Chen, G., & Jiang, J. (2019) · Molecular & Cellular Toxicology · doi:10.1007/s13273-019-0021-0 · Cited by 13
Enhanced Cognition and Neurogenesis in miR-146b Deficient Mice
Chithanathan, K., Somelar, K., Jürgenson, M., Žarkovskaja, T., Periyasamy, K., Yan, L., Magilnick, N., Boldin, M., Rebane, A., Tian, L., et al. (2022) · Cells · doi:10.3390/cells11132002 · Cited by 18
Epigenetic Regulation of the Hippocampus, with Special Reference to Radiation Exposure
Saw, G., & Tang, F. R. (2020) · International Journal of Molecular Sciences · doi:10.3390/ijms21249514 · Cited by 13
Li, Q., Li, H., Yao, X., Wang, C., Liu, H., Xu, D., Yang, C., Zhuang, H., Xiao, Y. M., Liu, R., et al. (2021) · Frontiers in Neuroscience · doi:10.3389/fnins.2021.749925 · Cited by 13
Molecular and histological correlates of cognitive decline across age in male C57BL/6J mice
Britton, R., Liu, A. T., Rege, S. V., Adams, J. M., Akrapongpisak, L., Le, D., Alcantara‐Lee, R., Estrada, R. A., Ray, R. D., Ahadi, S., et al. (2022) · Brain and Behavior · doi:10.1002/brb3.2736 · Cited by 14
Neurogenesis and Neuroinflammation in Dialogue: Mapping Gaps, Modulating Microglia, Rewiring Aging
Tanaka, M. (2026) · Cells · doi:10.3390/cells15010078 · Cited by 11
Peng, X., Yang, Z.-K., Guo, H., Wu, X., Ruganzu, J. B., Liu, Z.-Z., Wu, S.-D., & Yang, W.-N. (2025) · Molecular Neurobiology · doi:10.1007/s12035-025-05449-5 · Cited by 11
Hay, A. J. D., Popichak, K. A., Mumford, G., Shirley, P. M., Bian, J., Wolfrath, L., Lei, S., Eggers, M., Nicholson, E. M., Tjalkens, R. B., et al. (2025) · PLoS Pathogens · doi:10.1371/journal.ppat.1012582 · Cited by 12
Effects of Higher Normal Blood Pressure on Brain Are Detectable before Middle-Age and Differ by Sex
Alateeq, K., Walsh, E., Abhayaratna, W. P., & Cherbuin, N. (2022) · Journal of Clinical Medicine · doi:10.3390/jcm11113127 · Cited by 9
Overview of peripheral and central inflammatory responses and their contribution to neurotoxicity
Filipov, N. M. (2018) · Advances in neurotoxicology · doi:10.1016/bs.ant.2018.10.001 · Cited by 11
CSF1R inhibition at chronic stage after spinal cord injury modulates microglia proliferation
Perez, J., Poulen, G., Cardoso, M., Boukhaddaoui, H., Gazard, C., Courtand, G., Bertrand, S. S., Gerber, Y. N., & Perrin, F. E. (2023) · Glia · doi:10.1002/glia.24451 · Cited by 8
Impaired response to sleep deprivation in heterozygous Disc1 mutant mice
Tsao, C.-Y., Tuan, L., Lee, L. J., Liu, C., Hwu, H., & Lee, L. (2021) · The World Journal of Biological Psychiatry · doi:10.1080/15622975.2021.1907724 · Cited by 8
Hoeijmakers, L., Meerhoff, G. F., de Vries, J. W., Ruigrok, S. R., van Dam, A., LEUVEN, F. V., Kőrösi, A., & Lucassen, P. J. (2017) · Neurobiology of Aging · doi:10.1016/j.neurobiolaging.2017.09.013 · Cited by 7
In Situ Temporospatial Characterization of the Glial Response to Prion Infection
Michael, A. V., Greenlee, J. J., Harm, T. A., Moore, S. J., Zhang, M., Lind, M. S., Greenlee, M. H. W., & Smith, J. D. (2019) · Veterinary Pathology · doi:10.1177/0300985819861708 · Cited by 6
Lorenzen, K. A., Mathy, N. W., Whiteford, E. R., Eischeid, A. N., Chen, J., Behrens, M., Chen, X., & Shibata, A. (2021) · Molecular Biology Reports · doi:10.1007/s11033-020-06092-0 · Cited by 6
Borjini, N., Fernández, M., Giardino, L., Sorokin, L. M., & Calzà, L. (2025) · Cells · doi:10.3390/cells14060414 · Cited by 5
The Role of Glial Cells in Neurobiology and Prion Neuropathology
Hay, A. J. D., Popichak, K. A., Moreno, J. A., & Zabel, M. D. (2024) · Cells · doi:10.3390/cells13100832 · Cited by 6
Felice, E. D., Bobotis, B. C., Rigillo, G., Khakpour, M., de Andrade, E. G., Benatti, C., Vilella, A., Tascedda, F., Limatola, C., Tremblay, M., et al. (2024) · Brain Behavior and Immunity · doi:10.1016/j.bbi.2024.11.034 · Cited by 5
Piccardo, P., & Asher, D. M. (2018) · Arquivos de Neuro-Psiquiatria · doi:10.1590/0004-282x20180111 · Cited by 5
Hippocampal Microglia Activation Induced by Acute Pancreatic Injury in Rats
Cabral-França, T., Cruz, F. F., Silva, P. C., Pannain, V. L., Fernandes, A., Eulálio, J. M. R., Paiva, M. M., Ramos, H. M., Manso, J. E. F., & Baetas‐da‐Cruz, W. (2023) · Digestive Diseases and Sciences · doi:10.1007/s10620-023-08167-x · Cited by 5
Ma, Y., Lee, H., Chan, K., Eskandarian, L., Gaudet, K., Tian, Q., Bhatt, A., Gerold, J., Russo, A. W., Salat, D. H., et al. (2025) · Aging Cell · doi:10.1111/acel.70274 · Cited by 5
Godeanu, S., Mușat, M. I., Scheller, A., Osiac, E., & Cătălin, B. (2025) · Frontiers in Neuroanatomy · doi:10.3389/fnana.2024.1507140 · Cited by 4
Schartz, N. D., Liang, H. Y., Carvalho, K., Chu, S., Mendoza‐Arvilla, A., Petrisko, T. J., Gómez-Arboledas, Á., Mortazavi, A., & Tenner, A. J. (2023) · bioRxiv (Cold Spring Harbor Laboratory) · doi:10.1101/2023.08.22.554306 · Cited by 4
Neonatal Brain Injury Triggers Niche-Specific Changes to Cellular Biogeography
Tahmasian, N., Feng, M. Y., Arbabi, K., Rusu, B., Cao, W., Kukreja, B., Lubotzky, A., Wainberg, M., Tripathy, S. J., & Kalish, B. T. (2024) · eNeuro · doi:10.1523/eneuro.0224-24.2024 · Cited by 3
Versatile use of rtTA-expressing retroviruses in the study of neurodegeneration
Teixeira, C. M., Ávila, J., & Llorens-Martı́n, M. (2016) · Oncotarget · doi:10.18632/oncotarget.14386 · Cited by 3
Functional Analysis of a Novel Immortalized Murine Microglia Cell Line in 3D Spheroid Model
Angst, G., Tang, X., & Wang, C. (2023) · Neurochemical Research · doi:10.1007/s11064-023-03952-6 · Cited by 3
Contactomics of Microglia and Intercellular Communication
Cserép, C., Pósfai, B., Szabadits, E., & Dénes, Á. (2024) · Advances in neurobiology · doi:10.1007/978-3-031-55529-9_8 · Cited by 1
Perinatal Brain Injury Triggers Niche-Specific Changes to Cellular BiogeographyPreprint
Tahmasian, N., Feng, M. Y., Arbabi, K., Rusu, B., Cao, W., Kukreja, B., Lubotzky, A., Wainberg, M., Tripathy, S. J., & Kalish, B. T. (2024) · bioRxiv (Cold Spring Harbor Laboratory) · doi:10.1101/2024.02.25.581974 · Cited by 1
Reactive Neurogenesis in the Forebrain of the Leopard Gecko
Austin, L. E. (2020) · The Atrium (University of Guelph)
Microglia induce neurogenesis by stimulating PI3K/AKT intracellular signaling in vitroPreprint
Lorenzen, K. A., Mathy, N. W., Whiteford, E. R., Eischeid, A. N., Chen, J., Behrens, M., Chen, X., & Shibata, A. (2019) · doi:10.21203/rs.2.11343/v1
Somatic junctions connect microglia and developing neuronsPreprint
Cserép, C., Schwarcz, A. D., Pósfai, B., László, Z. I., Kellermayer, A., Nyerges, M., Lele, Z., Katona, I., & Dénes, Á. (2021) · bioRxiv (Cold Spring Harbor Laboratory) · doi:10.1101/2021.03.25.436920 · Cited by 1
Microglia induce neurogenesis by stimulating PI3K/AKT intracellular signaling in vitroPreprint
Lorenzen, K. A., Mathy, N. W., Whiteford, E. R., Eischeid, A. N., Chen, J., Behrens, M., Chen, X., & Shibata, A. (2020) · doi:10.21203/rs.2.11343/v3
Microglia induce neurogenesis by stimulating PI3K/AKT intracellular signaling in vitroPreprint
Lorenzen, K. A., Mathy, N. W., Whiteford, E. R., Eischeid, A. N., Chen, J., Behrens, M., Chen, X., & Shibata, A. (2019) · doi:10.21203/rs.2.11343/v2
Kukuia, K. K. E., Takyi, F. Y., Dugbartey, G. J., Amoateng, P., Kudzi, W., Amponsah, S. K., Koomson, A. E., Appiah, F., Adi‐Dako, O., Ameyaw, E. O., et al. (2023) · Molecular Psychology Brain Behavior and Society · doi:10.12688/molpsychol.17508.1
Microglia activation induced by a rat model of mild acute pancreatitisPreprint
Cabral-França, T., Cruz, F. F., Silva, P. C., Pannain, V. L., Fernandes, A., Eulálio, J. M. R., Paiva, M. M., Ramos, H. M., Manso, J. E. F., & Baetas‐da‐Cruz, W. (2023) · Research Square · doi:10.21203/rs.3.rs-3083187/v1
Kukuia, K. K. E., Takyi, F. Y., Dugbartey, G. J., Amoateng, P., Kudzi, W., Amponsah, S. K., Koomson, A. E., Appiah, F., Adi‐Dako, O., Ameyaw, E. O., et al. (2024) · Molecular Psychology Brain Behavior and Society · doi:10.12688/molpsychol.17508.2
Shtrahman, M., Parylak, S., Toda, T., & Gage, F. H. (2025) · Oxford University Press eBooks · doi:10.1093/med/9780190065324.003.0009
Metadata
- Authors
- De Lucia, C., Rinchon, A., Olmos-Alonso, A., Riecken, K., Fehse, B., Boche, D., Perry, V. H., & Gomez-Nicola, D.
- Affiliations
- University of Southampton (GB)
- University Medical Center Hamburg-Eppendorf (DE)
- ORCID
- Venue
- Brain, Behavior, and Immunity
- Publisher
- Elsevier BV
- Published
- 2016-07
- Volume
- 55
- Pages
- 179-190
- ISSN
- 0889-1591 (ISSN-L)
- PMC
- PMC4907582
- OpenAlex
- W2119211366
- Cited by
- 110
- References
- 58
- Citations by year
- 2026: 4 · 2025: 7 · 2024: 11 · 2023: 9 · 2022: 10 · 2021: 15 · 2020: 17 · 2019: 10 · 2018: 7 · 2017: 12 · 2016: 8
- FWCI
- 4.81
- Type
- journal article
- Language
- en
- Open access
- hybrid
- doi.org
- Licence
- Locations
- Brain Behavior and Immunity (publishedVersion, cc-by)
- PubMed Central (publishedVersion, cc-by)
- PubMed (publishedVersion)
- ePrints Soton (University of Southampton) (acceptedVersion)
- ORBi UMONS (submittedVersion)
- Funders
- Wessex Medical Research
- Medical Research Council (MR/K022687/1)
- Topics
- Life Sciences › Neuroscience › Neurology › Neuroinflammation and Neurodegeneration Mechanisms
- Life Sciences › Neuroscience › Developmental Neuroscience › Neurogenesis and neuroplasticity mechanisms
- Life Sciences › Neuroscience › Neurology › Neurological Disease Mechanisms and Treatments
- Keywords
- microglia, hippocampal neurogenesis, chronic neurodegeneration, prion disease, CSF1R, microglial proliferation, TGF-beta, neuronal differentiation, neurogenic niche, neuroinflammation, innate immunity
- MeSH terms
- Animals, Disease Models, Animal, Hippocampus, Mice, Inbred C57BL, Receptors, Granulocyte-Macrophage Colony-Stimulating Factor, Transforming Growth Factor beta, Prion Diseases, Microglia, Mice, Neurogenesis
About these checks
Registry, retraction, Cites and statistics results are computed, not judged, with one exception: a printed reference that no index lists is read once by a model before it counts as a citation error. Claims are extracted by a model and kept only when their quote appears verbatim in the text; each cited source is then checked, with a model’s help, for whether it says what the claim relies on. Those verdicts can be wrong — read the claim’s quote and the cited source before relying on one.
Statistics and arithmetic are recomputed, not judged.
Confidence bands are shown only for fields calibrated on our annotated test set. None is calibrated yet, so no band is shown.
What counts as a claim ›How we measure confidence ›How we check this ›
Are you an author, or do you see a problem with this page? Request a review
