

The DOI matches its Crossref record; 50 of the 51 references it cites were found in a registry or an index.
Crosstalk between Gut Microbiota and Dietary Lipids Aggravates WAT Inflammation through TLR Signaling
Open accessAbstract
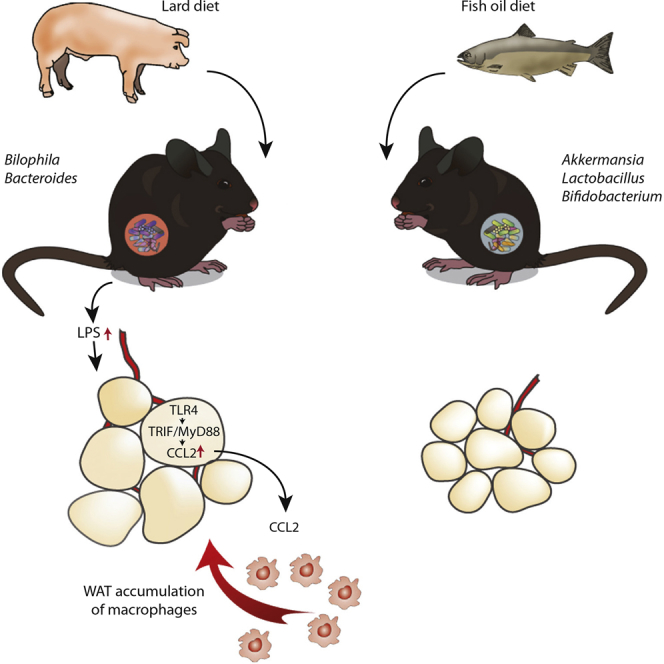
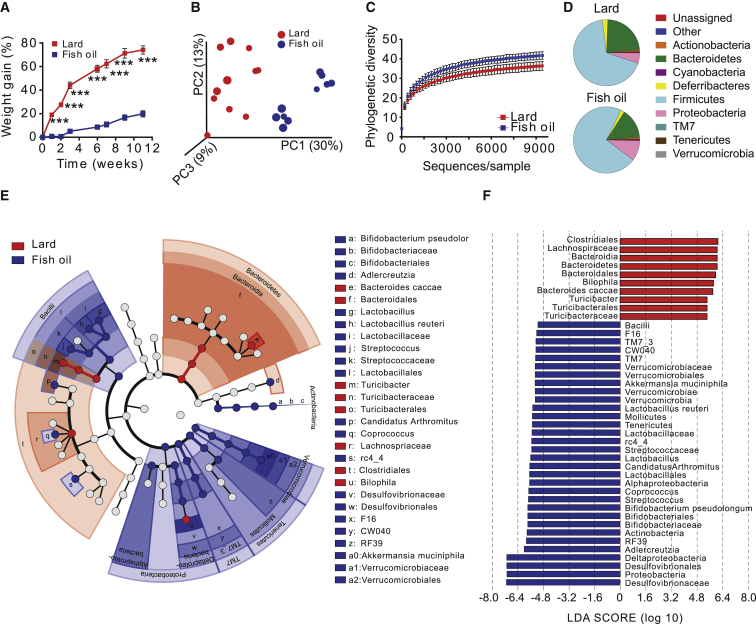
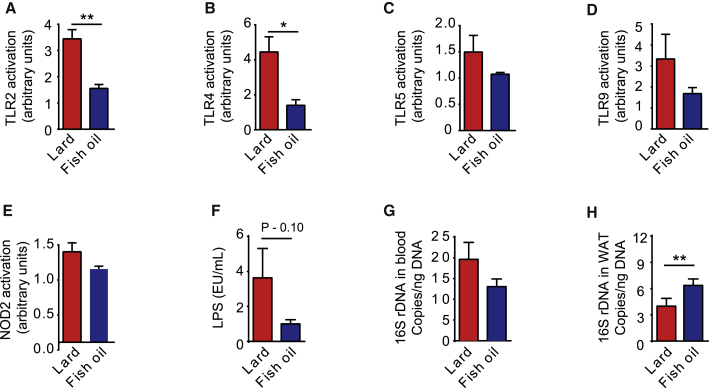
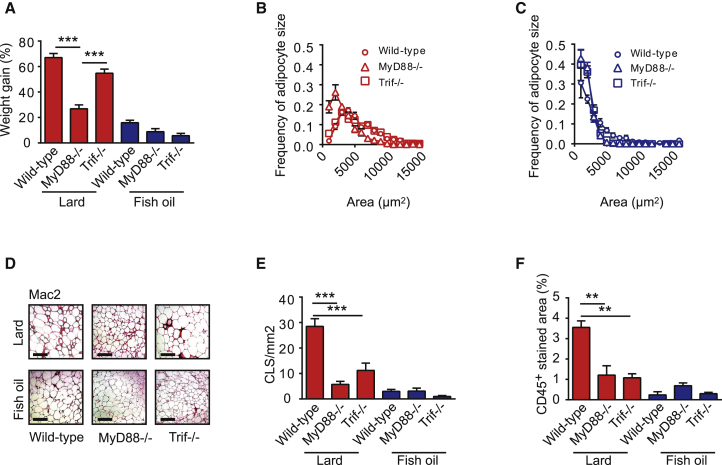
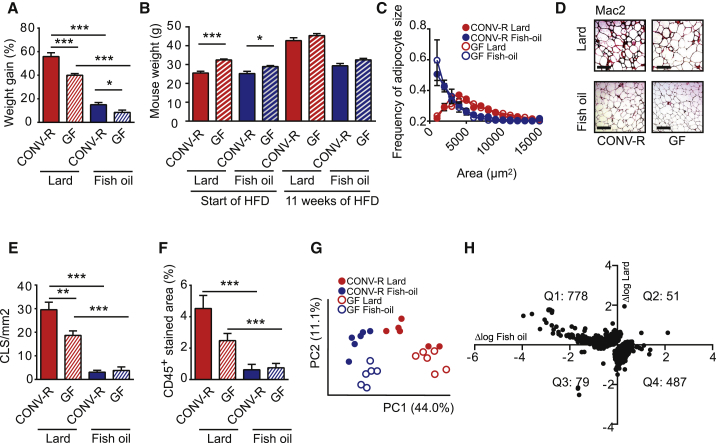
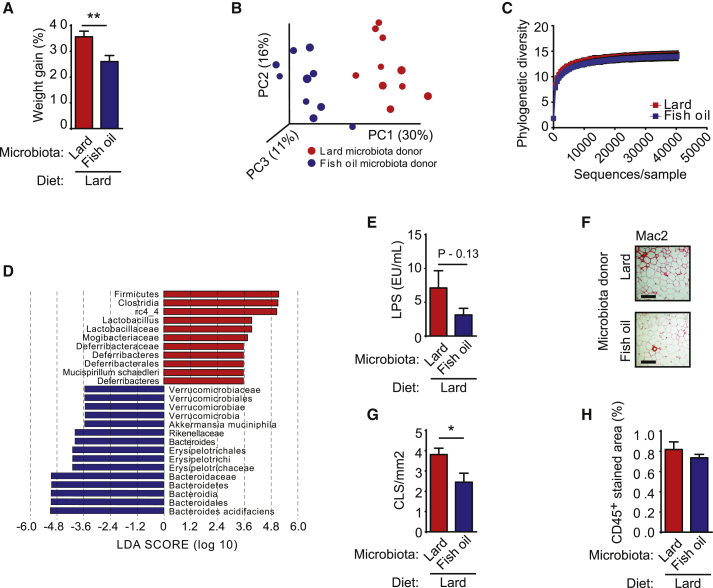
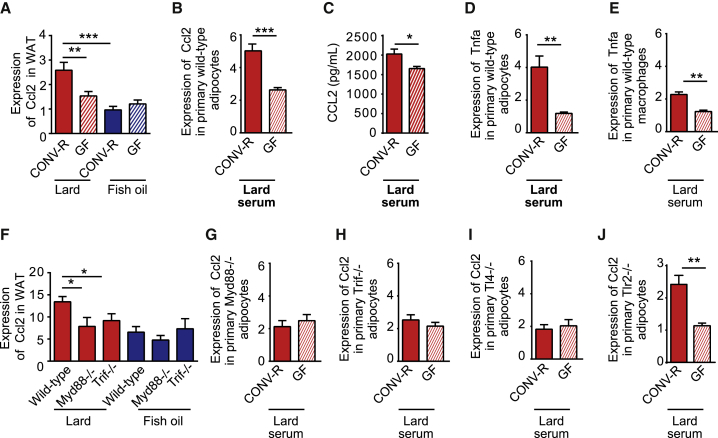
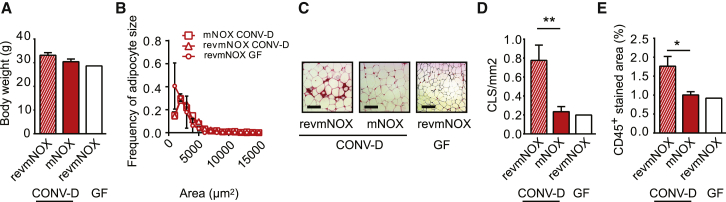
Dietary lipids may influence the abundance of circulating inflammatory microbial factors. Hence, inflammation in white adipose tissue (WAT) induced by dietary lipids may be partly dependent on their interaction with the gut microbiota. Here, we show that mice fed lard for 11 weeks have increased Toll-like receptor (TLR) activation and WAT inflammation and reduced insulin sensitivity compared with mice fed fish oil and that phenotypic differences between the dietary groups can be partly attributed to differences in microbiota composition. Trif(-/-) and Myd88(-/-) mice are protected against lard-induced WAT inflammation and impaired insulin sensitivity. Experiments in germ-free mice show that an interaction between gut microbiota and saturated lipids promotes WAT inflammation independent of adiposity. Finally, we demonstrate that the chemokine CCL2 contributes to microbiota-induced WAT inflammation in lard-fed mice. These results indicate that gut microbiota exacerbates metabolic inflammation through TLR signaling upon challenge with a diet rich in saturated lipids.
Overview
The claims and statistics of this paper haven’t been checked yet.
Run the check — free, no account needed. It reads the open-access text and checks the sources it cites.
Integrity signals
Registry
Cites
Statistics
Figures
Verification
Claims the paper makes
The claims and statistics of this paper haven’t been checked yet.
Run the check — free, no account needed. It reads the open-access text and checks the sources it cites.
Claims other papers make about this one
Each is checked against this paper’s own text: does it say what the citing paper says it does?
In the citing paper
“Saturated and unsaturated fats have profoundly different effects on the gut microbiota, and the altered microbiota that results from feeding unsaturated fats can offer protection from lard-induced weight gain44.”
From Diet–microbiota interactions as moderators of human metabolism (2016) · cites this paper as [44]
In the citing paper
“germ-free mice that are fed a high-fat diet with less sucrose are only partly protected against obesity44”
From Diet–microbiota interactions as moderators of human metabolism (2016) · cites this paper as [44]
In the citing paper
“A switch to a diet rich in saturated fatty acids shifts the composition of the microbiota44.”
From Diet–microbiota interactions as moderators of human metabolism (2016) · cites this paper as [44]
In the citing paper
“Similarly, increased levels of Bilophila and a reduced abundance of Desulfovibrio were observed in mice that were fed lard compared with fish oil as a source of fat44.”
From Diet–microbiota interactions as moderators of human metabolism (2016) · cites this paper as [44]
In the citing paper
“Latest data implied that omega-3 PUFAs modulate the intestinal microbiota composition and help normalize it after disrupting environmental stress [166,168].”
From The Role of Microbiota-Gut-Brain Axis in Neuropsychiatric and Neurological Disorders (2021) · cites this paper as [168]
In the citing paper
“In a rodent study, animals fed lard showed increases in Bacteroides and displayed signs of metabolic dysfunction.”
From The athletic gut microbiota (2020) · cites this paper as [229]
In the citing paper
“In contrast, animals fed fish oil showed increased levels of lactic acid bacteria and were protected from metabolic dysfunction [229].”
From The athletic gut microbiota (2020) · cites this paper as [229]
In the citing paper
“The gut microbiota has been shown to differ between mice fed diets that are high or low in fat and between diets that contain equal amounts of fat but from different sources [10–13] (Fig. 1).”
From Dietary lipids, gut microbiota and lipid metabolism (2019) · cites this paper as [10]
In the citing paper
“In another study where mice fed a high-fat diet containing lard, rich in saturated fat, were compared to mice fed a isocaloric high-fat diet containing fish oil, rich in n-3 PUFA, it was found that phylogenetic diversity and abundance of the beneficial bacteria Akkermansia muciniphila, Lactobacillus and Bifidobacterium were lower in mice on a lard diet [10].”
From Dietary lipids, gut microbiota and lipid metabolism (2019) · cites this paper as [10]
In the citing paper
“Transplantation of cecum microbiota into germ-free (GF) mice showed that the diet-induced differences in host phenotype were partly caused by the gut microbiota.”
From Dietary lipids, gut microbiota and lipid metabolism (2019) · cites this paper as [10]
In the citing paper
“The lard diet also reduced insulin sensitivity and increased inflammation in white adipose tissue (WAT) through activation of Toll-like receptor 4 (TLR4) signaling.”
From Dietary lipids, gut microbiota and lipid metabolism (2019) · cites this paper as [10]
Self-check
Percentages, sums and reported differences re-computed from the paper’s own numbers.
The self-check needs the paper’s full text.
Citations
Cites
Diet rapidly and reproducibly alters the human gut microbiome
David, L. A., Maurice, C. F., Carmody, R. N., Gootenberg, D. B., Button, J. E., Wolfe, B. E., Ling, A. V., Devlin, A. S., Varma, Y., Fischbach, M. A., et al. (2014) · Nature · doi:10.1038/nature12820 · Cited by 10,100
Obesity is associated with macrophage accumulation in adipose tissue
Weisberg, S. P., McCann, D., Desai, M., Rosenbaum, M., Leibel, R. L., & Ferrante, A. W. (2003) · Journal of Clinical Investigation · doi:10.1172/jci200319246 · Cited by 10,041
Metabolic Endotoxemia Initiates Obesity and Insulin Resistance
Cani, P. D., Amar, J., Iglesias, M. A., Poggi, M., Knauf, C., Bastelica, D., Neyrinck, A. M., Fava, F., Tuohy, K. M., Chabo, C., et al. (2007) · Diabetes · doi:10.2337/db06-1491 · Cited by 6,638
Self-citationInduction of Intestinal Th17 Cells by Segmented Filamentous Bacteria
Ivanov, I. I., Atarashi, K., Manel, N., Brodie, E. L., Shima, T., Karaoz, U., Wei, D., Goldfarb, K. C., Santee, C. A., Lynch, S. V., et al. (2009) · Cell · doi:10.1016/j.cell.2009.09.033 · Cited by 4,554
Cross-talk between Akkermansia muciniphila and intestinal epithelium controls diet-induced obesity
Everard, A., Belzer, C., Geurts, L., Ouwerkerk, J. P., Druart, C., Bindels, L. B., Guiot, Y., Derrien, M., Muccioli, G. G., Delzenne, N. M., et al. (2013) · Proceedings of the National Academy of Sciences · doi:10.1073/pnas.1219451110 · Cited by 4,511
Self-citationFunctional interactions between the gut microbiota and host metabolism
Tremaroli, V., & Bäckhed, F. (2012) · Nature · doi:10.1038/nature11552 · Cited by 4,387
Self-citationInteractions Between the Microbiota and the Immune System
Hooper, L. V., Littman, D. R., & Macpherson, A. J. (2012) · Science · doi:10.1126/science.1223490 · Cited by 4,173
TLR4 links innate immunity and fatty acid-induced insulin resistance
Shi, H., Kokoeva, M. V., Inouye, K., Tzameli, I., Yin, H., & Flier, J. S. (2006) · Journal of Clinical Investigation · doi:10.1172/jci28898 · Cited by 3,690
Kim, H. J., Park, S. Y., Choi, Y. J., Han, S. J., Lee, K. W., & Kim, D. J. (2013) · Hormone Research in Paediatrics · doi:10.1159/000348848 · Cited by 3,061
Kanda, H. (2006) · Journal of Clinical Investigation · doi:10.1172/jci26498 · Cited by 2,682
Cited by
Sorted by citations
Intestinal Crosstalk between Bile Acids and Microbiota and Its Impact on Host Metabolism
Wahlstrom, A. M., Sayin, S. I., Marschall, H., & Bäckhed, F. (2016) · Cell Metabolism · doi:10.1016/j.cmet.2016.05.005 · Cited by 2,969
Self-citationInfluence of diet on the gut microbiome and implications for human health
Singh, R. K., Chang, H.-W., Yan, D., Lee, K. M., Ucmak, D., Wong, K., Abrouk, M., Farahnik, B., Nakamura, M., Zhu, T. H., et al. (2017) · Journal of Translational Medicine · doi:10.1186/s12967-017-1175-y · Cited by 2,599
“Akkermansia muciniphila Gram negative obligate anaerobe oval‐shaped; nonmotile Anti‐inflammatory effects Reduced abundance in IBD, obesity, and psoriatic arthritis [53, 133, 185]”
Diet–microbiota interactions as moderators of human metabolism
Sonnenburg, J. L., & Bäckhed, F. (2016) · Nature · doi:10.1038/nature18846 · Cited by 2,257
Self-citationYou are what you eat: Diet, health and the gut microbiota
Zmora, N., Suez, J., & Elinav, E. (2019) · Nature Reviews Gastroenterology & Hepatology · doi:10.1038/s41575-018-0061-2 · Cited by 1,792
Dysbiosis and the immune system
Levy, M., Kolodziejczyk, A. A., Thaiss, C. A., & Elinav, E. (2017) · Nature Reviews Immunology · doi:10.1038/nri.2017.7 · Cited by 1,769
Metadata
- Authors
- Caesar, R., Tremaroli, V., Kovatcheva-Datchary, P., Cani, P. D., & Bäckhed, F.
- Affiliations
- University of Gothenburg (SE)
- Walloon Excellence in Lifesciences and Biotechnology (BE)
- University of Copenhagen (DK)
- Corresponding author
- Caesar, Robert
- Bäckhed, Fredrik
- Venue
- Cell Metabolism
- Publisher
- Elsevier BV
- Published
- 2015-10
- Volume
- 22
- Issue
- 4
- Pages
- 658-668
- ISSN
- 1550-4131 (ISSN-L)
- PMC
- PMC4598654
- OpenAlex
- W2096736123
- Cited by
- 960
- References
- 51
- Citations by year
- 2026: 43 · 2025: 52 · 2024: 76 · 2023: 89 · 2022: 124 · 2021: 109 · 2020: 114 · 2019: 105 · 2018: 88 · 2017: 85 · 2016: 59 · 2015: 12
- FWCI
- 35.30
- Type
- journal article
- Language
- en
- Open access
- hybrid
- doi.org
- Licence
- Locations
- Cell Metabolism (publishedVersion, cc-by-nc-nd)
- Europe PMC (PubMed Central) (publishedVersion, cc-by-nc-nd)
- PubMed Central (publishedVersion, cc-by-nc-nd)
- PubMed (publishedVersion)
- Research at the University of Copenhagen (University of Copenhagen) (publishedVersion, cc-by-nc-nd)
- Digital Access to Libraries (submittedVersion, other-oa)
- Funders
- Stiftelsen för Strategisk Forskning
- Fonds De La Recherche Scientifique - FNRS (WELBIO-CR-2012S-02R)
- Knut och Alice Wallenbergs Stiftelse
- Novo Nordisk
- Vetenskapsrådet
- Göteborgs Universitet
- Novo Nordisk Fonden (NNF13OC0008163)
- Walloon excellence in life sciences and biotechnology
- Wageningen University and Research
- Uppsala Multidisciplinary Center for Advanced Computational Science
- FP7 Food, Agriculture and Fisheries, Biotechnology
- Topics
- Life Sciences › Biochemistry, Genetics and Molecular Biology › Molecular Biology › Gut microbiota and health
- Health Sciences › Medicine › Endocrinology, Diabetes and Metabolism › Adipokines, Inflammation, and Metabolic Diseases
- Life Sciences › Immunology and Microbiology › Immunology › Immune Response and Inflammation
- Keywords
- gut microbiota, dietary fat, white adipose tissue inflammation, Toll-like receptor signaling, lard, fish oil, saturated fatty acids, insulin sensitivity, metabolic inflammation, CCL2 chemokine, MyD88, TRIF, germ-free mice
- MeSH terms
- Gastrointestinal Microbiome, Animals, Bacteria, Body Weight, DNA, Bacterial, Fish Oils, Inflammation, Male, Mice, Inbred C57BL, Phylogeny, Signal Transduction, Mice, Knockout, Chemokine CCL2, Adaptor Proteins, Vesicular Transport, Gastrointestinal Tract, Toll-Like Receptors, Mice, Adipose Tissue, White, Myeloid Differentiation Factor 88, Diet, High-Fat
About these checks
Registry, retraction, Cites and statistics results are computed, not judged, with one exception: a printed reference that no index lists is read once by a model before it counts as a citation error. Claims are extracted by a model and kept only when their quote appears verbatim in the text; each cited source is then checked, with a model’s help, for whether it says what the claim relies on. Those verdicts can be wrong — read the claim’s quote and the cited source before relying on one.
Statistics and arithmetic are recomputed, not judged.
Confidence bands are shown only for fields calibrated on our annotated test set. None is calibrated yet, so no band is shown.
What counts as a claim ›How we measure confidence ›How we check this ›
Are you an author, or do you see a problem with this page? Request a review
