

The DOI matches its Crossref record; 5 of the 5 references it cites were found in a registry or an index.
ASCARIS: Positional feature annotation and protein structure-based representation of single amino acid variations
Open accessPublished version of a preprint
Abstract
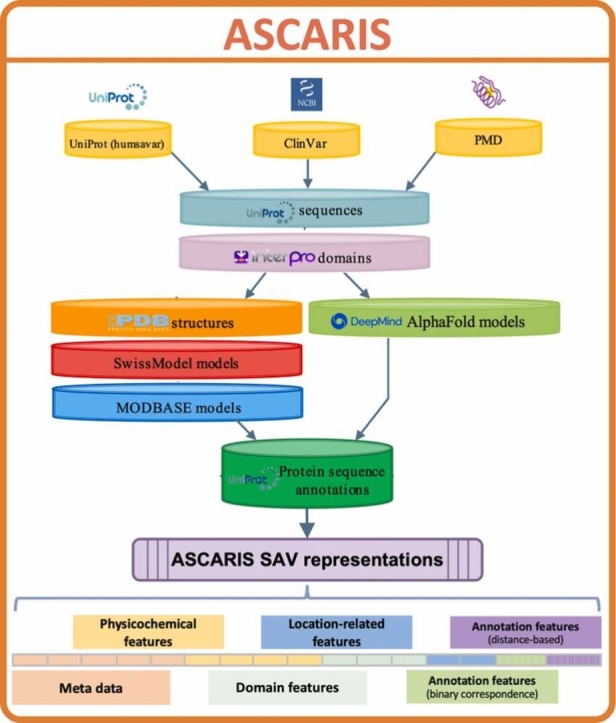
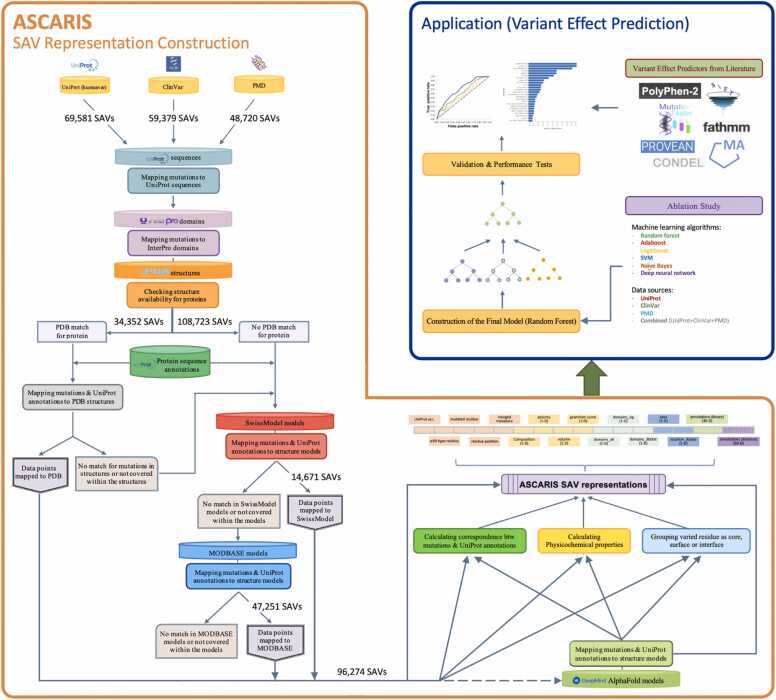
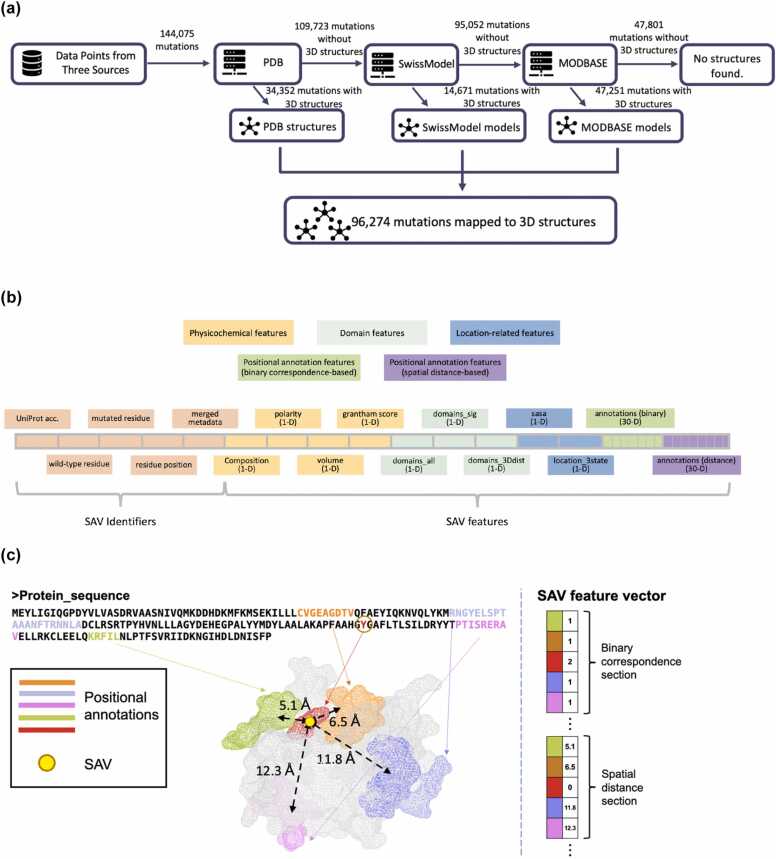
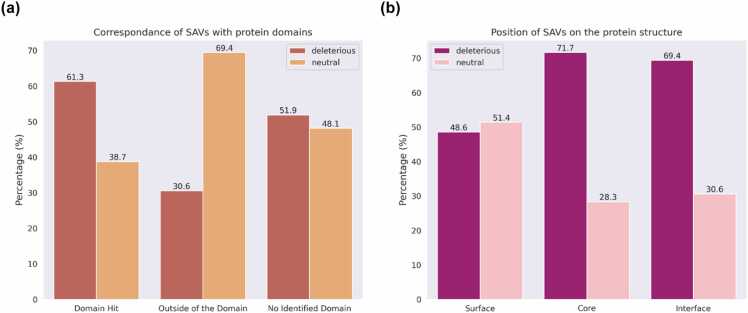
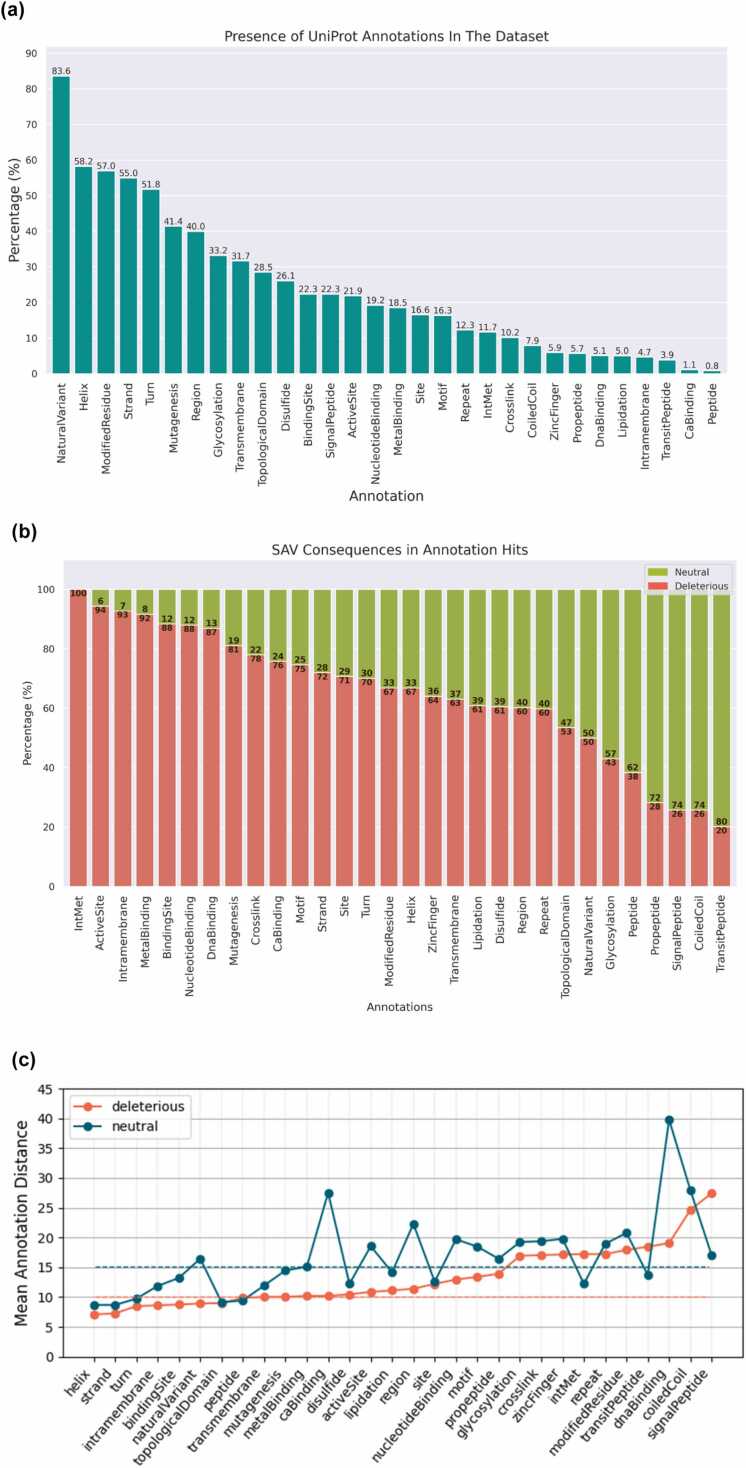
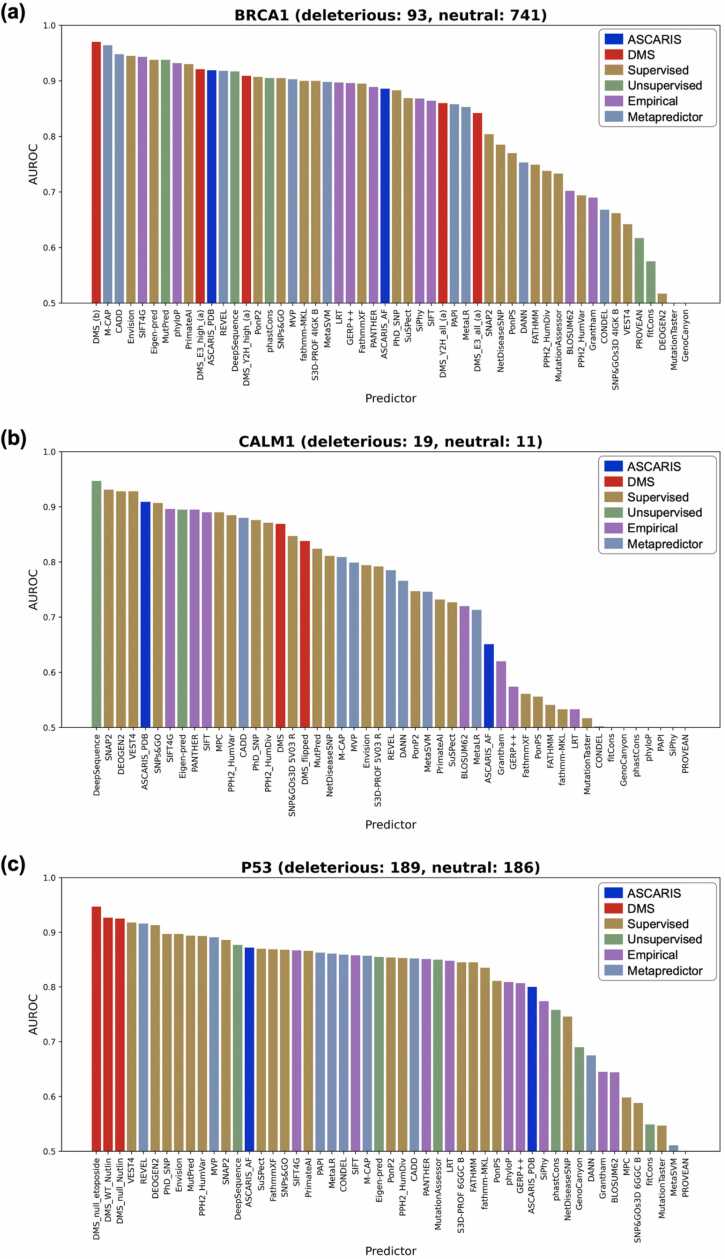
Background: Genomic variations may cause deleterious effects on protein functionality and perturb biological processes. Elucidating the effects of variations is critical for developing novel treatment strategies for diseases of genetic origin. Computational approaches have been aiding the work in this field by modeling and analyzing the mutational landscape. However, new approaches are required, especially for accurate representation and data-centric analysis of sequence variations. Method: In this study, we propose ASCARIS (Annotation and StruCture-bAsed RepresentatIon of Single amino acid variations), a method for the featurization (i.e., quantitative representation) of single amino acid variations (SAVs), which could be used for a variety of purposes, such as predicting their functional effects or building multi-omics-based integrative models. ASCARIS utilizes the direct and spatial correspondence between the location of the SAV on the sequence/structure and 30 different types of positional feature annotations (e.g., active/lipidation/glycosylation sites; calcium/metal/DNA binding, inter/transmembrane regions, etc.), along with structural features and physicochemical properties. The main novelty of this method lies in constructing reusable numerical representations of SAVs via functional annotations. Results: We statistically analyzed the relationship between these features and the consequences of variations and found that each carries information in this regard. To investigate potential applications of ASCARIS, we trained variant effect prediction models that utilize our SAV representations as input. We carried out an ablation study and a comparison against the state-of-the-art methods and observed that ASCARIS has a competing and complementary performance against widely-used predictors. ASCARIS can be used alone or in combination with other approaches to represent SAVs from a functional perspective. ASCARIS is available as a programmatic tool at https://github.com/HUBioDataLab/ASCARIS and as a web-service at https://huggingface.co/spaces/HUBioDataLab/ASCARIS.
Overview
The claims and statistics of this paper haven’t been checked yet.
Run the check — free, no account needed. It reads the open-access text and checks the sources it cites.
Integrity signals
Registry
Cites
Statistics
Figures
Verification
Claims the paper makes
The claims and statistics of this paper haven’t been checked yet.
Run the check — free, no account needed. It reads the open-access text and checks the sources it cites.
Self-check
Percentages, sums and reported differences re-computed from the paper’s own numbers.
The self-check needs the paper’s full text.
Citations
Cites
Highly accurate protein structure prediction with AlphaFold
Jumper, J., Evans, R., Pritzel, A., Green, T., Figurnov, M., Ronneberger, O., Tunyasuvunakool, K., Bates, R., Žídek, A., Potapenko, A., et al. (2021) · Nature · doi:10.1038/s41586-021-03819-2 · Cited by 43,764
Codon Optimality Is a Major Determinant of mRNA Stability
Presnyak, V., Alhusaini, N., Chen, Y.-H., Martin, S., Morris, N., Kline, N., Olson, S., Weinberg, D., Baker, K. E., Graveley, B. R., et al. (2015) · Cell · doi:10.1016/j.cell.2015.02.029 · Cited by 1,078
Understanding the contribution of synonymous mutations to human disease
Sauna, Z. E., & Kimchi-Sarfaty, C. (2011) · Nature Reviews Genetics · doi:10.1038/nrg3051 · Cited by 1,022
A HapMap harvest of insights into the genetics of common disease
Manolio, T. A., Brooks, L. D., & Collins, F. S. (2008) · Journal of Clinical Investigation · doi:10.1172/jci34772 · Cited by 889 · cited 1×
“Nonsynonymous single nucleotide variations have been associated with diseases [1,2] due to their effects, such as perturbing biological processes and impairing molecular functions of proteins by changing their stability or interactions [2–12].”
BackgroundINPS-MD: a web server to predict stability of protein variants from sequence and structure
Savojardo, C., Fariselli, P., Martelli, P. L., & Casadio, R. (2016) · Bioinformatics · doi:10.1093/bioinformatics/btw192 · Cited by 290
Research works printed but not linked: 82
- Hindorff L.A., Sethupathy P., Junkins H.A., Ramos E.M., Mehta J.P., Collins F.S. and Manolio T.A.: Potential etiologic and functional implications of genome-wide association loci for human diseases and traits. Proc Natl Acad Sci USA 2009; 106: 9362. · DOI · Paper page
- Fariselli P., Martelli P.L., Savojardo C. and Casadio R.: INPS: predicting the impact of non-synonymous variations on protein stability from sequence. Bioinformatics 2015; 31: 2816. · DOI
- Datta A., Mazumder M.H., Chowdhury A.S. and Hasan M.A.: Functional and structural consequences of damaging single nucleotide polymorphisms in human prostate cancer predisposition gene RNASEL. Biomed Res Int 2015; 2015: 271458. · DOI
- 10.1038/nature13835 · DOI · Paper page
- 10.1038/10297 · DOI
- 10.1038/nrg.2015.17 · DOI
- 10.1016/j.cell.2014.01.051 · DOI
- 10.1038/s41437-018-0104-z · DOI
- 10.1038/s42256-022-00457-9 · DOI
- 10.1002/humu.21047 · DOI
- 10.1038/nmeth0410-248 · DOI · Paper page
- Adzhubei I., Jordan D.M. and Sunyaev S.R.: Predicting functional effect of human missense mutations using PolyPhen-2. Curr Protoc Hum Genet, Chapter 2013; 7. Unit7.20.
- Bromberg Y. and Rost B.: SNAP: predict effect of non-synonymous polymorphisms on function. Nucleic Acids Res 2007; 35: 3823. · DOI
- Bromberg Y., Yachdav G. and Rost B.: SNAP predicts effect of mutations on protein function. Bioinformatics 2008; 24: 2397. · DOI
- 10.1158/0008-5472.CAN-09-1133 · DOI
- Chennen K., Weber T., Lornage X., Kress A., Böhm J., Thompson J., Laporte J. and Poch O.: MISTIC: A prediction tool to reveal disease-relevant deleterious missense variants. PLoS One 2020; 15: e0236962. · DOI
- 10.1093/bioinformatics/btv195 · DOI
- Clifford R.J., Edmonson M.N., Nguyen C. and Buetow K.H.: Large-scale analysis of non-synonymous coding region single nucleotide polymorphisms. Bioinformatics 2004; 20: 1006. · DOI
- Kaminker J.S., Zhang Y., Watanabe C. and Zhang Z.: CanPredict: a computational tool for predicting cancer-associated missense mutations. Nucleic Acids Res 2007; 35: W595. · DOI
- 10.1093/nar/gkg509 · DOI
- Pandurangan A.P. and Blundell T.L.: Prediction of impacts of mutations on protein structure and interactions: SDM, a statistical approach, and mCSM, using machine learning. Protein Sci 2020; 29: 247. · DOI
- 10.1093/bioinformatics/btt691 · DOI · Paper page
- 10.1093/bioinformatics/btw361 · DOI
- 10.1093/nar/gky1016 · DOI · Paper page
- 10.1038/nmeth.2890 · DOI · Paper page
- 10.1002/humu.20896 · DOI
- Topham C.M., Srinivasan N. and Blundell T.L.: Prediction of the stability of protein mutants based on structural environment-dependent amino acid substitution and propensity tables. Protein Eng 1997; 10: 7. · DOI
- 10.1093/nar/gkr363 · DOI
- Yang Y., Chen B., Tan G., Vihinen M. and Shen B.: Structure-based prediction of the effects of a missense variant on protein stability. Amino Acids 2013; 44: 847. · DOI
- 10.1016/j.jmb.2005.12.025 · DOI
- 10.1002/mgg3.214 · DOI
- Tan K.P., Kanitkar T.R., Kwoh C.K. and Madhusudhan M.S.: Packpred: predicting the functional effect of missense mutations. Front Mol Biosci 2021; 8: 646288. · DOI
- 10.1371/journal.pcbi.1007775 · DOI
- 10.1016/j.jmb.2019.04.009 · DOI
- Marquet C., Heinzinger M., Olenyi T., Dallago C., Erckert K., Bernhofer M., Nechaev D. and Rost B.: Embeddings from protein language models predict conservation and variant effects. Hum Genet 2022; 141: 1629. · DOI
- Meier J., Rao R., Verkuil R., Liu J., Sercu T. and Rives A.: Language models enable zero-shot prediction of the effects of mutations on protein function. bioRxiv 2021; . 2021.2007.2009.450648.
- Brandes N., Goldman G., Wang C.H., Ye C.J. and Ntranos V.: Genome-wide prediction of disease variants with a deep protein language model. bioRxiv 2022; 2022. 2008.2025.505311..
- 10.1093/nar/gky1049 · DOI · Paper page
- Kulmanov M. and Hoehndorf R.: DeepGOPlus: improved protein function prediction from sequence. Bioinformatics 2020; 36: 422. · DOI
- Rifaioglu A.S., Dogan T., Sarac O.S., Ersahin T., Saidi R., Atalay M.V., Martin M.J. and Cetin-Atalay R.: Large-scale automated function prediction of protein sequences and an experimental case study validation on PTEN transcript variants. Proteins 2018; 86: 135. · DOI
- Dogan T.: HPO2GO: prediction of human phenotype ontology term associations for proteins using cross ontology annotation co-occurrences. PeerJ 2018; 6: e5298. · DOI
- 10.1186/1471-2164-14-S3-S6 · DOI
- 10.1093/nar/gkx1153 · DOI · Paper page
- Kawabata T., Ota M. and Nishikawa K.: The Protein Mutant Database. Nucleic Acids Res 1999; 27: 355. · DOI
- Mudunuri U., Che A., Yi M. and Stephens R.M.: bioDBnet: the biological database network. Bioinformatics 2009; 25: 555. · DOI
- 10.1093/nar/28.1.235 · DOI · Paper page
- 10.1093/nar/gky427 · DOI
- 10.1093/nar/gkt1144 · DOI
- 10.1093/nar/gky1100 · DOI · Paper page
- Aboderin A.A.: An empirical hydrophobicity scale for α-amino-acids and some of its applications. Int J Biochem 1971; 2: 537. · DOI
- Goldsack D.E. and Chalifoux R.C.: Contribution of the free energy of mixing of hydrophobic side chains to the stability of the tertiary structure of proteins. J Theor Biol 1973; 39: 645. · DOI
- 10.1126/science.185.4154.862 · DOI
- Capriotti E., Ozturk K. and Carter H.: Integrating molecular networks with genetic variant interpretation for precision medicine. Wiley Interdiscip Rev Syst Biol Med 2019; 11: e1443. · DOI
- Engin H.B., Hofree M. and Carter H.: Identifying mutation specific cancer pathways using a structurally resolved protein interaction network. Pac Symp Biocomput 2015; : 84.
- 10.1073/pnas.0403255101 · DOI
- 10.1371/journal.pone.0066273 · DOI
- 10.12688/f1000research.7931.1 · DOI
- Momen-Roknabadi A., Sadeghi M., Pezeshk H. and Marashi S.-A.: Impact of residue accessible surface area on the prediction of protein secondary structures. BMC Bioinforma 2008; 9: 357. · DOI
- 10.1038/nmeth.4540 · DOI
- Breiman L.: Mach Learn 2001; 45: 261. · DOI
- Dasgupta A., Sun Y.V., König I.R., Bailey-Wilson J.E. and Malley J.D.: Brief review of regression-based and machine learning methods in genetic epidemiology: the Genetic Analysis Workshop 17 experience. Genet Epidemiol 2011; 35: S5. · DOI
- 10.1006/jcss.1997.1504 · DOI · Paper page
- Friedman J., Hastie T. and Tibshirani R.: Additive logistic regression: a statistical view of boosting (With discussion and a rejoinder by the authors). Ann Stat 2000; 28. · DOI · Paper page
- N. Cristianini J. Shawe-Taylor An Introduction to Support Vector Machines and Other Kernel-based Learning Methods 2000. · DOI · Paper page
- Hastie T., Friedman J. and Tibshirani R.: The Elements of Statistical Learning. : Springer Series in Statistics, 2001. · DOI · Paper page
- Doğan T., MacDougall A., Saidi R., Poggioli D., Bateman A., O'Donovan C. and Martin M.J.: UniProt-DAAC: domain architecture alignment and classification, a new method for automatic functional annotation in UniProtKB. Bioinformatics 2016; 32: 2264. · DOI
- 10.1002/humu.23738 · DOI
- 10.1002/bies.201600062 · DOI
- 10.1016/j.molp.2016.06.004 · DOI
- Cox M.A.A. and Cox T.F.: Multidimensional Scaling. Handb Data Vis 2008; : 315.
- van der M. and Geoffrey Hinton L.: Visualizing Data using t-SNE. J Mach Learn Res 2008; 9: 2579.
- 10.1101/gr.3804205 · DOI
- Doğan T., Akhan Güzelcan E., Baumann M., Koyas A., Atas H., Baxendale I.R., Martin M. and Cetin-Atalay R.: Protein domain-based prediction of drug/compound–target interactions and experimental validation on LIM kinases. PLOS Comput Biol 2021; 17: e1009171. · DOI
- Consortium G.P., Auton A., Brooks L., Durbin R., Garrison E. and Kang H.: A global reference for human genetic variation. Nature 2015; 526: 68. · DOI · Paper page
- Heberle H., Meirelles G.V., da Silva F.R., Telles G.P. and Minghim R.: InteractiVenn: a web-based tool for the analysis of sets through Venn diagrams. BMC Bioinforma 2015; 16: 169. · DOI
- 10.1002/humu.22768 · DOI · Paper page
- Livesey B.J. and Marsh J.A.: Using deep mutational scanning to benchmark variant effect predictors and identify disease mutations. Mol Syst Biol 2020; 16: e9380. · DOI
- Karczewski K. and Francioli L.: The genome aggregation database (gnomAD). MacArthur Lab 2017; : 1.
- 10.1002/ppul.22567 · DOI
- Bhattacharyya S. and Tobacman J.K.: Arylsulfatase B regulates colonic epithelial cell migration by effects on MMP9 expression and RhoA activation. Clin Exp Metastas-- 2009; 26: 535. · DOI
- Karageorgos L., Brooks D.A., Pollard A., Melville E.L., Hein L.K., Clements P.R., Ketteridge D., Swiedler S.J., Beck M., Giugliani R., Harmatz P., Wraith J.E., Guffon N., Leao Teles E., Sa Miranda M.C. and Hopwood J.J.: Mutational analysis of 105 mucopolysaccharidosis type VI patients. Hum Mutat 2007; 28: 897. · DOI
- 10.1093/nar/gkab543 · DOI
Metadata
- Authors
- Cankara, F., & Doğan, T.
- Affiliations
- Koç University (TR)
- Hacettepe University (TR)
- Corresponding author
- Doğan, Tunca
- Venue
- Computational and Structural Biotechnology Journal
- Published
- 2023-01
- Volume
- 21
- Pages
- 4743-4758
- ISSN
- 2001-0370 (ISSN-L)
- PMC
- PMC10562615
- OpenAlex
- W4386813159
- Cited by
- 1
- References
- 5
- Citations by year
- 2026: 1
- FWCI
- 0.17
- Type
- journal article
- Language
- en
- Open access
- gold
- doi.org
- Licence
- Locations
- Computational and Structural Biotechnology Journal (publishedVersion, cc-by-nc-nd)
- bioRxiv (Cold Spring Harbor Laboratory) (acceptedVersion, cc-by)
- PubMed Central (publishedVersion, cc-by-nc-nd)
- PubMed (publishedVersion)
- Digital Collections portal (Koç University) (submittedVersion)
- DOAJ (DOAJ: Directory of Open Access Journals) (submittedVersion, cc-by-sa)
- Funders
- Koç Üniversitesi
- Topics
- Life Sciences › Biochemistry, Genetics and Molecular Biology › Genetics › Genomics and Rare Diseases
- Life Sciences › Biochemistry, Genetics and Molecular Biology › Molecular Biology › Protein Structure and Dynamics
- Life Sciences › Biochemistry, Genetics and Molecular Biology › Molecular Biology › Machine Learning in Bioinformatics
- Keywords
- variant effect prediction, protein structure, functional annotation, protein binding sites, physicochemical properties, multi-omics integration, Ascaris
About these checks
Registry, retraction, Cites and statistics results are computed, not judged, with one exception: a printed reference that no index lists is read once by a model before it counts as a citation error. Claims are extracted by a model and kept only when their quote appears verbatim in the text; each cited source is then checked, with a model’s help, for whether it says what the claim relies on. Those verdicts can be wrong — read the claim’s quote and the cited source before relying on one.
Statistics and arithmetic are recomputed, not judged.
Confidence bands are shown only for fields calibrated on our annotated test set. None is calibrated yet, so no band is shown.
What counts as a claim ›How we measure confidence ›How we check this ›
Are you an author, or do you see a problem with this page? Request a review
