

The DOI matches its Crossref record; 102 of the 102 references it cites were found in a registry or an index.
Topological organization of the human brain functional connectome across the lifespan
Open accessAbstract
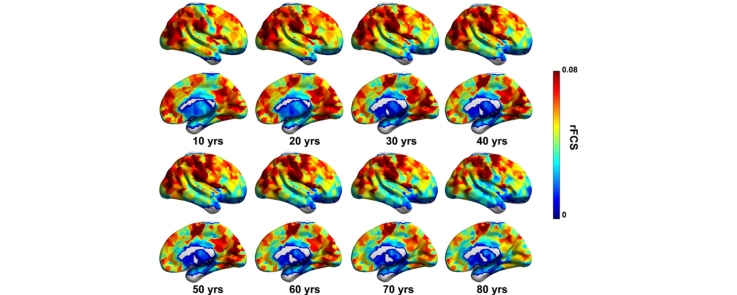
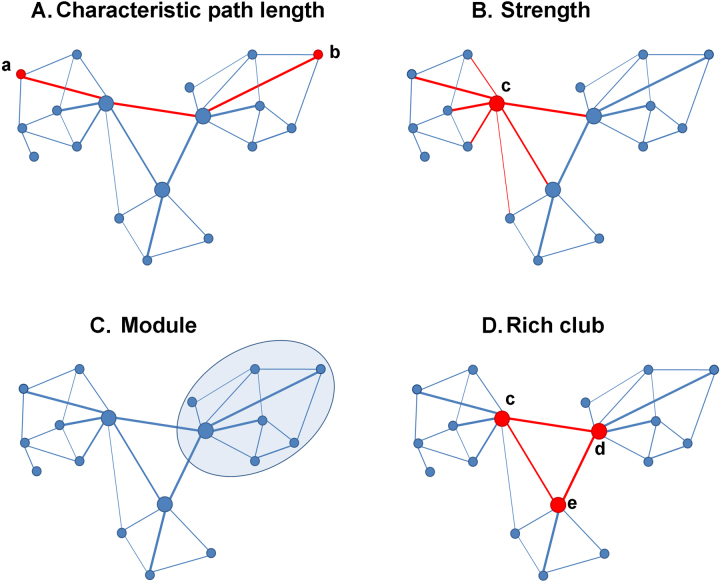
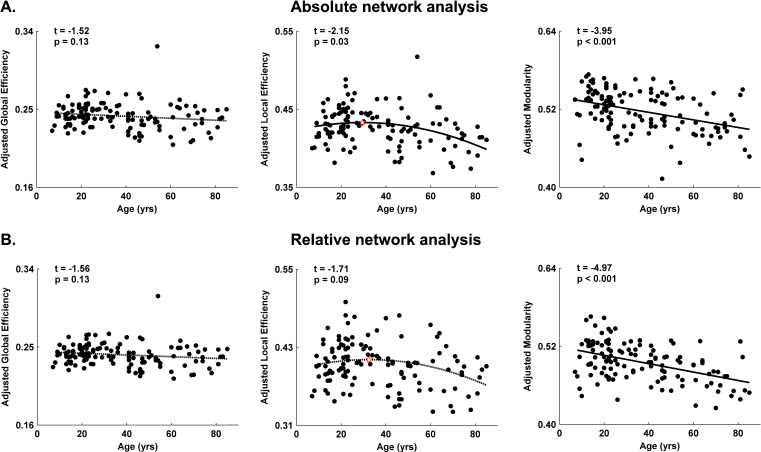
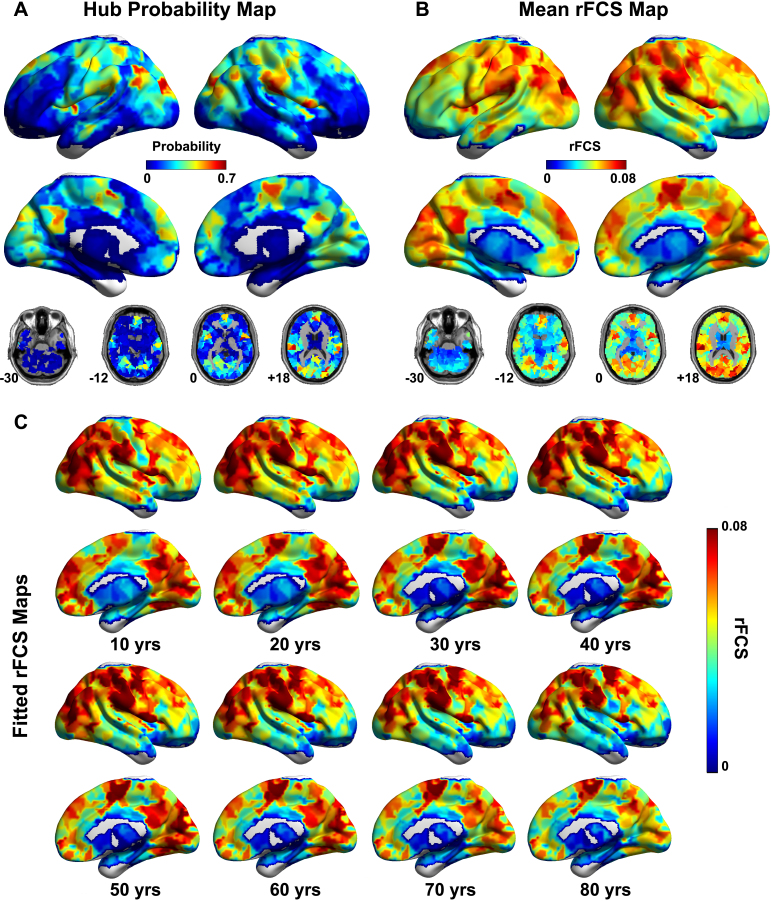
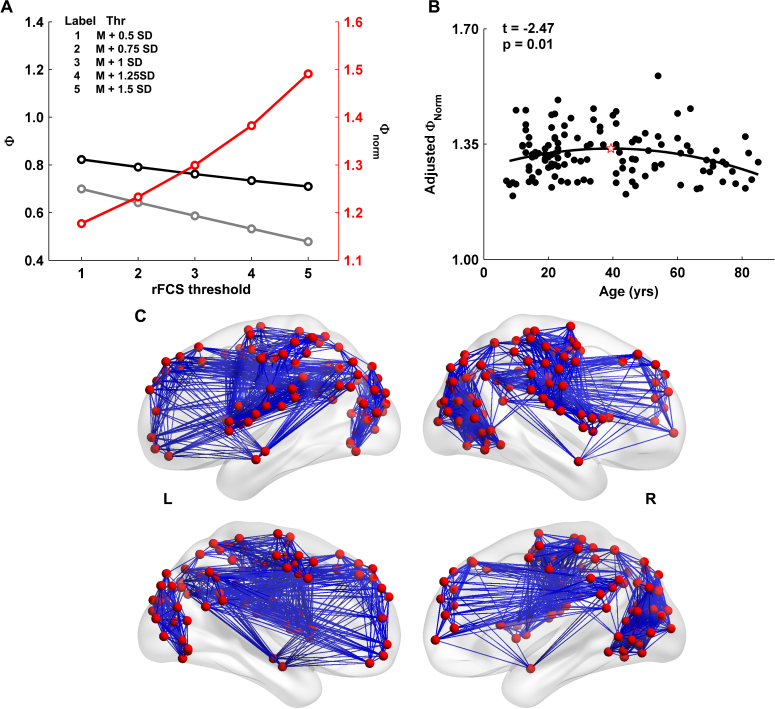
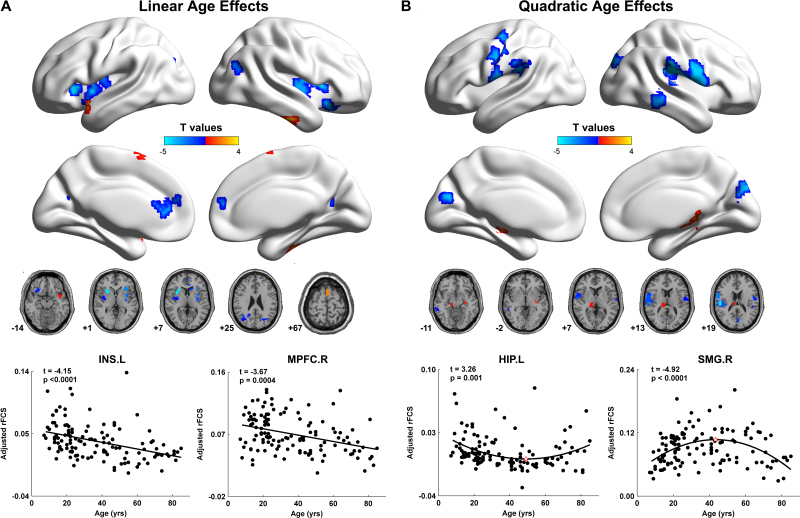
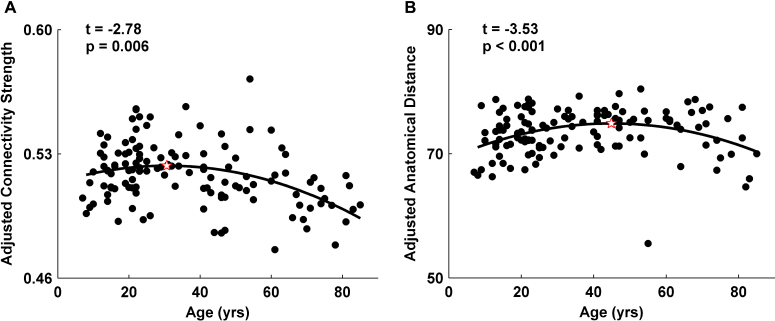
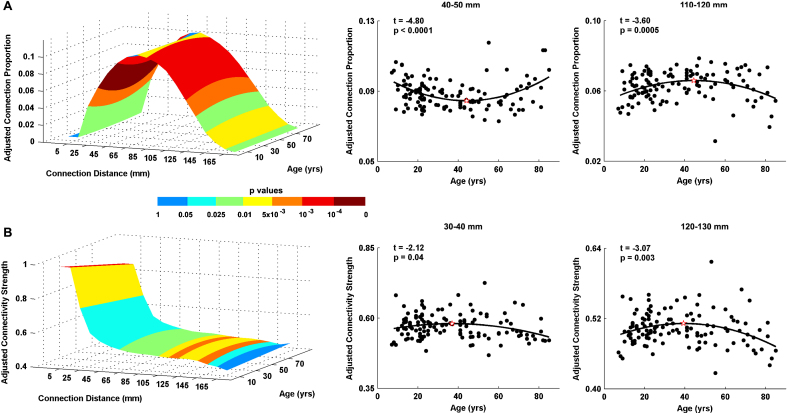
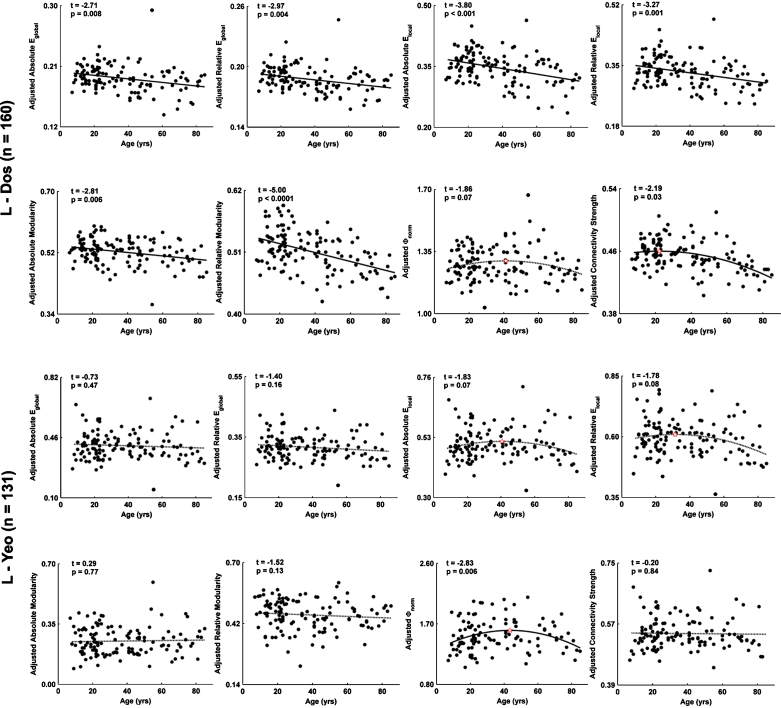
Human brain function undergoes complex transformations across the lifespan. We employed resting-state functional MRI and graph-theory approaches to systematically chart the lifespan trajectory of the topological organization of human whole-brain functional networks in 126 healthy individuals ranging in age from 7 to 85 years. Brain networks were constructed by computing Pearson's correlations in blood-oxygenation-level-dependent temporal fluctuations among 1024 parcellation units followed by graph-based network analyses. We observed that the human brain functional connectome exhibited highly preserved non-random modular and rich club organization over the entire age range studied. Further quantitative analyses revealed linear decreases in modularity and inverted-U shaped trajectories of local efficiency and rich club architecture. Regionally heterogeneous age effects were mainly located in several hubs (e.g., default network, dorsal attention regions). Finally, we observed inverse trajectories of long- and short-distance functional connections, indicating that the reorganization of connectivity concentrates and distributes the brain's functional networks. Our results demonstrate topological changes in the whole-brain functional connectome across nearly the entire human lifespan, providing insights into the neural substrates underlying individual variations in behavior and cognition. These results have important implications for disease connectomics because they provide a baseline for evaluating network impairments in age-related neuropsychiatric disorders.
Overview
The claims and statistics of this paper haven’t been checked yet.
Run the check — free, no account needed. It reads the open-access text and checks the sources it cites.
Integrity signals
Registry
Cites
Statistics
Figures
Verification
Claims the paper makes
The claims and statistics of this paper haven’t been checked yet.
Run the check — free, no account needed. It reads the open-access text and checks the sources it cites.
Claims other papers make about this one
Each is checked against this paper’s own text: does it say what the citing paper says it does?
In the citing paper
“high strength and betweenness hubs in adulthood are largely located within within the default mode, attentional, sensorimotor, and visual areas (Cao et al., 2014; Fransson et al., 2011; Grayson et al., 2014; Hwang et al., 2013)”
From Development of large-scale functional networks from birth to adulthood: A guide to the neuroimaging literature (2017) · cites this paper as Cao et al., 2014
In the citing paper
“Among cortical areas, some have reported increasing hubness of frontal nodes (Cao et al., 2014; Wu et al., 2013) while in other lobes there have been mixed reports of increasing (Cao et al., 2014; Grayson et al., 2014) and decreasing (Wu et al., 2013; Zuo et al., 2012), or stable (Hwang et al., 2013) hubness.”
From Development of large-scale functional networks from birth to adulthood: A guide to the neuroimaging literature (2017) · cites this paper as Cao et al., 2014
In the citing paper
“Returning to the MRI literature, there is convergent evidence that the locations of high-strength and high-betweenness hub regions appear to be stable after 5 years of age (Cao et al., 2014; Grayson et al., 2014; Hwang et al., 2013; Wang et al., 2012; Wu et al., 2013; Zuo et al., 2012).”
From Development of large-scale functional networks from birth to adulthood: A guide to the neuroimaging literature (2017) · cites this paper as Cao et al., 2014
In the citing paper
“More detailed network analyses have revealed that specific connections to cortical hub regions increase during childhood and adolescence (Grayson et al., 2014; Hwang et al., 2013) resulting in increased rich club coefficients in adulthood (Cao et al., 2014; Grayson et al., 2014).”
From Development of large-scale functional networks from birth to adulthood: A guide to the neuroimaging literature (2017) · cites this paper as Cao et al., 2014
Self-check
Percentages, sums and reported differences re-computed from the paper’s own numbers.
The self-check needs the paper’s full text.
Citations
Cites
A new look at the statistical model identification
Akaike, H. (1974) · IEEE Transactions on Automatic Control · doi:10.1109/tac.1974.1100705 · Cited by 51,879
Modularity and community structure in networks
Newman, M. E. J. (2006) · Proceedings of the National Academy of Sciences · doi:10.1073/pnas.0601602103 · Cited by 12,256
Complex brain networks: graph theoretical analysis of structural and functional systems
Bullmore, E., & Sporns, O. (2009) · Nature Reviews Neuroscience · doi:10.1038/nrn2575 · Cited by 11,820
Complex network measures of brain connectivity: Uses and interpretations
Rubinov, M., & Sporns, O. (2010) · NeuroImage · doi:10.1016/j.neuroimage.2009.10.003 · Cited by 11,522
Functional connectivity in the motor cortex of resting human brain using echo‐planar mri
Biswal, B., Zerrin Yetkin, F., Haughton, V. M., & Hyde, J. S. (1995) · Magnetic Resonance in Medicine · doi:10.1002/mrm.1910340409 · Cited by 9,812
The organization of the human cerebral cortex estimated by intrinsic functional connectivity
Thomas Yeo, B. T., Krienen, F. M., Sepulcre, J., Sabuncu, M. R., Lashkari, D., Hollinshead, M., Roffman, J. L., Smoller, J. W., Zöllei, L., Polimeni, J. R., et al. (2011) · Journal of Neurophysiology · doi:10.1152/jn.00338.2011 · Cited by 9,182
Power, J. D., Barnes, K. A., Snyder, A. Z., Schlaggar, B. L., & Petersen, S. E. (2012) · NeuroImage · doi:10.1016/j.neuroimage.2011.10.018 · Cited by 7,429
The organization of the human cerebellum estimated by intrinsic functional connectivity
Buckner, R. L., Krienen, F. M., Castellanos, A., Diaz, J. C., & Yeo, B. T. T. (2011) · Journal of Neurophysiology · doi:10.1152/jn.00339.2011 · Cited by 7,304
Spontaneous fluctuations in brain activity observed with functional magnetic resonance imaging
Fox, M. D., & Raichle, M. E. (2007) · Nature Reviews Neuroscience · doi:10.1038/nrn2201 · Cited by 6,700
Regression and time series model selection in small samples
HURVICH, C. M., & TSAI, C.-L. (1989) · Biometrika · doi:10.1093/biomet/76.2.297 · Cited by 6,586
Cited by
Sorted by citations
Items 301–400 of 440
Does functional system segregation mediate the effects of lifestyle on cognition in older adults?
Raykov, P., Knights, E., Cam‐CAN, & Henson, R. N. (2023) · Neurobiology of Aging · doi:10.1016/j.neurobiolaging.2023.11.009 · Cited by 7
Gorbach, T., Lundquist, A., de Luna, X., Nyberg, L. H., & Salami, A. (2020) · Brain Connectivity · doi:10.1089/brain.2020.0740 · Cited by 7
Simas, T., & Suckling, J. (2016) · Frontiers in Neuroscience · doi:10.3389/fnins.2016.00353 · Cited by 7
Predicting cognitive functioning in mood disorders through smartphone typing dynamics.
Ning, E., Estabrook, R., Tulabandhula, T., Zulueta, J., Ross, M. K., Kabir, S., Hussain, F., Langenecker, S. A., Ajilore, O., Leow, A., et al. (2025) · Journal of Psychopathology and Clinical Science · doi:10.1037/abn0001052 · Cited by 8
Freedberg, M. (2023) · Neuropsychologia · doi:10.1016/j.neuropsychologia.2023.108723 · Cited by 6
Changes in white-matter functional network efficiency across the adult lifespan
Niu, H., Zhu, J., Wang, C., Zhu, L., & Wu, J. (2019) · Neuroreport · doi:10.1097/wnr.0000000000001255 · Cited by 6
Liang, Z., Wang, Y., Tian, H., Gu, Y., Arimitsu, T., Takahashi, T., Minagawa‐Kawai, Y., Niu, H., & Tong, Y. (2022) · Biomedical Optics Express · doi:10.1364/boe.449341 · Cited by 7
Xu, J., Zhang, J., Li, J., Wang, H., Chen, J., Lyu, H., & Hu, Q. (2022) · Frontiers in Aging Neuroscience · doi:10.3389/fnagi.2022.799260 · Cited by 6
Intrinsic Hippocampal-Caudate Interaction Correlates with Human NavigationPreprint
Kong, X., Pu, Y., Wang, X., Xu, S., Hao, X., Zhen, Z., & Liu, J. (2017) · bioRxiv (Cold Spring Harbor Laboratory) · doi:10.1101/116129 · Cited by 7
Age-Related Neural Dedifferentiation and CognitionPreprint
Koen, J. D., Srokova, S., & Rugg, M. D. (2019) · doi:10.31219/osf.io/kvu29 · Cited by 6
Vividness of Visual Imagery Supported by Intrinsic Structural-Functional Brain Network DynamicsPreprint
Kvamme, T. L., Lumaca, M., Zana, B., Paunović, D., Silvanto, J., & Sandberg, K. (2024) · bioRxiv (Cold Spring Harbor Laboratory) · doi:10.1101/2024.03.02.582470 · Cited by 8
Yao, F., Zhao, Z., Wang, Y., Li, T., Chen, M., Yao, Z., Jiao, J., & Hu, B. (2024) · Psychophysiology · doi:10.1111/psyp.14702 · Cited by 5
Vandewouw, M. M., Pang, E. W., Lai, M., Kelley, E. A., Ayub, M., Lerch, J. P., Taylor, M. J., & Anagnostou, E. A. (2023) · iScience · doi:10.1016/j.isci.2023.106384 · Cited by 5
Zhi, S., Zhao, W., Wang, R., Li, Y., Wang, X., Liu, S., Li, J., & Xu, Y. (2023) · Biochemical and Biophysical Research Communications · doi:10.1016/j.bbrc.2023.06.012 · Cited by 6
Dynamic brain network evolution in normal aging based on computational experiments
Chen, X., Wang, M., He, J., & Li, W. (2016) · Neurocomputing · doi:10.1016/j.neucom.2016.09.056 · Cited by 5
MEG Studies on the Connectivity of Brain Networks in Children
Johnson, B. W., & He, W. (2019) · Springer eBooks · doi:10.1007/978-3-030-00087-5_82 · Cited by 5
Guzmán, G. E. C., Sato, J. R., Vidal, M. C., & Fujita, A. (2018) · PLoS ONE · doi:10.1371/journal.pone.0195906 · Cited by 5
Jiang, L., Qiao, K., Sui, D., Zhang, Z., & Dong, H.-M. (2019) · PLoS ONE · doi:10.1371/journal.pone.0213690 · Cited by 5
Self-citationInteractive effects of dopamine transporter genotype and aging on resting-state functional networks
Baeuchl, C., Chen, H.-Y., Su, Y.-S., Hämmerer, D., Klados, M. A., & Li, S. (2019) · PLoS ONE · doi:10.1371/journal.pone.0215849 · Cited by 5
Mancho-Fora, N., Montalà-Flaquer, M., Farràs-Permanyer, L., David Bartrés-faz, A., Vaqué‐Alcázar, L., Peró, M., & Guàrdia‐Olmos, J. (2020) · Brain Connectivity · doi:10.1089/brain.2019.0735 · Cited by 5
Tan, S., Liu, X., ZhiXiong, Y. A. N., Yang, Z., Tan, Y., Wei, G., & Zuo, X. (2015) · Chinese Science Bulletin (Chinese Version) · doi:10.1360/n972015-01146 · Cited by 4
Self-citationAge differences in functional connectivity and dedifferentiation of category representationsPreprint
Pauley, C., Zeithamová, D., & Sander, M. C. (2024) · bioRxiv (Cold Spring Harbor Laboratory) · doi:10.1101/2024.01.04.574135 · Cited by 5
Metabolic connectivity in ageing.Preprint
Deery, H. A., Liang, E. X., Siddiqui, N. M., Murray, G., Voigt, K., Paolo, R. D., Moran, C., Egan, G. F., & Jamadar, S. D. (2024) · bioRxiv (Cold Spring Harbor Laboratory) · doi:10.1101/2024.06.16.599247 · Cited by 5
Developmental differences of large-scale functional brain networks for spoken word processing
Liu, X., Yin, H., Gao, Y., Booth, J. R., Zhang, L., Zhang, S., Lu, C., & Liu, L. (2022) · Brain and Language · doi:10.1016/j.bandl.2022.105149 · Cited by 4
The effect of head motion on brain age prediction using deep convolutional neural networks
Vakli, P., Weiss, B., Rozmann, D., Eross, G., Nárai, Á., Hermann, P., & Vidnyánszky, Z. (2024) · NeuroImage · doi:10.1016/j.neuroimage.2024.120646 · Cited by 7
Shirzadi, S., Dadgostar, M., Hosseinzadeh, H., & Einalou, Z. (2025) · Cognitive Processing · doi:10.1007/s10339-025-01275-8 · Cited by 4
Structural Subnetwork Evolution Across the Life-Span: Rich-Club, Feeder, Seeder
Schirmer, M. D., & Chung, A. W. (2018) · DZNE Pub · Cited by 4
Review of Resting-State Functional Connectivity Methods and Application in Clinical Populations
Karunakaran, K. D., Woelfer, M., & Biswal, B. B. (2021) · Springer eBooks · doi:10.1007/978-3-030-59797-9_3 · Cited by 4
Chen, J., Huang, X., Tang, Q., Xiang, Z., Xu, Y., Liu, T., Yang, Z., Yang, J., & Chen, Y. (2022) · Frontiers in Endocrinology · doi:10.3389/fendo.2022.817523 · Cited by 4
de Jong, J. J. A., Jansen, J. F. A., Vergoossen, L. W. M., Schram, M. T., Stehouwer, C. D. A., Wildberger, J. E., Linden, D. E. J., & Backes, W. H. (2024) · Brain Sciences · doi:10.3390/brainsci14010062 · Cited by 9
Irastorza-Valera, L., Benítez, J. M., Montáns, F. J., & Saucedo‐Mora, L. (2024) · Biomimetics · doi:10.3390/biomimetics9020101 · Cited by 5
The impact of input node placement in the controllability of structural brain networks
Darbandi, S. S. A., Fornito, A., & Ghasemi, A. (2024) · Scientific Reports · doi:10.1038/s41598-024-57181-0 · Cited by 4
Candemir, C., Akram, V. K., & Gönül, A. S. (2024) · IEEE Transactions on Emerging Topics in Computational Intelligence · doi:10.1109/tetci.2024.3374957 · Cited by 5
Modular organization of functional brain networks in patients with degenerative cervical myelopathy
Shao, Z., Tan, Y., Zhan, Y., & He, L. (2024) · Scientific Reports · doi:10.1038/s41598-024-58764-7 · Cited by 4
Enabling discovery science in human connectomics
Sporns, O. (2014) · 中国科学通报:英文版 · doi:10.1007/s11434-014-0716-5 · Cited by 4
On computing the behavior of the mind from an eastern philosophical perspective
Karunananda, A. S., Goldin, P. R., Rzevski, G., Fernando, S., & Fernando, H. (2015) · International Journal of Design & Nature and Ecodynamics · doi:10.2495/dne-v10-n3-224-232 · Cited by 4
Modular community structure of the face network supports face recognition
Levakov, G., Sporns, O., & Avidan, G. (2021) · Cerebral Cortex · doi:10.1093/cercor/bhab458 · Cited by 4
Coelho, A., Magalhães, R. J. D. S., Moreira, P. S., Amorim, L., Portugal‐Nunes, C., Castanho, T. C., Santos, N. C., Sousa, N., & Fernandes, H. M. (2022) · Human Brain Mapping · doi:10.1002/hbm.25773 · Cited by 3
Statistical Brain Network Analysis
Simpson, S. L., Shappell, H. M., & Bahrami, M. (2023) · Annual Review of Statistics and Its Application · doi:10.1146/annurev-statistics-040522-020722 · Cited by 4
Local gradient analysis of human brain function using the Vogt-Bailey Index
Farrugia, C., Galdi, P., Irazu, I. A., Scerri, K., & Bajada, C. J. (2024) · Brain Structure and Function · doi:10.1007/s00429-023-02751-7 · Cited by 4
Wang, M., Zhang, J., Dong, G., Zhang, H., Lu, H., & Du, X. (2017) · International Journal of Developmental Neuroscience · doi:10.1016/j.ijdevneu.2017.03.001 · Cited by 4
Biological Relevance of Network Architecture
Gkigkitzis, I., Haranas, I. I., & Kotsireas, I. (2017) · Advances in experimental medicine and biology · doi:10.1007/978-3-319-56246-9_1 · Cited by 4
Longitudinal Characterisation of Healthy Ageing in Rats using Multimodal Magnetic Resonance ImagingPreprint
MacNicol, E. (2021) · Thesis Commons (OSF Preprints) · doi:10.31237/osf.io/3vpyg · Cited by 3
Tracking the Development of Functional Connectomes for Face Processing
Joseph, J. E., Vanderweyen, D., Swearingen, J. E., Vaughan, B. K., Novo, D., Zhu, X., Gebregziabher, M., Bonilha, L., Bhatt, R. S., Naselaris, T., et al. (2018) · Brain Connectivity · doi:10.1089/brain.2018.0607 · Cited by 3
Grant Report on the Effects of Childhood Maltreatment on Neurocircuitry in Adolescent Depression
Gillespie, M. L., & Rao, U. (2020) · Journal of Psychiatry and Brain Science · doi:10.20900/jpbs.20200016 · Cited by 3
Cognitive control training enhances the integration of intrinsic functional networks in adolescents
Lee, R., Kwak, S., Lee, D., & Chey, J. (2022) · Frontiers in Human Neuroscience · doi:10.3389/fnhum.2022.859358 · Cited by 8
Wang, Z., Yang, J., Zheng, Z., Cao, W., Dong, L., Li, H., Wen, X., Luo, C., Cai, Q., Jian, W., et al. (2023) · Journal of Magnetic Resonance Imaging · doi:10.1002/jmri.28599 · Cited by 3
Molecular Determinants of Neurocognitive Deficits in Glioma: Based on 2021 WHO Classification
Zhang, K., Yang, T., Xia, Y., Guo, X., Chen, W., Wang, L., Li, J., Wu, J., Xiao, Z., Zhang, X., et al. (2024) · Journal of Molecular Neuroscience · doi:10.1007/s12031-023-02173-4 · Cited by 4
Variation in high-amplitude events across the human lifespan
Jo, Y., Tanner, J., Seguin, C., Faskowitz, J., & Betzel, R. F. (2025) · Network Neuroscience · doi:10.1162/netn.a.515 · Cited by 3
Sugiarto, I., Axenie, C., & Conradt, J. (2016) · International Journal of Industrial Research and Applied Engineering · doi:10.9744/jirae.1.1.1-10 · Cited by 3
Argiris, G., Stern, Y., & Habeck, C. G. (2021) · Neuropsychologia · doi:10.1016/j.neuropsychologia.2021.107856 · Cited by 3
The Effect of MR Image Quality on Structural and Functional Brain Connectivity: The Maastricht StudyPreprint
de Jong, J. J. A., Jansen, J. F. A., Vergoossen, L. W. M., Schram, M. T., Stehouwer, C. D. A., Wildberger, J. E., Linden, D. E. J., & Backes, W. H. (2019) · bioRxiv (Cold Spring Harbor Laboratory) · doi:10.1101/806075 · Cited by 3
A Regression Framework for Brain Network Distance MetricsPreprint
Tomlinson, C. E., Laurienti, P. J., Lyday, R. G., & Simpson, S. L. (2021) · bioRxiv (Cold Spring Harbor Laboratory) · doi:10.1101/2021.02.26.432910 · Cited by 3
Suárez‐Suárez, S., Cadaveira, F., Barrós‐Loscertales, A., García, J. M. P., Holguı́n, S. R., Blanco‐Ramos, J., & Doallo, S. (2025) · Addictive Behaviors Reports · doi:10.1016/j.abrep.2025.100585 · Cited by 3
Zhang, S., Chen, X., Guo, S., Zhang, Z., Xu, P., Meng, Q., Hao, J., Chu, Q., & Li, X. (2025) · Brain and Cognition · doi:10.1016/j.bandc.2025.106337 · Cited by 2
Development of areal-level individualized homologous functional parcellations in youth
Li, J., Zhang, Y., Xin, W., Xue, M., Wang, Z., Lv, S., Yang, R., Zhu, W., Li, X., Yan, T., et al. (2025) · Communications Biology · doi:10.1038/s42003-025-08509-7 · Cited by 2
NEDA-Net: A neighborhood-enhanced deformable attention network for fMRI brain disease classification
Liang, Y., Yang, X., & Liu, B. (2026) · Expert Systems with Applications · doi:10.1016/j.eswa.2026.131595 · Cited by 2
Unified framework for brain connectivity-based biomarkers in neurodegenerative disorders
Kim, S.-W., Song, Y., Kim, H. J., Noh, Y., Seo, S. W., Na, D. L., & Seong, J. (2022) · Frontiers in Neuroscience · doi:10.3389/fnins.2022.975299 · Cited by 2
Early childhood malnutrition impairs adult resting brain function using near-infrared spectroscopy
Roger, K., Vannasing, P., Tremblay, J., Bringas-Vega, M. L., Bryce, C. P., Rabinowitz, A. G., Valdes-Sosa, P. A., Galler, J. R., & Gallagher, A. (2024) · Frontiers in Human Neuroscience · doi:10.3389/fnhum.2023.1287488 · Cited by 2
Huang, Z., & Yin, D. (2025) · Developmental Cognitive Neuroscience · doi:10.1016/j.dcn.2025.101528 · Cited by 2
Korom, M., Dozier, M., Chen, H.-W. B., Macera, E., Tottenham, N., & Spielberg, J. M. (2025) · Biological Psychiatry Global Open Science · doi:10.1016/j.bpsgos.2025.100646 · Cited by 3
Decoding the Neural Basis of Sensory Phenotypes in Autism
Kolisnyk, M., Lyons, K., Choi, E. J., Vandewouw, M. M., Stojanoski, B. B., Anagnostou, E. A., Kushki, A., Nicolson, R., Kelley, E. A., Georgiades, S., et al. (2026) · Biological Psychiatry Cognitive Neuroscience and Neuroimaging · doi:10.1016/j.bpsc.2025.12.013 · Cited by 2
Age Related Topological Analysis of Synchronization-Based Functional Connectivity
Lombardi, A., Amoroso, N., Diacono, D., Lella, E., Bellotti, R., & Tangaro, S. (2018) · Studies in computational intelligence · doi:10.1007/978-3-030-05414-4_52 · Cited by 2
Hidden state dynamics reveal the prolonged inactive state across the adult lifespanPreprint
Chen, K., Wang, R., & Liu, D. (2020) · bioRxiv (Cold Spring Harbor Laboratory) · doi:10.1101/2020.01.27.920652 · Cited by 2
Emergence of Canonical Functional Networks from the Structural ConnectomePreprint
Xie, X., Damasceno, P. F., Cai, C., Nagarajan, S. S., & Raj, A. (2020) · bioRxiv (Cold Spring Harbor Laboratory) · doi:10.1101/2020.09.16.300384 · Cited by 2
Gyral peak variations between HCP and CHCP: functional and structural implications
Cao, G., Zhang, S.-Y., He, Z.-B., Wang, Z., Guo, L., Yan, Z.-Q., Han, J.-F., Jiang, X., & Zhang, T. (2025) · Brain Structure and Function · doi:10.1007/s00429-025-02894-9 · Cited by 2
Wang, Y., Li, S., He, J., Peng, L., Wang, Q., Zou, X., Tudorascu, D., Schaeffer, D. J., Schaeffer, L. K. H., Szczupak, D., et al. (2025) · Imaging Neuroscience · doi:10.1162/imag_a_00503 · Cited by 1
The effective connectome over a century of human life
Li, G., Huynh, K. M., Thung, K., Taylor, H. P., Lin, G., Lin, W., Ahmad, S., & Yap, P. (2025) · Communications Biology · doi:10.1038/s42003-025-08970-4 · Cited by 2
Developmental Connectomics from a “Big Data” Perspective
Xu, Y., Zhao, T., Xia, M., & Liao, X. (2025) · Journal of Pacific Rim Psychology · doi:10.1177/18344909251392757 · Cited by 1
Self-citationAge-related degradation of cerebellar functional network topology
Ye, M., Xia, H., Song, T., Liu, Z., & Chen, A. C. A. (2025) · GeroScience · doi:10.1007/s11357-025-02059-w · Cited by 1
Shi, K., Zhang, Y., Hui, Z., Liu, S., Su, Y., Zhang, J., Yonghui, Y. A. N. G., Chen, G., Zhang, G. Y., Wang, M., et al. (2026) · iScience · doi:10.1016/j.isci.2026.115301 · Cited by 1
Klugah‐Brown, B., Li, Y., Wu, H., Yang, Z., Hagan, A., Agoalikum, E., Wang, P., & Biswal, B. B. (2026) · Molecular Psychiatry · doi:10.1038/s41380-026-03549-9 · Cited by 4
Multi-network Topology Underlying Individual Language Learning Success
Song, P., Yang, S., Geng, X., Gan, Z., Wang, S., & Feng, G. (2026) · Journal of Neuroscience · doi:10.1523/jneurosci.2205-25.2026 · Cited by 1
Pediatric Functional Magnetic Resonance Imaging: Clinical Applications
Welker, K. M., & Ho, M. (2017) · Journal of Pediatric Neurology · doi:10.1055/s-0037-1604216 · Cited by 1
Li, X., JinYang, S. U. N., Yu, Y., Ling, T. A. O., & YuXuan, Y. A. N. G. (2017) · Scientia Sinica Vitae · doi:10.1360/n052016-00310 · Cited by 1
Network method for voxel-pair-level brain connectivity analysis under spatial-contiguity constraints
Lu, T., Zhang, Y., Kochunov, P. V., Hong, E. L., & Chen, S. (2024) · The Annals of Applied Statistics · doi:10.1214/23-aoas1824 · Cited by 1
Urushihata, T., & Satoh, A. (2024) · The Journal of Physiological Sciences · doi:10.1186/s12576-024-00934-3 · Cited by 2
The lifelong nonlinear development of spatial variability of brain signals
Yang, C., Li, G., Jing, X., Wang, Y., Yan, J. H., & Northoff, G. (2025) · Communications Biology · doi:10.1038/s42003-025-07939-7 · Cited by 1
Hamel, A., Champetier, P., Rehel, S., André, C., Landeau, B., Mézenge, F., Haudry, S., Roquet, D., Vivien, D., Sayette, V. D. L., et al. (2025) · SLEEP · doi:10.1093/sleep/zsaf105 · Cited by 1
Mixed Modeling Frameworks for Analyzing Whole-Brain Network Data
Simpson, S. L. (2021) · Methods in molecular biology · doi:10.1007/978-1-0716-1803-5_30 · Cited by 1
Ouyang, M., Fields, C. R., Zhu, T., & Huang, H. (2023) · Elsevier eBooks · doi:10.1016/b978-0-323-85280-7.00018-x · Cited by 1
Fukushima, M., Betzel, R. F., He, Y., de Reus, M. A., van den Heuvel, M. P., Zuo, X., & Sporns, O. (2015) · arXiv (Cornell University) · Cited by 1
Self-citationAge-related changes in spatial and temporal features of resting state fMRIPreprint
Vij, S. G., Nomi, J. S., Dajani, D. R., & Uddin, L. Q. (2017) · bioRxiv (Cold Spring Harbor Laboratory) · doi:10.1101/109181 · Cited by 1
Brain functional connectivity in regions that exhibit age-related cortical thinning
Vieira, B. H. (2018) · Digital Library of Theses and Dissertations (Universidade de São Paulo) · doi:10.11606/d.59.2018.tde-17042018-130342 · Cited by 1
A Manifold Regularized Multi-Task Learning Model for IQ Prediction from Multiple fMRI ParadigmsPreprint
Li, X., Stephen, J., Wilson, T., Calhoun, V., & Wang, Y.-P. (2019) · arXiv (Cornell University) · doi:10.48550/arxiv.1901.05913 · Cited by 1
Transcriptional Signatures of the Hierarchical Chronnectome Organization in the Human BrainPreprint
Liu, J., Xia, M., Wang, X., Liao, X., & Yong He, A. (2019) · bioRxiv (Cold Spring Harbor Laboratory) · doi:10.1101/637942 · Cited by 1
Self-citationIrastorza-Valera, L., Benítez, J. M., Montáns, F. J., & Saucedo‐Mora, L. (2023) · bioRxiv (Cold Spring Harbor Laboratory) · doi:10.1101/2023.11.10.566538 · Cited by 1
Escrichs, A., Avila‐Varela, D. S., Patow, G., Pletzer, B. A., & Ritter, P. (2024) · bioRxiv (Cold Spring Harbor Laboratory) · doi:10.1101/2024.09.23.614341 · Cited by 1
Convergent and Divergent Brain–Cognition DevelopmentPreprint
Xie, Y., Zhang, S., Orbán, C., Ooi, L. Q. R., Kong, R., Floris, D. L., Zuo, X., Dhamala, E., Holmes, A. J., Uddin, L. Q., et al. (2025) · bioRxiv (Cold Spring Harbor Laboratory) · doi:10.1101/2025.06.06.658294 · Cited by 1
Self-citationOmmen, J., & Lai, C. (2015) · Lecture notes in computer science · doi:10.1007/978-3-319-23344-4_9
Changes in the Network Eigen Entropy of resting-state functional brains across the lifespan
Fan, Y., Shen, H., Zeng, L., Qin, J., Luo, Z., & Hu, D. (2015) · International Workshop on Materials Engineering and Computer Sciences (IWMECS) · doi:10.2991/iwmecs-15.2015.168
The Politics of Arrested Development: Deepening the Purposes of Education
Shaker, P. S. (2012) · Western CEDAR (Western Washington University)
Predicting human age using regional morphometry and inter-regional morphological similarity
Wang, X., & Li, L. (2016) · Proceedings of SPIE, the International Society for Optical Engineering/Proceedings of SPIE · doi:10.1117/12.2216041
Abbreviated title: Causal Network Dynamics in Aging
Davis, S. W., Luber, B. M., Lisanby, S. H., & Roberto (2016)
Marek, S. A. (2017) · D-Scholarship@Pitt (University of Pittsburgh)
Volume entropy and information flow in a brain graphPreprint
Lee, H., Kim, E., Kang, H., Huh, Y., Lee, Y., Lim, S., & Lee, D. S. (2018) · arXiv (Cornell University) · doi:10.48550/arxiv.1801.09257
MRI-based Measurement of Structural and Functional Connectivity in Health and Disease
Sinke, M. R. T. (2020) · Utrecht University Repository (Utrecht University) · doi:10.33540/77
Delirium as a disorder of brain network disintegration
van Montfort, S. J. T. (2020) · Utrecht University Repository (Utrecht University) · doi:10.33540/253
Magnetic resonance imaging (MRI)
Thomason, M. E. (2017) · Cambridge University Press eBooks · doi:10.1017/9781316216491.021
Metadata
- Authors
- Cao, M., Wang, J.-H., Dai, Z.-J., Cao, X.-Y., Jiang, L.-L., Fan, F.-M., Song, X.-W., Xia, M.-R., Shu, N., Dong, Q., Milham, M. P., Castellanos, F. X., Zuo, X.-N., & He, Y.
- Affiliations
- Beijing Normal University (CN)
- Nathan Kline Institute for Psychiatric Research (US)
- Chinese Academy of Sciences (CN)
- Corresponding author
- Zuo, Xi-Nian
- Venue
- Developmental Cognitive Neuroscience
- Publisher
- Elsevier BV
- Published
- 2014-01
- Volume
- 7
- Pages
- 76-93
- ISSN
- 1878-9293 (ISSN-L)
- PMC
- PMC6987957
- OpenAlex
- W2093597642
- Cited by
- 440
- References
- 102
- Citations by year
- 2026: 18 · 2025: 30 · 2024: 39 · 2023: 28 · 2022: 33 · 2021: 41 · 2020: 38 · 2019: 51 · 2018: 41 · 2017: 41 · 2016: 32 · 2015: 30 · 2014: 17
- FWCI
- 14.39
- Type
- journal article
- Language
- en
- Open access
- hybrid
- doi.org
- Licence
- Locations
- Developmental Cognitive Neuroscience (publishedVersion, cc-by-nc-nd)
- PubMed Central (publishedVersion, cc-by-nc-nd)
- PubMed (publishedVersion)
- Institutional Repository of Institute of Psychology, Chinese Academy of Sciences (Institute of Psychology, Chinese Academy of Sciences) (submittedVersion)
- DOAJ (DOAJ: Directory of Open Access Journals) (submittedVersion, cc-by-sa)
- Funders
- Natural Science Foundation (81030028, 31221003, 81171409)
- National Science Fund for Distinguished Young Scholars (81225012)
- Major Joint Fund for International Cooperation and Exchange of the National Natural Science Foundation (81220108014)
- Open Research Fund of the Key Laboratory of Behavioral Science, the Startup Foundation for Distinguished Research Professor (Y0CX492S03)
- Institute of Psychology, the Hundred Talents Program and the Key Research Program (KSZD-EW-TZ-002)
- Topics
- Life Sciences › Neuroscience › Cognitive Neuroscience › Functional Brain Connectivity Studies
- Health Sciences › Medicine › Radiology, Nuclear Medicine and Imaging › Advanced Neuroimaging Techniques and Applications
- Physical Sciences › Physics and Astronomy › Statistical and Nonlinear Physics › Complex Network Analysis Techniques
- Keywords
- lifespan development, network topology, modularity, rich club, local efficiency, brain network hubs, default mode network, dorsal attention network, resting-state fMRI, graph theory
- MeSH terms
- Adolescent, Adult, Age Factors, Aged, Aged, 80 and over, Aging, Brain, Brain Mapping, Child, Cognition, Female, Humans, Magnetic Resonance Imaging, Male, Middle Aged, Nerve Net, Sex Factors, Connectome
About these checks
Registry, retraction, Cites and statistics results are computed, not judged, with one exception: a printed reference that no index lists is read once by a model before it counts as a citation error. Claims are extracted by a model and kept only when their quote appears verbatim in the text; each cited source is then checked, with a model’s help, for whether it says what the claim relies on. Those verdicts can be wrong — read the claim’s quote and the cited source before relying on one.
Statistics and arithmetic are recomputed, not judged.
Confidence bands are shown only for fields calibrated on our annotated test set. None is calibrated yet, so no band is shown.
What counts as a claim ›How we measure confidence ›How we check this ›
Are you an author, or do you see a problem with this page? Request a review
