Cited by 57

The DOI matches its Crossref record; 14 of the 14 references it cites were found in a registry or an index.

Reprogramming astrocytic NDRG2/NF-κB/C3 signaling restores the diabetes-associated cognitive dysfunction

Jiang, Tao, Li, Yansong, He, Shuxuan, Huang, Ning, Du, Mengyu, Zhai, Qian, Pu, Kairui, Wu, Meiyan, Yan, Chaoying, Ma, Zhi, Wang, Qiang·2023·eBioMedicine

Overview

The claims and statistics of this paper haven’t been checked yet.

Run the check — free, no account needed. It reads the open-access text and checks the sources it cites.

A few free checks a day · papers already verified open instantly · results are public

Integrity signals

Registry

Crossref · 10.1016/j.ebiom.2023.104653

Cites

14 of 14 references verified0 citation errors · 0 not checkable

Statistics

Figures

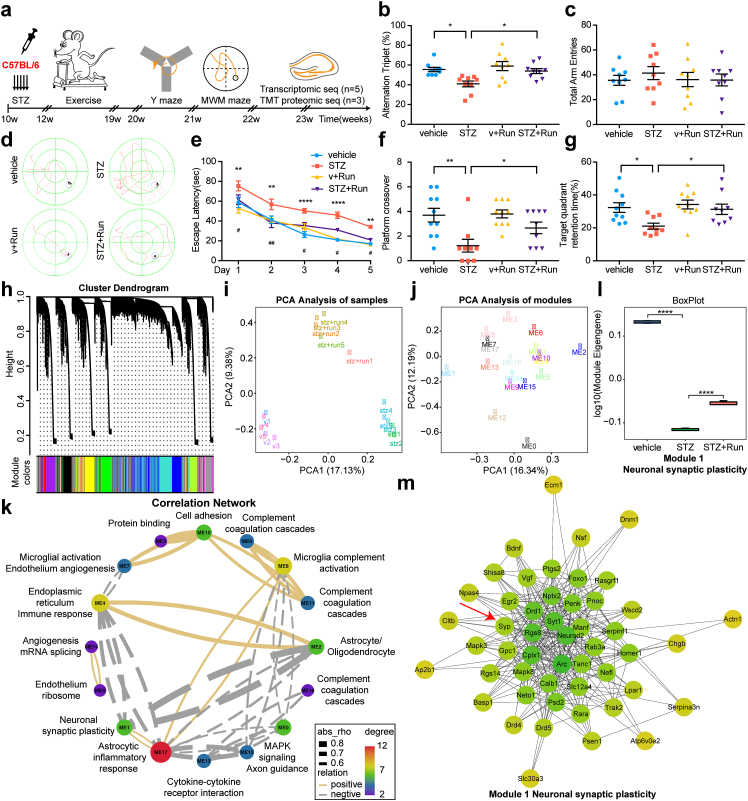
Fig. 1 Transcriptomic analysis revealed the protective effect of exercise and the integrative pathogenesis of DACD. (a) Schematic that represents the chronological order of STZ injection, exercise, cognitive testing, and omics analysis. (b) The alternation triplet (%) of Y-maze was decreased in STZ group compared with vehicle mice (∗p = 0.0145 between vehicle and STZ), which was reversed by exercise (n = 9/group) (∗p = 0.0339 between STZ and STZ + Run). (c) Y-maze total arm entries (n = 9/group). (d) Representative traces of diabetic or non-diabetic mice after exercise in MWM test. (e) Escape latency of the MWM test was delayed in STZ mice compared with vehicle (∗∗p = 0.004 (day 1), ∗∗p = 0.0077 (day 2), ∗∗∗∗p < 0.0001 (day 3), ∗∗∗∗p < 0.0001 (day 4), ∗∗p = 0.0028 (day 5) between vehicle and STZ), which was rescued after exercise (n = 10 vehicle and v + Run, n = 9 STZ and STZ + Run) (#p = 0.0282 (day 1), ##p = 0.001 (day 2), #p = 0.0154 (day 3), #p = 0.0151 (day 4), #p = 0.0391 (day 5) between STZ and STZ + Run). (f–g) The platform crossover (f) and target quadrant retention time (%) (g) during the probe trial of the MWM test were decreased in STZ mice compared with the vehicle group (∗∗p = 0.0016 (f), ∗p = 0.0158 (g) between vehicle and STZ), which were upregulated after exercise (n = 10 vehicle and v + Run, n = 9 STZ and STZ + Run) (∗p = 0.0444 (f), ∗p = 0.0359 (g) between STZ and STZ + Run). (h) Cluster dendrogram of WGCNA in transcriptome showing the 18 modules, distinguished by different colors (n = 5/group). (i) PCA analysis of transcriptomic samples. (j) Multidimensional distribution of 18 modules by PCA analysis. (k) Correlation network demonstrating the major cell types and Gene Ontology enrichments for each module and the relationships from a multidimensional perspective. Yellow represents a positive correlation, and grey represents a negative correlation. (l) The module eigengene of module 1 was downregulated at diabetic mice (∗∗∗∗p < 0.0001 between vehicle and STZ), which was reversed by exercise (n = 5/group) (∗∗∗∗p < 0.0001 between STZ and STZ + Run). (m) Module 1 enriched neuronal synaptic plasticity genes: Syt 1, Manf, Syp, and Bdnf. Values are presented as mean ± SEM. One-way ANOVA with Tukey's multiple comparisons test was performed in b, f, g, l. Two-way ANOVA with Tukey's multiple comparisons test was performed in e.
Fig. 1 Transcriptomic analysis revealed the protective effect of exercise and the integrative pathogenesis of DACD. (a) Schematic that represents the chronological order of STZ injection, exercise, cognitive testing, and omics analysis. (b) The alternation triplet (%) of Y-maze was decreased in STZ group compared with vehicle mice (∗p = 0.0145 between vehicle and STZ), which was reversed by exercise (n = 9/group) (∗p = 0.0339 between STZ and STZ + Run). (c) Y-maze total arm entries (n = 9/group). (d) Representative traces of diabetic or non-diabetic mice after exercise in MWM test. (e) Escape latency of the MWM test was delayed in STZ mice compared with vehicle (∗∗p = 0.004 (day 1), ∗∗p = 0.0077 (day 2), ∗∗∗∗p < 0.0001 (day 3), ∗∗∗∗p < 0.0001 (day 4), ∗∗p = 0.0028 (day 5) between vehicle and STZ), which was rescued after exercise (n = 10 vehicle and v + Run, n = 9 STZ and STZ + Run) (#p = 0.0282 (day 1), ##p = 0.001 (day 2), #p = 0.0154 (day 3), #p = 0.0151 (day 4), #p = 0.0391 (day 5) between STZ and STZ + Run). (f–g) The platform crossover (f) and target quadrant retention time (%) (g) during the probe trial of the MWM test were decreased in STZ mice compared with the vehicle group (∗∗p = 0.0016 (f), ∗p = 0.0158 (g) between vehicle and STZ), which were upregulated after exercise (n = 10 vehicle and v + Run, n = 9 STZ and STZ + Run) (∗p = 0.0444 (f), ∗p = 0.0359 (g) between STZ and STZ + Run). (h) Cluster dendrogram of WGCNA in transcriptome showing the 18 modules, distinguished by different colors (n = 5/group). (i) PCA analysis of transcriptomic samples. (j) Multidimensional distribution of 18 modules by PCA analysis. (k) Correlation network demonstrating the major cell types and Gene Ontology enrichments for each module and the relationships from a multidimensional perspective. Yellow represents a positive correlation, and grey represents a negative correlation. (l) The module eigengene of module 1 was downregulated at diabetic mice (∗∗∗∗p < 0.0001 between vehicle and STZ), which was reversed by exercise (n = 5/group) (∗∗∗∗p < 0.0001 between STZ and STZ + Run). (m) Module 1 enriched neuronal synaptic plasticity genes: Syt 1, Manf, Syp, and Bdnf. Values are presented as mean ± SEM. One-way ANOVA with Tukey's multiple comparisons test was performed in b, f, g, l. Two-way ANOVA with Tukey's multiple comparisons test was performed in e.CC BY-NC-ND · PubMed Central
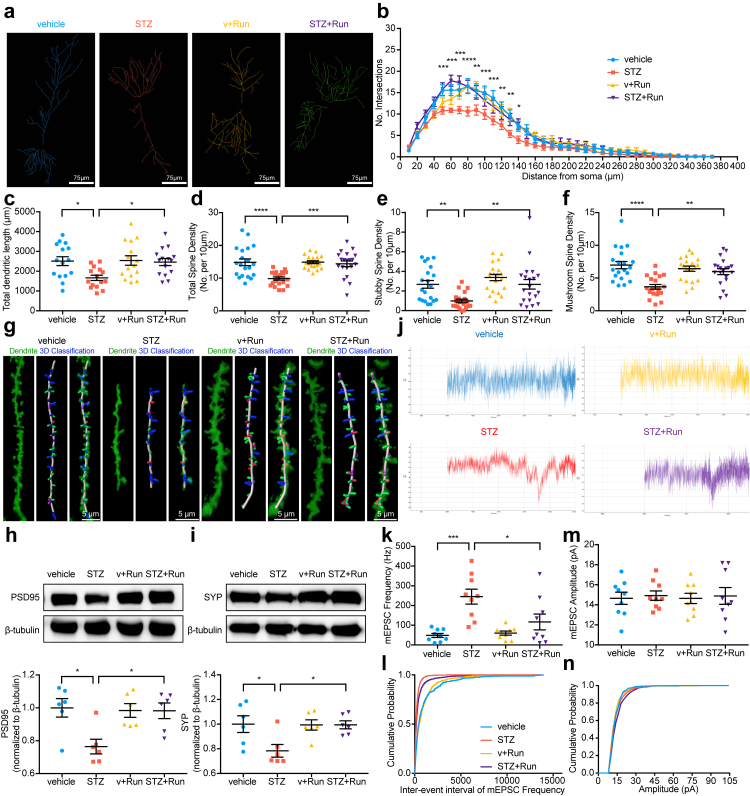
Fig. 2 Exercise promotes neuronal morphology and function in diabetic mice. (a) Representative images of neuronal dendritic morphology. Scale bar, 75 μm. (b–c) Quantification of dendritic complexity (b) and total dendritic length (c) by Sholl analysis exhibited a decline in the STZ group compared with vehicle mice (∗p = 0.0192 between vehicle and STZ), which was increased after exercise (n = 15/group) (∗p = 0.0297 between STZ and STZ + Run). (d–f) The densities of total spines (d), stubby spines (e), and mushroom spines (f) were downregulated in the STZ group compared with vehicle mice (∗∗∗∗p < 0.0001 (d), ∗∗p = 0.0078 (e), ∗∗∗∗p < 0.0001 (f) between vehicle and STZ), which all rescued after exercise (n = 20/group) (∗∗∗p = 0.0003 (d), ∗∗p = 0.0078 (e), ∗∗p = 0.0026 (f) between STZ and STZ + Run). (g) Representative images of dendritic spine 3D reconstruction to classify stubby, mushroom, long thin, and filopodia spines. Scale bar, 5 μm. (h–i) Representative immunoblots of synaptic proteins: PSD95 (h) and SYP (i) (n = 6/group) (∗p = 0.0118 (h), ∗p = 0.0291 (i) between vehicle and STZ) (∗p = 0.0209 (h), ∗p = 0.0345 (i) between STZ and STZ + Run). (j) Representative images of mEPSC traces in CA1 pyramidal neurons. (k, m) Average neuron mEPSC frequency (k) and amplitude (m) (n = 9/group) (∗∗∗p = 0.0002 between vehicle and STZ, ∗p = 0.0159 between STZ and STZ + Run). (l, n) Cumulative distributions of mEPSC frequency (l) and amplitude (n) (n = 9/group). Data are presented as mean ± SEM. One-way ANOVA with Tukey's multiple comparisons test was performed in c–f, h–i, k.
Fig. 2 Exercise promotes neuronal morphology and function in diabetic mice. (a) Representative images of neuronal dendritic morphology. Scale bar, 75 μm. (b–c) Quantification of dendritic complexity (b) and total dendritic length (c) by Sholl analysis exhibited a decline in the STZ group compared with vehicle mice (∗p = 0.0192 between vehicle and STZ), which was increased after exercise (n = 15/group) (∗p = 0.0297 between STZ and STZ + Run). (d–f) The densities of total spines (d), stubby spines (e), and mushroom spines (f) were downregulated in the STZ group compared with vehicle mice (∗∗∗∗p < 0.0001 (d), ∗∗p = 0.0078 (e), ∗∗∗∗p < 0.0001 (f) between vehicle and STZ), which all rescued after exercise (n = 20/group) (∗∗∗p = 0.0003 (d), ∗∗p = 0.0078 (e), ∗∗p = 0.0026 (f) between STZ and STZ + Run). (g) Representative images of dendritic spine 3D reconstruction to classify stubby, mushroom, long thin, and filopodia spines. Scale bar, 5 μm. (h–i) Representative immunoblots of synaptic proteins: PSD95 (h) and SYP (i) (n = 6/group) (∗p = 0.0118 (h), ∗p = 0.0291 (i) between vehicle and STZ) (∗p = 0.0209 (h), ∗p = 0.0345 (i) between STZ and STZ + Run). (j) Representative images of mEPSC traces in CA1 pyramidal neurons. (k, m) Average neuron mEPSC frequency (k) and amplitude (m) (n = 9/group) (∗∗∗p = 0.0002 between vehicle and STZ, ∗p = 0.0159 between STZ and STZ + Run). (l, n) Cumulative distributions of mEPSC frequency (l) and amplitude (n) (n = 9/group). Data are presented as mean ± SEM. One-way ANOVA with Tukey's multiple comparisons test was performed in c–f, h–i, k.CC BY-NC-ND · PubMed Central
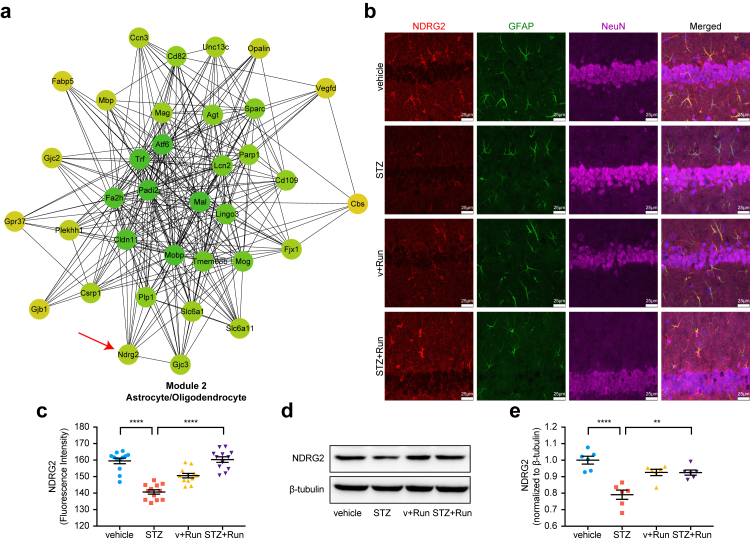
Fig. 3 Exercise reverses the downregulation of astrocytic NDRG2 in the diabetic hippocampus. (a) Astrocytic and oligodendrocytic genes (Ndrg2, Lcn2, and Mobp) were enriched in module 2. (b–c) Representative immunofluorescent staining of NDRG2 in the hippocampus (b); the fluorescent intensity (c) was decreased at STZ group compared with vehicle mice (∗∗∗∗p < 0.0001 between vehicle and STZ), which was upregulated by exercise (∗∗∗∗p < 0.0001 between STZ and STZ + Run). Red: NDRG2, green: GFAP, purple: NeuN. Scale bar, 25 μm. (d–e) Representative immunoblots of astrocytic NDRG2 in the hippocampus exhibited downregulated at STZ mice compared with vehicle (∗∗∗∗p < 0.0001 between vehicle and STZ), which was increased after exercise (n = 6/group) (∗∗p = 0.0018 between STZ and STZ + Run). Data are presented as mean ± SEM. One-way ANOVA with Tukey's multiple comparisons test was performed in c, e.
Fig. 3 Exercise reverses the downregulation of astrocytic NDRG2 in the diabetic hippocampus. (a) Astrocytic and oligodendrocytic genes (Ndrg2, Lcn2, and Mobp) were enriched in module 2. (b–c) Representative immunofluorescent staining of NDRG2 in the hippocampus (b); the fluorescent intensity (c) was decreased at STZ group compared with vehicle mice (∗∗∗∗p < 0.0001 between vehicle and STZ), which was upregulated by exercise (∗∗∗∗p < 0.0001 between STZ and STZ + Run). Red: NDRG2, green: GFAP, purple: NeuN. Scale bar, 25 μm. (d–e) Representative immunoblots of astrocytic NDRG2 in the hippocampus exhibited downregulated at STZ mice compared with vehicle (∗∗∗∗p < 0.0001 between vehicle and STZ), which was increased after exercise (n = 6/group) (∗∗p = 0.0018 between STZ and STZ + Run). Data are presented as mean ± SEM. One-way ANOVA with Tukey's multiple comparisons test was performed in c, e.CC BY-NC-ND · PubMed Central
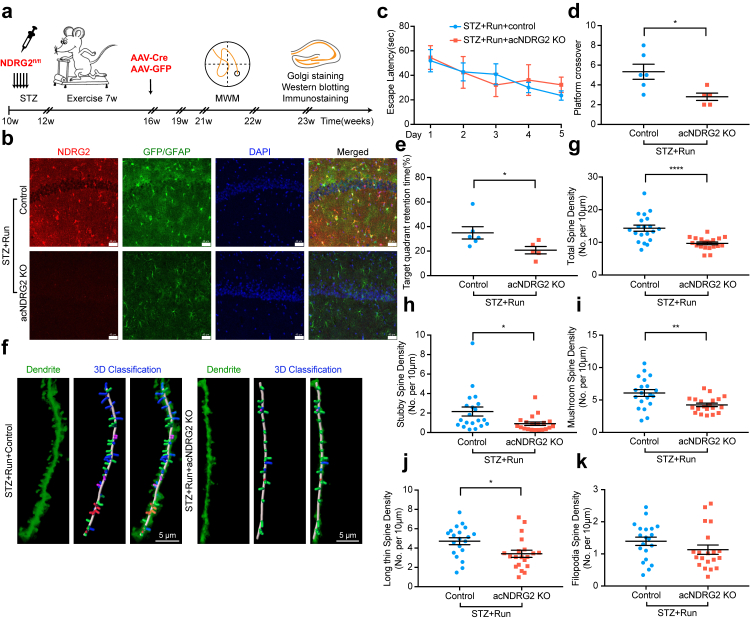
Fig. 4 NDRG2 deficiency reverses the beneficial effect of exercise on the dendritic spine and cognitive function in diabetic mice. (a) Schematic representing chronological order of STZ injection, exercise, AAV-Cre to induce NDRG2 deficiency, and behavioral testing. (b) Representative microscopic fields of NDRG2 deficiency in the hippocampus. Red: NDRG2, green: GFP/GFAP, blue: DAPI. Scale bar, 40 μm. (c) The escape latency of MWM tests. (d–e) The platform crossover (d) and target quadrant retention time (%) (e) of MWM tests were decreased in the STZ + Run + acNDRG2 KO group (n = 5) compared with STZ + Run + control mice (n = 6) (∗p = 0.0208 (d), ∗p = 0.0477 (e) between STZ + Run + acNDRG2 KO and STZ + Run + control). (f) Representative images of dendritic spine 3D reconstruction in the STZ + Run + acNDRG2 KO and STZ + Run + control mice. Scale bar, 5 μm. (g–j) The densities of total spines (g), stubby spines (h), mushroom spines (i), and long thin spines (j) were downregulated in the STZ + Run + acNDRG2 KO group compared with STZ + Run + control mice (n = 20/group) (∗∗∗∗p < 0.0001 (g), ∗p = 0.0164 (h), ∗∗p = 0.0035 (i), ∗p = 0.0153 (j) between STZ + Run + acNDRG2 KO and STZ + Run + control). (k) The densities of filopodia spines (n = 20/group). Data are presented as mean ± SEM. Two-tailed Student's t-test was performed in d–j.
Fig. 4 NDRG2 deficiency reverses the beneficial effect of exercise on the dendritic spine and cognitive function in diabetic mice. (a) Schematic representing chronological order of STZ injection, exercise, AAV-Cre to induce NDRG2 deficiency, and behavioral testing. (b) Representative microscopic fields of NDRG2 deficiency in the hippocampus. Red: NDRG2, green: GFP/GFAP, blue: DAPI. Scale bar, 40 μm. (c) The escape latency of MWM tests. (d–e) The platform crossover (d) and target quadrant retention time (%) (e) of MWM tests were decreased in the STZ + Run + acNDRG2 KO group (n = 5) compared with STZ + Run + control mice (n = 6) (∗p = 0.0208 (d), ∗p = 0.0477 (e) between STZ + Run + acNDRG2 KO and STZ + Run + control). (f) Representative images of dendritic spine 3D reconstruction in the STZ + Run + acNDRG2 KO and STZ + Run + control mice. Scale bar, 5 μm. (g–j) The densities of total spines (g), stubby spines (h), mushroom spines (i), and long thin spines (j) were downregulated in the STZ + Run + acNDRG2 KO group compared with STZ + Run + control mice (n = 20/group) (∗∗∗∗p < 0.0001 (g), ∗p = 0.0164 (h), ∗∗p = 0.0035 (i), ∗p = 0.0153 (j) between STZ + Run + acNDRG2 KO and STZ + Run + control). (k) The densities of filopodia spines (n = 20/group). Data are presented as mean ± SEM. Two-tailed Student's t-test was performed in d–j.CC BY-NC-ND · PubMed Central
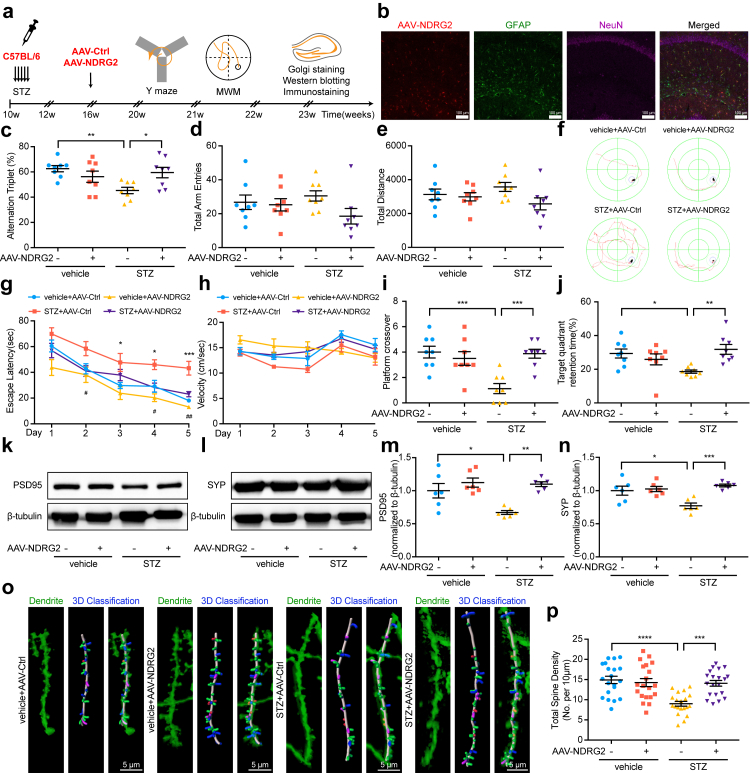
Fig. 5 NDRG2 overexpression alleviates synaptic injury and memory deficits at diabetic mice. (a) Schematic representing chronological order of STZ injection, NDRG2 overexpression, and behavioral testing. (b) Representative immunofluorescent staining of NDRG2 overexpression in the hippocampus. Red: NDRG2, green: GFAP, purple: NeuN, blue: DAPI. Scale bar, 100 μm. (c) Y-maze alternation triplet (%) were increased at the STZ + AAV-NDRG2 group compared to STZ + AAV-Ctrl group (n = 8/group) (∗∗p = 0.0082 between vehicle + AAV-Ctrl and STZ + AAV-Ctrl) (∗p = 0.0368 between STZ + AAV-NDRG2 and STZ + AAV-Ctrl). (d–e) Y-maze total arm entries (d) and total distance (e) (n = 8/group). (f) Representative traces of diabetic or non-diabetic mice after NDRG2 overexpression from the MWM test. (g) Escape latency was reduced at the STZ + AAV-NDRG2 mice compared to STZ + AAV-Ctrl group (n = 8/group) (∗p = 0.0279 (day 3), ∗p = 0.0456 (day 4), ∗∗∗p = 0.0007 (day 5) between vehicle + AAV-Ctrl and STZ + AAV-Ctrl) (#p = 0.0341 (day 2), #p = 0.0297 (day 4), ##p = 0.0100 (day 5) between STZ + AAV-NDRG2 and STZ + AAV-Ctrl). (h) Swimming velocity during the MWM test (n = 8/group). (i–j) The platform crossover (i) and target quadrant retention time (%) (j) during the probe trial of the MWM test were increased after NDRG2 overexpression (n = 8/group) (∗∗∗p = 0.0005 (i), ∗p = 0.0331(j) between vehicle + AAV-Ctrl and STZ + AAV-Ctrl) (∗∗∗p = 0.0007 (i), ∗∗p = 0.0067 (j) between STZ + AAV-NDRG2 and STZ + AAV-Ctrl). (k–n) Representative immunoblots of synaptic proteins: PSD95 (k, m) and SYP (l, n), the protein levels improved in the STZ + AAV-NDRG2 group compared to STZ + AAV-Ctrl mice (n = 6/group) (∗p = 0.0138 (m), ∗p = 0.010 (n) between vehicle + AAV-Ctrl and STZ + AAV-Ctrl) (∗∗p = 0.0014 (m), ∗∗∗p = 0.0006 (n) between STZ + AAV-NDRG2 and STZ + AAV-Ctrl). (o) Representative images of 3D reconstruction of dendritic spines. Scale bar, 5 μm. (p) The densities of total spines were upregulated at the STZ + AAV-NDRG2 group compared to STZ + AAV-Ctrl mice (n = 20/group) (∗∗∗∗p < 0.0001 between vehicle + AAV-Ctrl and STZ + AAV-Ctrl) (∗∗∗p = 0.0002 between STZ + AAV-NDRG2 and STZ + AAV-Ctrl). Data are presented as mean ± SEM. One-way ANOVA with Tukey's multiple comparisons test was performed in c, i–p. Two-way ANOVA with Tukey's multiple comparisons test was performed in g.
Fig. 5 NDRG2 overexpression alleviates synaptic injury and memory deficits at diabetic mice. (a) Schematic representing chronological order of STZ injection, NDRG2 overexpression, and behavioral testing. (b) Representative immunofluorescent staining of NDRG2 overexpression in the hippocampus. Red: NDRG2, green: GFAP, purple: NeuN, blue: DAPI. Scale bar, 100 μm. (c) Y-maze alternation triplet (%) were increased at the STZ + AAV-NDRG2 group compared to STZ + AAV-Ctrl group (n = 8/group) (∗∗p = 0.0082 between vehicle + AAV-Ctrl and STZ + AAV-Ctrl) (∗p = 0.0368 between STZ + AAV-NDRG2 and STZ + AAV-Ctrl). (d–e) Y-maze total arm entries (d) and total distance (e) (n = 8/group). (f) Representative traces of diabetic or non-diabetic mice after NDRG2 overexpression from the MWM test. (g) Escape latency was reduced at the STZ + AAV-NDRG2 mice compared to STZ + AAV-Ctrl group (n = 8/group) (∗p = 0.0279 (day 3), ∗p = 0.0456 (day 4), ∗∗∗p = 0.0007 (day 5) between vehicle + AAV-Ctrl and STZ + AAV-Ctrl) (#p = 0.0341 (day 2), #p = 0.0297 (day 4), ##p = 0.0100 (day 5) between STZ + AAV-NDRG2 and STZ + AAV-Ctrl). (h) Swimming velocity during the MWM test (n = 8/group). (i–j) The platform crossover (i) and target quadrant retention time (%) (j) during the probe trial of the MWM test were increased after NDRG2 overexpression (n = 8/group) (∗∗∗p = 0.0005 (i), ∗p = 0.0331(j) between vehicle + AAV-Ctrl and STZ + AAV-Ctrl) (∗∗∗p = 0.0007 (i), ∗∗p = 0.0067 (j) between STZ + AAV-NDRG2 and STZ + AAV-Ctrl). (k–n) Representative immunoblots of synaptic proteins: PSD95 (k, m) and SYP (l, n), the protein levels improved in the STZ + AAV-NDRG2 group compared to STZ + AAV-Ctrl mice (n = 6/group) (∗p = 0.0138 (m), ∗p = 0.010 (n) between vehicle + AAV-Ctrl and STZ + AAV-Ctrl) (∗∗p = 0.0014 (m), ∗∗∗p = 0.0006 (n) between STZ + AAV-NDRG2 and STZ + AAV-Ctrl). (o) Representative images of 3D reconstruction of dendritic spines. Scale bar, 5 μm. (p) The densities of total spines were upregulated at the STZ + AAV-NDRG2 group compared to STZ + AAV-Ctrl mice (n = 20/group) (∗∗∗∗p < 0.0001 between vehicle + AAV-Ctrl and STZ + AAV-Ctrl) (∗∗∗p = 0.0002 between STZ + AAV-NDRG2 and STZ + AAV-Ctrl). Data are presented as mean ± SEM. One-way ANOVA with Tukey's multiple comparisons test was performed in c, i–p. Two-way ANOVA with Tukey's multiple comparisons test was performed in g.CC BY-NC-ND · PubMed Central
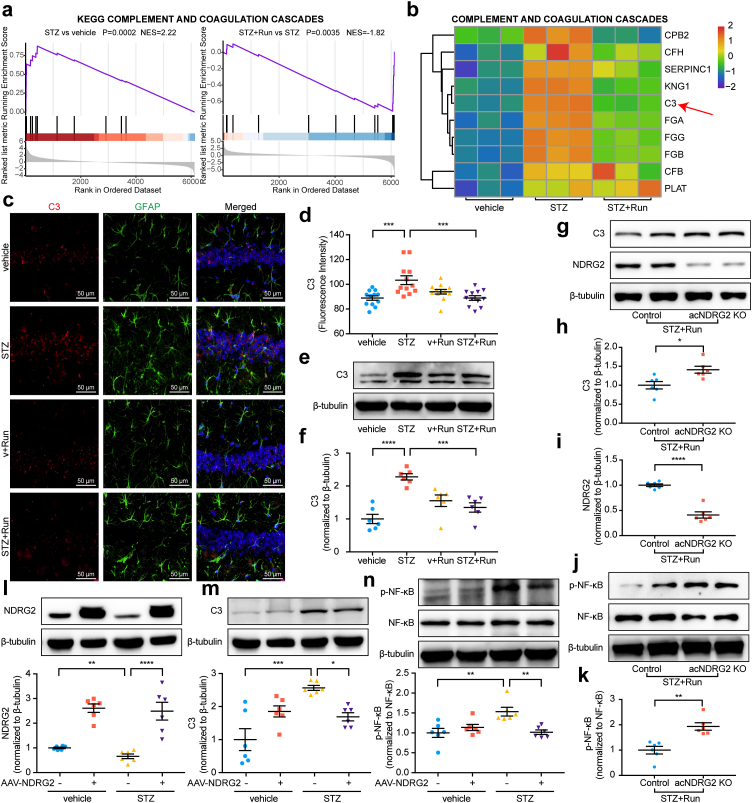
Fig. 6 NDRG2 reshapes the pathological structure of astrocytes by inhibiting NF-κB/C3 signaling. (a) GSEA of proteome indicated complement and coagulation cascade signaling were upregulated in diabetic mice (∗∗∗p = 0.0002 between vehicle and STZ) and downregulated after exercise (∗∗p = 0.0035 between STZ and STZ + Run). The cumulative enrichment scores were normalized (NES) (n = 3/group). (b) Heatmaps showing the fold changes of significantly altered proteins in complement and coagulation cascades (n = 3/group). (c–d) Representative immunofluorescent staining of intact C3 and its cleaved products in the hippocampus. Red: C3, green: GFAP, blue: DAPI. Scale bar, 50 μm. (∗∗∗p = 0.0006 between vehicle and STZ, ∗∗∗p = 0.0006 between STZ and STZ + Run) (e–f) Representative immunoblots of complement C3 in the hippocampus were increased in the STZ group compared to vehicle mice (∗∗∗∗p < 0.0001 between vehicle and STZ), which was downregulated after exercise (n = 6/group) (∗∗∗p = 0.0008 between STZ and STZ + Run). (g–k) Representative immunoblots of astrocytic NDRG2 (g, i), complement C3 (g, h), NF-κB, and p–NF–κB (j, k) after NDRG2 loss of function (n = 6/group) (∗p = 0.0120 (h), ∗∗∗∗p < 0.0001 (i), ∗∗p = 0.0012 (k) between STZ + Run + acNDRG2 KO and STZ + Run + control). (l–n) Representative immunoblots of astrocytic NDRG2 (l), complement C3 (m), NF-κB, and p–NF–κB (n) in the hippocampus after NDRG2 gain of function (n = 6/group) (∗∗p = 0.0064 (l), ∗∗∗p = 0.0001 (m), ∗∗p = 0.0029 (n) between vehicle + AAV-Ctrl and STZ + AAV-Ctrl) (∗∗∗∗p < 0.0001 (l), ∗p = 0.0264 (m), ∗∗p = 0.0040 (n) between STZ + AAV-NDRG2 and STZ + AAV-Ctrl). Data are presented as mean ± SEM. GSEA analysis was performed in a. One-way ANOVA with Tukey's multiple comparisons test was performed in d, f, l–n. Two-tailed Student's t-test was performed in h, i, k.
Fig. 6 NDRG2 reshapes the pathological structure of astrocytes by inhibiting NF-κB/C3 signaling. (a) GSEA of proteome indicated complement and coagulation cascade signaling were upregulated in diabetic mice (∗∗∗p = 0.0002 between vehicle and STZ) and downregulated after exercise (∗∗p = 0.0035 between STZ and STZ + Run). The cumulative enrichment scores were normalized (NES) (n = 3/group). (b) Heatmaps showing the fold changes of significantly altered proteins in complement and coagulation cascades (n = 3/group). (c–d) Representative immunofluorescent staining of intact C3 and its cleaved products in the hippocampus. Red: C3, green: GFAP, blue: DAPI. Scale bar, 50 μm. (∗∗∗p = 0.0006 between vehicle and STZ, ∗∗∗p = 0.0006 between STZ and STZ + Run) (e–f) Representative immunoblots of complement C3 in the hippocampus were increased in the STZ group compared to vehicle mice (∗∗∗∗p < 0.0001 between vehicle and STZ), which was downregulated after exercise (n = 6/group) (∗∗∗p = 0.0008 between STZ and STZ + Run). (g–k) Representative immunoblots of astrocytic NDRG2 (g, i), complement C3 (g, h), NF-κB, and p–NF–κB (j, k) after NDRG2 loss of function (n = 6/group) (∗p = 0.0120 (h), ∗∗∗∗p < 0.0001 (i), ∗∗p = 0.0012 (k) between STZ + Run + acNDRG2 KO and STZ + Run + control). (l–n) Representative immunoblots of astrocytic NDRG2 (l), complement C3 (m), NF-κB, and p–NF–κB (n) in the hippocampus after NDRG2 gain of function (n = 6/group) (∗∗p = 0.0064 (l), ∗∗∗p = 0.0001 (m), ∗∗p = 0.0029 (n) between vehicle + AAV-Ctrl and STZ + AAV-Ctrl) (∗∗∗∗p < 0.0001 (l), ∗p = 0.0264 (m), ∗∗p = 0.0040 (n) between STZ + AAV-NDRG2 and STZ + AAV-Ctrl). Data are presented as mean ± SEM. GSEA analysis was performed in a. One-way ANOVA with Tukey's multiple comparisons test was performed in d, f, l–n. Two-tailed Student's t-test was performed in h, i, k.CC BY-NC-ND · PubMed Central
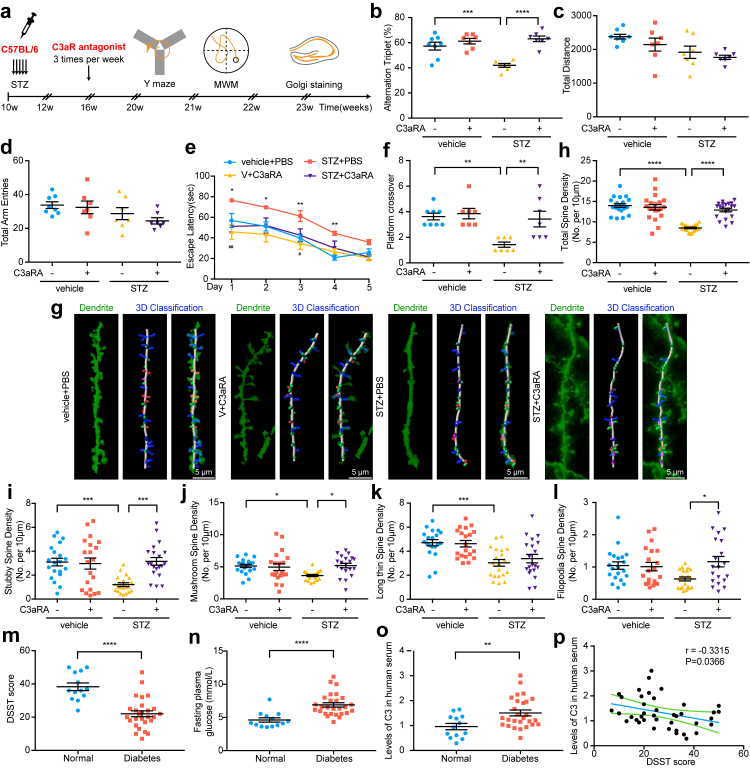
Fig. 7 C3aR blockade rescues dendritic spine loss in diabetic mice, and C3 may be a biomarker to predict the progression of DACD in humans. (a) Schematic representing chronological order of STZ injection, C3aR antagonist, and behavioral testing. We used C3aR antagonists to clarify whether C3aR blockade could mimic the protective effect of NDRG2 overexpression on DACD. (b) Y-maze alternation triplet (%) was improved in the STZ + C3aRA group compared with STZ + PBS mice (n = 7/group, n = 8 vehicle + PBS) (∗∗∗p = 0.0006 between vehicle + PBS and STZ + PBS) (∗∗∗∗p < 0.0001 between STZ + C3aRA and STZ + PBS). (c–d) Y-maze total distance (c) and total arm entries (d) (n = 7/group, n = 8 vehicle + PBS). (e) Escape latency of MWM test was shorten at the STZ + C3aRA group compared with STZ + PBS mice (n = 7/group, n = 8 vehicle + PBS) (∗p = 0.0211 (day 1), ∗p = 0.0336 (day 2), ∗∗p = 0.0099 (day 3), ∗∗p = 0.0033 (day 4) between vehicle + PBS and STZ + PBS) (##p = 0.0021 (day 1), #p = 0.0392 (day 3) between STZ + C3aRA and STZ + PBS). (f) Platform crossover of MWM test was upregulated at the STZ + C3aRA mice compared to STZ + PBS group (n = 7/group, n = 8 vehicle + PBS) (∗∗p = 0.0025 between vehicle + PBS and STZ + PBS) (∗∗p = 0.0066 between STZ + C3aRA and STZ + PBS). (g) Representative images of 3D reconstruction of dendritic spines. Scale bar, 5 μm. (h–l) The densities of total spines (h), stubby spines (i), mushroom spines (j), long thin spines (k), and filopodia spines (l) (n = 20/group) (∗∗∗∗p < 0.0001 (h), ∗∗∗p = 0.0008 (i), ∗p = 0.0191 (j), ∗∗∗p = 0.0006 (k) between vehicle + PBS and STZ + PBS) (∗∗∗∗p < 0.0001 (h), ∗∗∗p = 0.0005 (i), ∗p = 0.0133 (j), ∗p = 0.0153 (l) between STZ + C3aRA and STZ + PBS). (m) The DSST scores of diabetic patients (n = 27) and non-diabetic peers (n = 13) (∗∗∗∗p < 0.0001 between Normal and Diabetes). (n) Fasting plasma glucose levels for diabetic patients (n = 27) compared to non-diabetic patients (n = 13) (∗∗∗∗p < 0.0001 between Normal and Diabetes). (o) The serum levels of complement C3 in diabetic patients (n = 27) and normal peers (n = 13) (∗∗p = 0.0072 between Normal and Diabetes). (p) The correlations between DSST score and increased C3 levels in diabetic patients (n = 27) and normal peers (n = 13). Correlations were found using linear regression, with r = −0.3315 and p = 0.0366. Values presented as mean ± SEM. Two-way ANOVA with Tukey's multiple comparisons test was performed in e. One-way ANOVA with Tukey's multiple comparisons test was performed in b, f–l. Two-tailed Student's t-test was performed in m–o.
Fig. 7 C3aR blockade rescues dendritic spine loss in diabetic mice, and C3 may be a biomarker to predict the progression of DACD in humans. (a) Schematic representing chronological order of STZ injection, C3aR antagonist, and behavioral testing. We used C3aR antagonists to clarify whether C3aR blockade could mimic the protective effect of NDRG2 overexpression on DACD. (b) Y-maze alternation triplet (%) was improved in the STZ + C3aRA group compared with STZ + PBS mice (n = 7/group, n = 8 vehicle + PBS) (∗∗∗p = 0.0006 between vehicle + PBS and STZ + PBS) (∗∗∗∗p < 0.0001 between STZ + C3aRA and STZ + PBS). (c–d) Y-maze total distance (c) and total arm entries (d) (n = 7/group, n = 8 vehicle + PBS). (e) Escape latency of MWM test was shorten at the STZ + C3aRA group compared with STZ + PBS mice (n = 7/group, n = 8 vehicle + PBS) (∗p = 0.0211 (day 1), ∗p = 0.0336 (day 2), ∗∗p = 0.0099 (day 3), ∗∗p = 0.0033 (day 4) between vehicle + PBS and STZ + PBS) (##p = 0.0021 (day 1), #p = 0.0392 (day 3) between STZ + C3aRA and STZ + PBS). (f) Platform crossover of MWM test was upregulated at the STZ + C3aRA mice compared to STZ + PBS group (n = 7/group, n = 8 vehicle + PBS) (∗∗p = 0.0025 between vehicle + PBS and STZ + PBS) (∗∗p = 0.0066 between STZ + C3aRA and STZ + PBS). (g) Representative images of 3D reconstruction of dendritic spines. Scale bar, 5 μm. (h–l) The densities of total spines (h), stubby spines (i), mushroom spines (j), long thin spines (k), and filopodia spines (l) (n = 20/group) (∗∗∗∗p < 0.0001 (h), ∗∗∗p = 0.0008 (i), ∗p = 0.0191 (j), ∗∗∗p = 0.0006 (k) between vehicle + PBS and STZ + PBS) (∗∗∗∗p < 0.0001 (h), ∗∗∗p = 0.0005 (i), ∗p = 0.0133 (j), ∗p = 0.0153 (l) between STZ + C3aRA and STZ + PBS). (m) The DSST scores of diabetic patients (n = 27) and non-diabetic peers (n = 13) (∗∗∗∗p < 0.0001 between Normal and Diabetes). (n) Fasting plasma glucose levels for diabetic patients (n = 27) compared to non-diabetic patients (n = 13) (∗∗∗∗p < 0.0001 between Normal and Diabetes). (o) The serum levels of complement C3 in diabetic patients (n = 27) and normal peers (n = 13) (∗∗p = 0.0072 between Normal and Diabetes). (p) The correlations between DSST score and increased C3 levels in diabetic patients (n = 27) and normal peers (n = 13). Correlations were found using linear regression, with r = −0.3315 and p = 0.0366. Values presented as mean ± SEM. Two-way ANOVA with Tukey's multiple comparisons test was performed in e. One-way ANOVA with Tukey's multiple comparisons test was performed in b, f–l. Two-tailed Student's t-test was performed in m–o.CC BY-NC-ND · PubMed Central
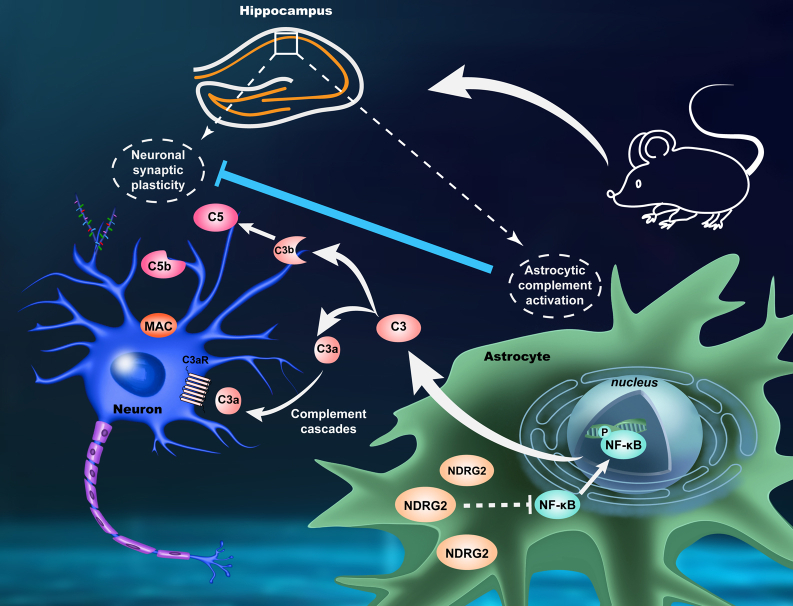
Graphical Abstract The integrative mechanism of astrocytic NDRG2 and complement cascades in regulating neuronal synaptic plasticity. Overexpression of astrocytic NDRG2 inhibited over-activation of complement cascades mediated by C3 protein, thus alleviating cognitive dysfunction in diabetic mice. NDRG2 acts as a regulator of astrocytic-neuronal interaction via NF-κB/C3/C3aR signaling to restore synaptic function in diabetic mice.
Graphical Abstract The integrative mechanism of astrocytic NDRG2 and complement cascades in regulating neuronal synaptic plasticity. Overexpression of astrocytic NDRG2 inhibited over-activation of complement cascades mediated by C3 protein, thus alleviating cognitive dysfunction in diabetic mice. NDRG2 acts as a regulator of astrocytic-neuronal interaction via NF-κB/C3/C3aR signaling to restore synaptic function in diabetic mice.CC BY-NC-ND · PubMed Central

Verification

Claims the paper makes

The claims and statistics of this paper haven’t been checked yet.

Run the check — free, no account needed. It reads the open-access text and checks the sources it cites.

A few free checks a day · papers already verified open instantly · results are public

Claims other papers make about this one

Each is checked against this paper’s own text: does it say what the citing paper says it does?

Self-check

Percentages, sums and reported differences re-computed from the paper’s own numbers.

The self-check needs the paper’s full text.

Citations

Cites

Show all 14 references

Research works printed but not linked: 59

  1. 2018, Global, regional, and national incidence, prevalence, and years lived with disability for 354 diseases and injuries for 195 countries and territories, 1990-2017: a systematic analysis for the Global Burden of Disease Study 2017, Lancet, 392, 1789, 10.1016/S0140-6736(18)32279-7 · DOI · Paper page
  2. Zilliox, 2016, Diabetes and cognitive impairment, Curr Diab Rep, 16, 87, 10.1007/s11892-016-0775-x · DOI
  3. Gao, 2016, The prevalence of mild cognitive impairment with type 2 diabetes mellitus among elderly people in China: a cross-sectional study, Arch Gerontol Geriatr, 62, 138, 10.1016/j.archger.2015.09.003 · DOI
  4. Biessels, 2020, Cognitive dysfunction in diabetes: how to implement emerging guidelines, Diabetologia, 63, 3, 10.1007/s00125-019-04977-9 · DOI
  5. Biessels, 2018, Cognitive decline and dementia in diabetes mellitus: mechanisms and clinical implications, Nat Rev Endocrinol, 14, 591, 10.1038/s41574-018-0048-7 · DOI · Paper page
  6. Pearson-Stuttard, 2021, Trends in predominant causes of death in individuals with and without diabetes in England from 2001 to 2018: an epidemiological analysis of linked primary care records, Lancet Diabetes Endocrinol, 9, 165, 10.1016/S2213-8587(20)30431-9 · DOI · Paper page
  7. Moon, 2016, Running-induced systemic cathepsin B secretion is associated with memory function, Cell Metab, 24, 332, 10.1016/j.cmet.2016.05.025 · DOI · Paper page
  8. Yun, 2018, Block of A1 astrocyte conversion by microglia is neuroprotective in models of Parkinson's disease, Nat Med, 24, 931, 10.1038/s41591-018-0051-5 · DOI · Paper page
  9. Cheung, 2022, Physiological synaptic activity and recognition memory require astroglial glutamine, Nat Commun, 13, 753, 10.1038/s41467-022-28331-7 · DOI
  10. Habib, 2020, Disease-associated astrocytes in Alzheimer's disease and aging, Nat Neurosci, 23, 701, 10.1038/s41593-020-0624-8 · DOI · Paper page
  11. Nation, 2019, Blood-brain barrier breakdown is an early biomarker of human cognitive dysfunction, Nat Med, 25, 270, 10.1038/s41591-018-0297-y · DOI · Paper page
  12. Leardini-Tristao, 2020, Physical exercise promotes astrocyte coverage of microvessels in a model of chronic cerebral hypoperfusion, J Neuroinflammation, 17, 117, 10.1186/s12974-020-01771-y · DOI
  13. Li, 2017, Deficiency of tumor suppressor NDRG2 leads to attention deficit and hyperactive behavior, J Clin Invest, 127, 4270, 10.1172/JCI94455 · DOI
  14. Takarada-Iemata, 2018, N-myc downstream-regulated gene 2 protects blood-brain barrier integrity following cerebral ischemia, Glia, 66, 1432, 10.1002/glia.23315 · DOI
  15. Hu, 2006, Expression analysis of the NDRG2 gene in mouse embryonic and adult tissues, Cell Tissue Res, 325, 67, 10.1007/s00441-005-0137-5 · DOI
  16. Li, 2020, Astrocyte-specific NDRG2 gene: functions in the brain and neurological diseases, Cell Mol Life Sci, 77, 2461, 10.1007/s00018-019-03406-9 · DOI
  17. Skiriute, 2014, Glioma malignancy-dependent NDRG2 gene methylation and downregulation correlates with poor patient outcome, J Cancer, 5, 446
  18. Yin, 2020, NDRG2 protects the brain from excitotoxicity by facilitating interstitial glutamate uptake, Transl Stroke Res, 11, 214, 10.1007/s12975-019-00708-9 · DOI
  19. Guo, 2021, Astroglial N-myc downstream-regulated gene 2 protects the brain from cerebral edema induced by stroke, Glia, 69, 281, 10.1002/glia.23888 · DOI
  20. Tao, 2020, N-myc downstream-regulated gene 2 deficiency aggravates memory impairment in Alzheimer's disease, Behav Brain Res, 379, 10.1016/j.bbr.2019.112384 · DOI
  21. Ichikawa, 2015, The loss of NDRG2 expression improves depressive behavior through increased phosphorylation of GSK3beta, Cell Signal, 27, 2087, 10.1016/j.cellsig.2015.07.012 · DOI
  22. Nagai, 2019, Hyperactivity with disrupted attention by activation of an astrocyte synaptogenic cue, Cell, 177, 1280, 10.1016/j.cell.2019.03.019 · DOI
  23. Schartz, 2020, The good, the bad, and the opportunities of the complement system in neurodegenerative disease, J Neuroinflammation, 17, 354, 10.1186/s12974-020-02024-8 · DOI
  24. King, 2021, Complement in metabolic disease: metaflammation and a two-edged sword, Semin Immunopathol, 43, 829, 10.1007/s00281-021-00873-w · DOI
  25. Stokowska, 2017, Complement peptide C3a stimulates neural plasticity after experimental brain ischaemia, Brain, 140, 353, 10.1093/brain/aww314 · DOI
  26. Joshi, 2019, Fragmented mitochondria released from microglia trigger A1 astrocytic response and propagate inflammatory neurodegeneration, Nat Neurosci, 22, 1635, 10.1038/s41593-019-0486-0 · DOI · Paper page
  27. Moien-Afshari, 2008, Exercise restores endothelial function independently of weight loss or hyperglycaemic status in db/db mice, Diabetologia, 51, 1327, 10.1007/s00125-008-0996-x · DOI
  28. Lee, 2021, Astrocytes phagocytose adult hippocampal synapses for circuit homeostasis, Nature, 590, 612, 10.1038/s41586-020-03060-3 · DOI
  29. Wisniewski, 2009, Universal sample preparation method for proteome analysis, Nat Methods, 6, 359, 10.1038/nmeth.1322 · DOI · Paper page
  30. Zhu, 2014, Proteomic analysis of solid pseudopapillary tumor of the pancreas reveals dysfunction of the endoplasmic reticulum protein processing pathway, Mol Cell Proteomics, 13, 2593, 10.1074/mcp.M114.038786 · DOI
  31. Owen, 2021, Excitatory synaptic transmission in hippocampal area CA1 is enhanced then reduced as chronic epilepsy progresses, Neurobiol Dis, 154, 10.1016/j.nbd.2021.105343 · DOI
  32. Ye, 2018, Gastrodin alleviates cognitive dysfunction and depressive-like behaviors by inhibiting ER stress and NLRP3 inflammasome activation in db/db mice, Int J Mol Sci, 19, 3977, 10.3390/ijms19123977 · DOI
  33. Liu, 2020, Gut microbiota mediates intermittent-fasting alleviation of diabetes-induced cognitive impairment, Nat Commun, 11, 855, 10.1038/s41467-020-14676-4 · DOI · Paper page
  34. Johnson, 2020, Large-scale proteomic analysis of Alzheimer's disease brain and cerebrospinal fluid reveals early changes in energy metabolism associated with microglia and astrocyte activation, Nat Med, 26, 769, 10.1038/s41591-020-0815-6 · DOI · Paper page
  35. Propson, 2021, Complement in neurologic disease, Annu Rev Pathol, 16, 277, 10.1146/annurev-pathol-031620-113409 · DOI
  36. Xin, 2020, That wasn't a complement-too much C3 in demyelinating disease, Immunity, 52, 11, 10.1016/j.immuni.2019.12.014 · DOI
  37. Zhao, 2018, High glucose-induced complement component 3 up-regulation via RAGE-p38MAPK-NF-kappaB signalling in astrocytes: in vivo and in vitro studies, J Cell Mol Med, 22, 6087, 10.1111/jcmm.13884 · DOI
  38. Flugge, 2014, NDRG2 as a marker protein for brain astrocytes, Cell Tissue Res, 357, 31, 10.1007/s00441-014-1837-5 · DOI
  39. Zhang, 2019, N-myc downstream-regulated gene 2 controls astrocyte morphology via Rho-GTPase signaling, J Cell Physiol, 234, 20847, 10.1002/jcp.28689 · DOI
  40. Zahir, 2007, Novel deletions of 14q11.2 associated with developmental delay, cognitive impairment and similar minor anomalies in three children, J Med Genet, 44, 556, 10.1136/jmg.2007.050823 · DOI
  41. Lee, 2021, NDRG2 expression in breast cancer cells downregulates PD-L1 expression and restores T cell proliferation in tumor-coculture, Cancers (Basel), 13, 6112, 10.3390/cancers13236112 · DOI
  42. Lee, 2022, The function of N-myc downstream-regulated gene 2 (NDRG2) as a negative regulator in tumor cell metastasis, Int J Mol Sci, 23, 9365, 10.3390/ijms23169365 · DOI
  43. Wei, 2021, The complement C3-C3aR pathway mediates microglia-astrocyte interaction following status epilepticus, Glia, 69, 1155, 10.1002/glia.23955 · DOI
  44. Zhang, 2022, IL-1R/C3aR signaling regulates synaptic pruning in the prefrontal cortex of depression, Cell Biosci, 12, 90, 10.1186/s13578-022-00832-4 · DOI
  45. Exalto, 2013, Risk score for prediction of 10 year dementia risk in individuals with type 2 diabetes: a cohort study, Lancet Diabetes Endocrinol, 1, 183, 10.1016/S2213-8587(13)70048-2 · DOI · Paper page
  46. McCrimmon, 2012, Diabetes and cognitive dysfunction, Lancet, 379, 2291, 10.1016/S0140-6736(12)60360-2 · DOI
  47. Wu, 2019, Complement C3 is activated in human AD brain and is required for neurodegeneration in mouse models of amyloidosis and tauopathy, Cell Rep, 28, 2111, 10.1016/j.celrep.2019.07.060 · DOI · Paper page
  48. Litvinchuk, 2018, Complement C3aR inactivation attenuates tau pathology and reverses an immune network deregulated in tauopathy models and Alzheimer's disease, Neuron, 100, 1337, 10.1016/j.neuron.2018.10.031 · DOI · Paper page
  49. Crider, 2018, Complement component 3a receptor deficiency attenuates chronic stress-induced monocyte infiltration and depressive-like behavior, Brain Behav Immun, 70, 246, 10.1016/j.bbi.2018.03.004 · DOI · Paper page
  50. Yang, 2018, Increased serum C3 and decreased UA in patients of bipolar disorder in Chinese han population, Front Psychiatry, 9, 381, 10.3389/fpsyt.2018.00381 · DOI
  51. Alper, 1969, Human C'3: evidence for the liver as the primary site of synthesis, Science, 163, 286, 10.1126/science.163.3864.286 · DOI
  52. Choy, 1992, Adipsin and an endogenous pathway of complement from adipose cells, J Biol Chem, 267, 12736, 10.1016/S0021-9258(18)42338-1 · DOI
  53. Wlazlo, 2014, Complement factor 3 is associated with insulin resistance and with incident type 2 diabetes over a 7-year follow-up period: the CODAM Study, Diabetes Care, 37, 1900, 10.2337/dc13-2804 · DOI
  54. Somani, 2012, Elevated properdin and enhanced complement activation in first-degree relatives of South Asian subjects with type 2 diabetes, Diabetes Care, 35, 894, 10.2337/dc11-1483 · DOI
  55. Muscari, 2007, Serum C3 is a stronger inflammatory marker of insulin resistance than C-reactive protein, leukocyte count, and erythrocyte sedimentation rate: comparison study in an elderly population, Diabetes Care, 30, 2362, 10.2337/dc07-0637 · DOI
  56. Weyer, 2000, Insulin action and insulinemia are closely related to the fasting complement C3, but not acylation stimulating protein concentration, Diabetes Care, 23, 779, 10.2337/diacare.23.6.779 · DOI
  57. Rasmussen, 2018, Complement C3 and risk of diabetic microvascular disease: a cohort study of 95202 individuals from the general population, Clin Chem, 64, 1113, 10.1373/clinchem.2018.287581 · DOI
  58. King, 2015, Inhibition of complement C3 and fibrinogen interaction: a potential novel therapeutic target to reduce cardiovascular disease in diabetes, Lancet, 385, S57, 10.1016/S0140-6736(15)60372-5 · DOI
  59. King, 2021, Fibrinogen interaction with complement C3: a potential therapeutic target to reduce thrombosis risk, Haematologica, 106, 1616, 10.3324/haematol.2019.239558 · DOI

Cited by

Sorted by citations

Metadata

Authors
Jiang, T., Li, Y., He, S., Huang, N., Du, M., Zhai, Q., Pu, K., Wu, M., Yan, C., Ma, Z., & Wang, Q.
Venue
eBioMedicine
Publisher
Elsevier BV
Published
2023-07
Volume
93
Pages
104653
ISSN
2352-3964
Cited by
57
References
14
Language
en
Funders
  • National Natural Science Foundation of China (81801899, 81971290, 81974540)
  • Fundamental Research Funds for the Central Universities (xzy022019020)
  • Key Research and Development Projects of Shaanxi Province (2022ZDLSF02-09)

About these checks

Registry, retraction, Cites and statistics results are computed, not judged, with one exception: a printed reference that no index lists is read once by a model before it counts as a citation error. Claims are extracted by a model and kept only when their quote appears verbatim in the text; each cited source is then checked, with a model’s help, for whether it says what the claim relies on. Those verdicts can be wrong — read the claim’s quote and the cited source before relying on one.

Statistics and arithmetic are recomputed, not judged.

Confidence bands are shown only for fields calibrated on our annotated test set. None is calibrated yet, so no band is shown.

What counts as a claim ›How we measure confidence ›How we check this ›

Are you an author, or do you see a problem with this page? Request a review