Student or educator? Sign up with your school email and get 6 months of Pro free.
Cited by 17

The DOI matches its Crossref record; 59 of the 59 references it cites were found in a registry or an index.

Systems biology analysis reveals distinct molecular signatures associated with immune responsiveness to the BNT162b COVID-19 vaccine

Odak, Ivan, Riemann, Lennart, Sandrock, Inga, Cossmann, Anne, Ramos, Gema Morillas, Hammerschmidt, Swantje I., Ritter, Christiane, Friedrichsen, Michaela, Hassan, Ahmed, Dopfer-Jablonka, Alexandra, Stankov, Metodi V., Weskamm, Leonie M., Addo, Marylyn M., Ravens, Inga, Willenzon, Stefanie, Schimrock, Anja, Ristenpart, Jasmin, Janssen, Anika, Barros-Martins, Joana, Hansen, Gesine, Falk, Christine, Behrens, Georg M.N., Förster, Reinhold·2024·eBioMedicine

Abstract

BACKGROUND: Human immune responses to COVID-19 vaccines display a large heterogeneity of induced immunity and the underlying immune mechanisms for this remain largely unknown. METHODS: Using a systems biology approach, we longitudinally profiled a unique cohort of female high and low responders to the BNT162b vaccine, who were known from previous COVID-19 vaccinations to develop maximum and minimum immune responses to the vaccine. We utilized high dimensional flow cytometry, bulk and single cell mRNA sequencing and 48-plex serum cytokine analyses. FINDINGS: We revealed early, transient immunological and molecular signatures that distinguished high from low responders and correlated with B and T cell responses measured 14 days later. High responders featured a distinct transcriptional activity of interferon-driven genes and genes connected to enhanced antigen presentation. This was accompanied by a robust cytokine response related to Th1 differentiation. Both transcriptome and serum cytokine signatures were confirmed in two independent confirmatory cohorts. INTERPRETATION: Collectively, our data contribute to a better understanding of the immunogenicity of mRNA-based COVID-19 vaccines, which might lead to the optimization of vaccine designs for individuals with poor vaccine responses. FUNDING: German Center for Infection Research, German Center for Lung Research, German Research Foundation, Excellence Strategy EXC 2155 "RESIST" and European Regional Development Fund.

Overview

The claims and statistics of this paper haven’t been checked yet.

Run the check — free, no account needed. It reads the open-access text and checks the sources it cites.

A few free checks a day · papers already verified open instantly · results are public

Integrity signals

Registry

Crossref · 10.1016/j.ebiom.2023.104947

Cites

59 of 59 references verified0 citation errors · 0 not checkable

Statistics

Figures

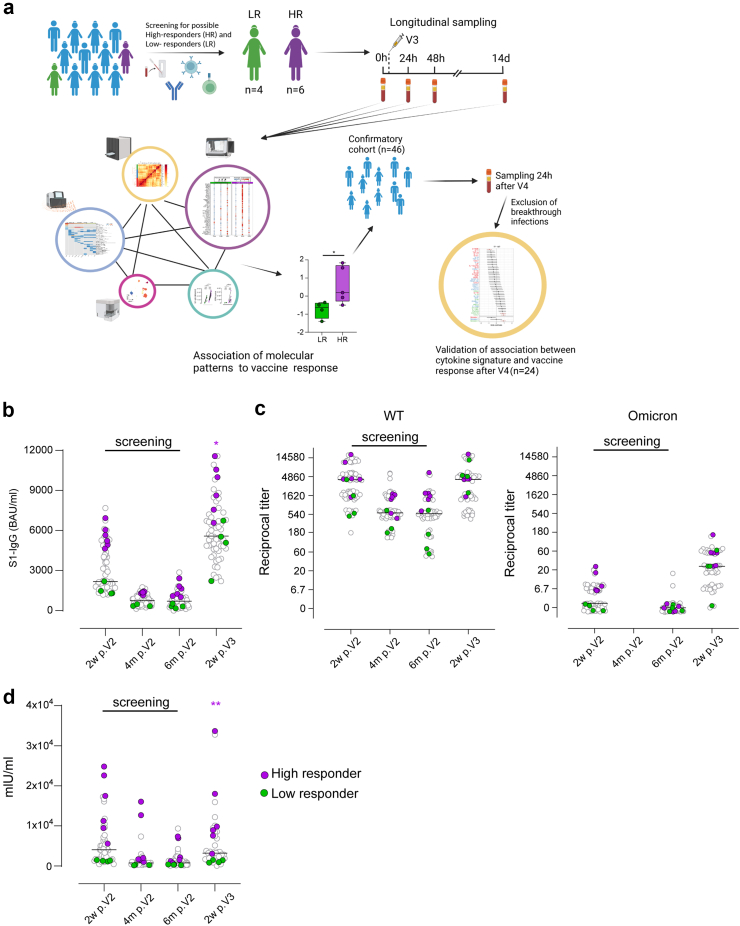
Fig. 1 Immunological parameters defining high- and low responders to BNT162b2 vaccine 14 days after the booster dose. a, Study design scheme. b, S-specific IgG in plasma after the second vaccination and booster. c, Reciprocal titers of neutralizing antibodies against the WT and Omicron strains. For better visualization of identical titer values, data were randomly and proportionally adjusted closely around the precise titer results. d, IFN-γ concentration in full blood supernatants after stimulation with SARS-CoV-2 S1 domain for 20–24 h measured by IGRA (EUROIMMUN). a–d, Grey data points were previously published.7 Purple stars indicate statistical difference between HR (purple) and LR green). Screening for participants was performed taking the first three points into account. ∗p < 0.05; ∗∗p < 0.01; V3 = booster dose; V4 = fourth dose; 2w p.V2 = 2 weeks post Vaccination 2; 4 m p.V2 = 4 months post Vaccination 2.
Fig. 1 Immunological parameters defining high- and low responders to BNT162b2 vaccine 14 days after the booster dose. a, Study design scheme. b, S-specific IgG in plasma after the second vaccination and booster. c, Reciprocal titers of neutralizing antibodies against the WT and Omicron strains. For better visualization of identical titer values, data were randomly and proportionally adjusted closely around the precise titer results. d, IFN-γ concentration in full blood supernatants after stimulation with SARS-CoV-2 S1 domain for 20–24 h measured by IGRA (EUROIMMUN). a–d, Grey data points were previously published.7 Purple stars indicate statistical difference between HR (purple) and LR green). Screening for participants was performed taking the first three points into account. ∗p < 0.05; ∗∗p < 0.01; V3 = booster dose; V4 = fourth dose; 2w p.V2 = 2 weeks post Vaccination 2; 4 m p.V2 = 4 months post Vaccination 2.CC BY-NC-ND · PubMed Central
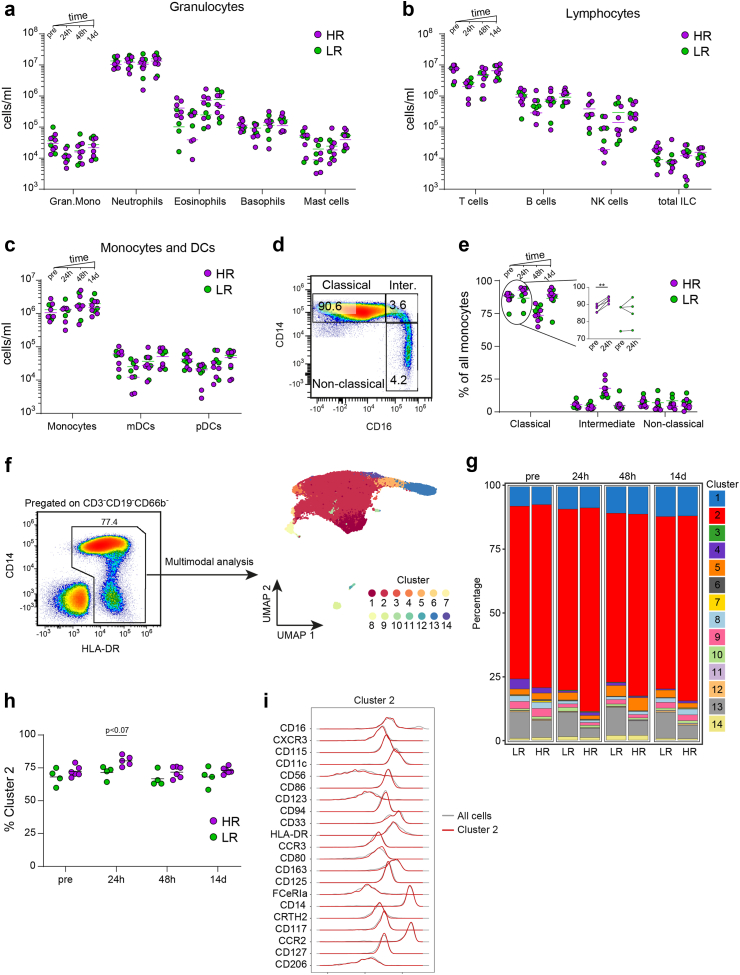
Fig. 2 In-depth profiling of the myeloid compartment by spectral flow cytometry. a, Granulocyte numbers in blood of HR and LR at preboost, 24 h, 48 h and 14 days. b, Main lymphocyte population numbers in blood of HR and LR (ILC = innate lymphoid cells). c, Monocyte and dendritic cell numbers in blood of HR and LR. d, Example gating principle for monocyte subpopulations. e, frequencies of classical, intermediate and non-classical monocytes out of all monocytes. f, Pregating example of cells used for UMAP projection and multimodal analysis. g, Bar plot showing the proportions of each cell type in low responders (LR) and high responders (HR) at different timepoints. h, Frequencies of cluster 2 cells out of all antigen-presenting cells used in analysis. i, Immunophenotype of cells consisting cluster 2 (red) overlaid over overall expression from all cells (grey). Statistics: paired t test, ∗∗p ≤ 0.01.
Fig. 2 In-depth profiling of the myeloid compartment by spectral flow cytometry. a, Granulocyte numbers in blood of HR and LR at preboost, 24 h, 48 h and 14 days. b, Main lymphocyte population numbers in blood of HR and LR (ILC = innate lymphoid cells). c, Monocyte and dendritic cell numbers in blood of HR and LR. d, Example gating principle for monocyte subpopulations. e, frequencies of classical, intermediate and non-classical monocytes out of all monocytes. f, Pregating example of cells used for UMAP projection and multimodal analysis. g, Bar plot showing the proportions of each cell type in low responders (LR) and high responders (HR) at different timepoints. h, Frequencies of cluster 2 cells out of all antigen-presenting cells used in analysis. i, Immunophenotype of cells consisting cluster 2 (red) overlaid over overall expression from all cells (grey). Statistics: paired t test, ∗∗p ≤ 0.01.CC BY-NC-ND · PubMed Central
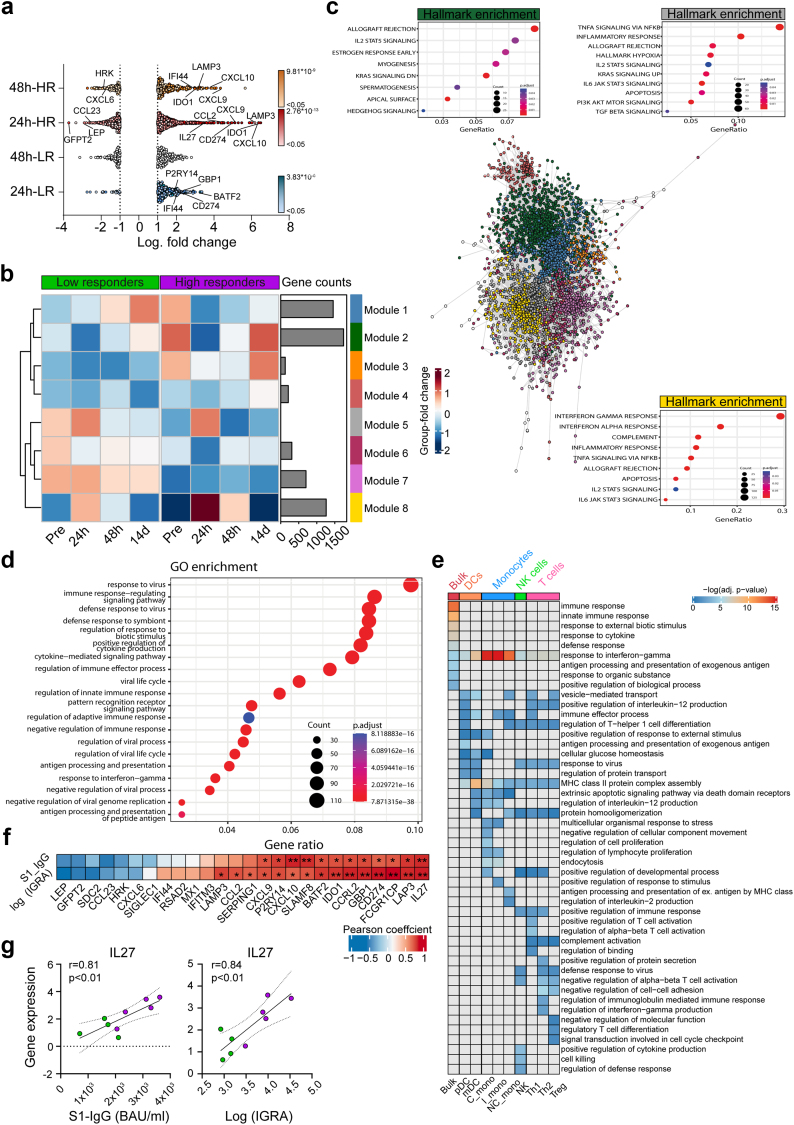
Fig. 3 Elevated leukocyte transcriptional activity as a response to vaccination discriminates high and low responders. Bulk mRNA analysis of whole blood using PAXgene® tubes. a, Differentially expressed genes (DEGs) from 24 h vs. pre-boost and 48 h vs. pre-boost in HR and LR. The x-axis shows the log2-fold change of DEGs between time-points (vs. pre-boost) in each group. Significantly up-or down-regulated genes are colored depending on their p values. No significant DEGs were detected in LR at 48 h vs. preboost. b, Heatmap showing the fold-change of gene expression for every module at each group and time-point compared to the overall mean expression. c, Network visualization of gene co-expression analysis. Co-expressing genes were clustered into modules. Top Hallmark enrichment terms are displayed for modules 2, 5, and 8. d, Gene ontology biological processes (GO:BP) terms for module 8. e, Complementary bulk RNA deconvolution using the single-cell mapper (scMappR) algorithm, which assigns and re-weights cell-types to DEGs obtained from bulk RNA sequencing data. The top 10 GO:BP terms from bulk RNA and each assigned cell type are shown. Each GO term is only shown once, redundant GO terms were omitted. f, Heatmap depicting correlation coefficients between relative gene expression of the selected DEGs at 24 h and S-IgG levels and IGRA values at 14 d. IGRA data was log-transformed to achieve normal distribution. g, Correlations plots of gene expression of IL27 and both outcome variables. Correlation plots for the remaining significant correlations can be found in Supplementary Fig. 4c. Statistics: Pearson correlation, ∗p ≤ 0.05; ∗∗p ≤ 0.01; ∗∗∗p ≤ 0.001.
Fig. 3 Elevated leukocyte transcriptional activity as a response to vaccination discriminates high and low responders. Bulk mRNA analysis of whole blood using PAXgene® tubes. a, Differentially expressed genes (DEGs) from 24 h vs. pre-boost and 48 h vs. pre-boost in HR and LR. The x-axis shows the log2-fold change of DEGs between time-points (vs. pre-boost) in each group. Significantly up-or down-regulated genes are colored depending on their p values. No significant DEGs were detected in LR at 48 h vs. preboost. b, Heatmap showing the fold-change of gene expression for every module at each group and time-point compared to the overall mean expression. c, Network visualization of gene co-expression analysis. Co-expressing genes were clustered into modules. Top Hallmark enrichment terms are displayed for modules 2, 5, and 8. d, Gene ontology biological processes (GO:BP) terms for module 8. e, Complementary bulk RNA deconvolution using the single-cell mapper (scMappR) algorithm, which assigns and re-weights cell-types to DEGs obtained from bulk RNA sequencing data. The top 10 GO:BP terms from bulk RNA and each assigned cell type are shown. Each GO term is only shown once, redundant GO terms were omitted. f, Heatmap depicting correlation coefficients between relative gene expression of the selected DEGs at 24 h and S-IgG levels and IGRA values at 14 d. IGRA data was log-transformed to achieve normal distribution. g, Correlations plots of gene expression of IL27 and both outcome variables. Correlation plots for the remaining significant correlations can be found in Supplementary Fig. 4c. Statistics: Pearson correlation, ∗p ≤ 0.05; ∗∗p ≤ 0.01; ∗∗∗p ≤ 0.001.CC BY-NC-ND · PubMed Central
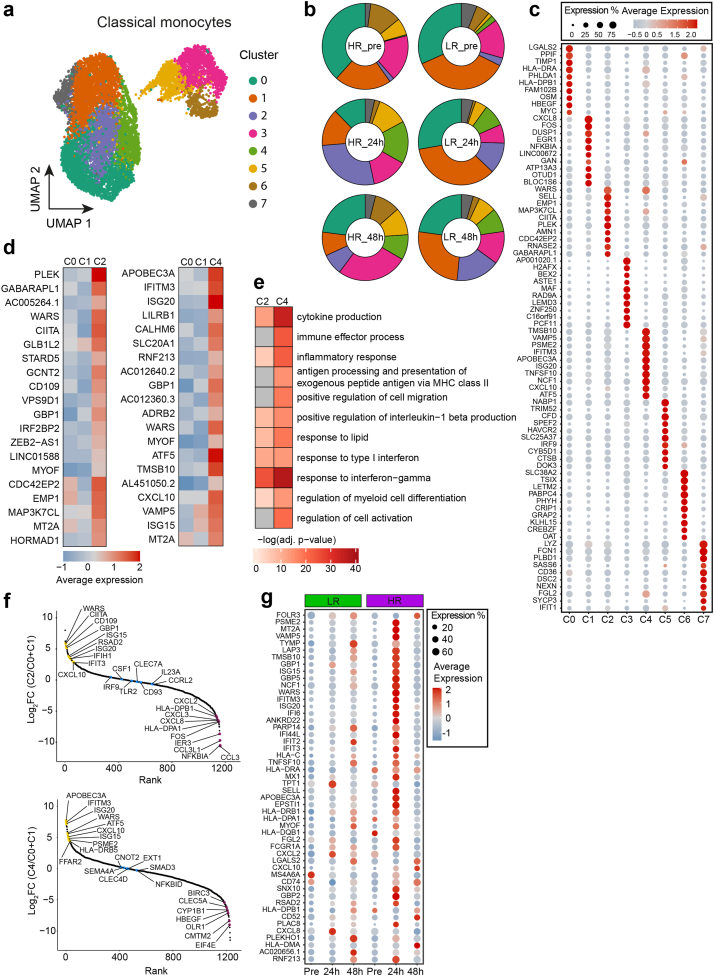
Fig. 4 Distinct classical monocyte differentiation in HR displaying interferon-associated gene pathways. a, UMAP projection of cell clusters in classical monocytes. b, Distribution of the cell clusters in classical monocytes across groups and time-points. c, Dot plot displaying the top 10 marker genes differentiating each cluster most from all others. d, Average gene expression of the top 20 DEGs between Cluster 2 and 4, respectively, against Cluster 0 and 1. e, Heatmap depicting the selected GO:BP terms for DEGs between Cluster 2 and 4, respectively, against Cluster 0 and 1. f, Rank-plots showing fold expression change of selected genes from cluster 2 (upper plot) or cluster 4 (lower plot) compared to clusters 0 and 1. g, Dot plot displaying the gene expression of the top 50 DEGs between HR and LR at 24 h post-boost across the all measured time-points.
Fig. 4 Distinct classical monocyte differentiation in HR displaying interferon-associated gene pathways. a, UMAP projection of cell clusters in classical monocytes. b, Distribution of the cell clusters in classical monocytes across groups and time-points. c, Dot plot displaying the top 10 marker genes differentiating each cluster most from all others. d, Average gene expression of the top 20 DEGs between Cluster 2 and 4, respectively, against Cluster 0 and 1. e, Heatmap depicting the selected GO:BP terms for DEGs between Cluster 2 and 4, respectively, against Cluster 0 and 1. f, Rank-plots showing fold expression change of selected genes from cluster 2 (upper plot) or cluster 4 (lower plot) compared to clusters 0 and 1. g, Dot plot displaying the gene expression of the top 50 DEGs between HR and LR at 24 h post-boost across the all measured time-points.CC BY-NC-ND · PubMed Central
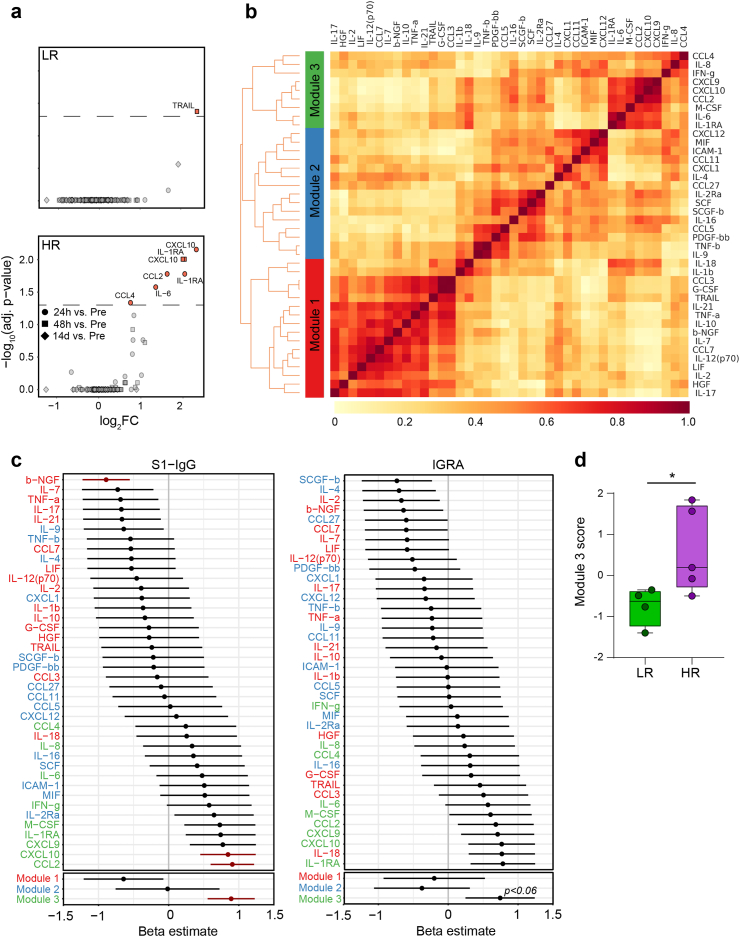
Fig. 5 Strong IFN- driven cytokine signature is present in high responders early after vaccination. a, Volcano plots showing differentially expressed cytokines at 24 h vs. pre-boost, 48 h vs. pre-boost, and 14 d vs. pre-boost in HR and LR. Dashed line represent an adjusted p-value cutoff of 0.05. b, Heatmap showing the cluster membership and reliability scores (i.e., the proportion of times that each pair of cytokines is allocated to the same cluster over 1000 random samplings of participant samples) of adjusted cytokines. c, Forrest plot displaying the beta estimates from linear regression analyses between scaled cytokine/module levels and scaled S1-IgG levels (left) and IGRA (right). Red crossbars indicate an adjusted p-value of <0.05. d, Box-plot depicting module scores for module 3 in each participant in HR vs. LR. Module scores were calculated as the mean value of all adjusted cytokines in module 3 after scaling cytokine levels to a mean of zero and a standard deviation of 1. Statistics: c, p-values were corrected using the Benjamini-Hochberg method within cytokines and within modules, respectively. d, Unpaired t test with Welch's correction.
Fig. 5 Strong IFN- driven cytokine signature is present in high responders early after vaccination. a, Volcano plots showing differentially expressed cytokines at 24 h vs. pre-boost, 48 h vs. pre-boost, and 14 d vs. pre-boost in HR and LR. Dashed line represent an adjusted p-value cutoff of 0.05. b, Heatmap showing the cluster membership and reliability scores (i.e., the proportion of times that each pair of cytokines is allocated to the same cluster over 1000 random samplings of participant samples) of adjusted cytokines. c, Forrest plot displaying the beta estimates from linear regression analyses between scaled cytokine/module levels and scaled S1-IgG levels (left) and IGRA (right). Red crossbars indicate an adjusted p-value of <0.05. d, Box-plot depicting module scores for module 3 in each participant in HR vs. LR. Module scores were calculated as the mean value of all adjusted cytokines in module 3 after scaling cytokine levels to a mean of zero and a standard deviation of 1. Statistics: c, p-values were corrected using the Benjamini-Hochberg method within cytokines and within modules, respectively. d, Unpaired t test with Welch's correction.CC BY-NC-ND · PubMed Central
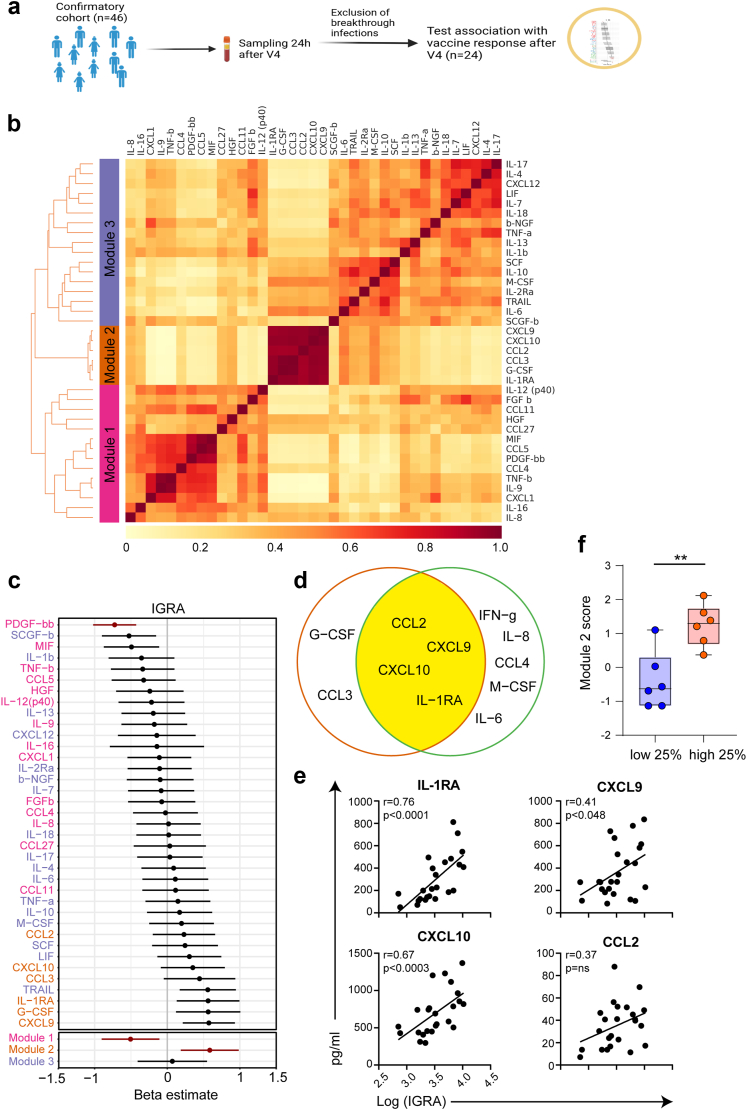
Fig. 6 IFN- driven cytokine signature is present in an independent cohort and predicative of high cellular immunity. a, Data collection scheme. b, Heatmap showing the cluster membership and reliability scores (i.e., the proportion of times that each pair of cytokines is allocated to the same cluster over 1000 random samplings of participant samples) of adjusted cytokines. c, Forrest plot displaying the beta estimates from linear regression analyses between scaled cytokine/module levels and scaled IGRA values. Red crossbar indicate an adjusted p-value of <0.05. d, Venn Diagram showing the overlap of cytokines from Module 2 of the confirmatory cohort (purple) and cytokines from Module 3 of the original cohort from Fig. 5c. e, Correlation plots of cytokines with the IGRA levels. f, Box-plot depicting module scores for module 2 in each participant of top 25% and lowest 25% of participants. Module scores were calculated as the mean value of all adjusted cytokines in module 3 after scaling cytokine levels to a mean of zero and a standard deviation of 1. Statistics: c, p-values were corrected using the Benjamini-Hochberg method within cytokines and within modules, respectively. e, Unpaired t test with Welch's correction. ∗∗p < 0.01.
Fig. 6 IFN- driven cytokine signature is present in an independent cohort and predicative of high cellular immunity. a, Data collection scheme. b, Heatmap showing the cluster membership and reliability scores (i.e., the proportion of times that each pair of cytokines is allocated to the same cluster over 1000 random samplings of participant samples) of adjusted cytokines. c, Forrest plot displaying the beta estimates from linear regression analyses between scaled cytokine/module levels and scaled IGRA values. Red crossbar indicate an adjusted p-value of <0.05. d, Venn Diagram showing the overlap of cytokines from Module 2 of the confirmatory cohort (purple) and cytokines from Module 3 of the original cohort from Fig. 5c. e, Correlation plots of cytokines with the IGRA levels. f, Box-plot depicting module scores for module 2 in each participant of top 25% and lowest 25% of participants. Module scores were calculated as the mean value of all adjusted cytokines in module 3 after scaling cytokine levels to a mean of zero and a standard deviation of 1. Statistics: c, p-values were corrected using the Benjamini-Hochberg method within cytokines and within modules, respectively. e, Unpaired t test with Welch's correction. ∗∗p < 0.01.CC BY-NC-ND · PubMed Central

Verification

Claims the paper makes

The claims and statistics of this paper haven’t been checked yet.

Run the check — free, no account needed. It reads the open-access text and checks the sources it cites.

A few free checks a day · papers already verified open instantly · results are public

Claims other papers make about this one

Each is checked against this paper’s own text: does it say what the citing paper says it does?

Self-check

Percentages, sums and reported differences re-computed from the paper’s own numbers.

The self-check needs the paper’s full text.

Citations

Cites

Show all 59 references

Cited by

See all 17

Metadata

Authors
Odak, I., Riemann, L., Sandrock, I., Cossmann, A., Ramos, G. M., Hammerschmidt, S. I., Ritter, C., Friedrichsen, M., Hassan, A., Dopfer-Jablonka, A., Stankov, M. V., Weskamm, L. M., Addo, M. M., Ravens, I., Willenzon, S., Schimrock, A., Ristenpart, J., Janssen, A., Barros-Martins, J., Hansen, G., Falk, C., Behrens, G. M. N., & Förster, R.
Venue
eBioMedicine
Publisher
Elsevier BV
Published
2024-01
Volume
99
Pages
104947
ISSN
2352-3964
Cited by
17
References
59
Language
en
Licence
Funders
  • DZL (82DZL002B1)
  • Deutsches Zentrum für Infektionsforschung (80018019238, 01.938)
  • Deutsche Forschungsgemeinschaft (EXC 2155, SFB 900/3, B1, FO334/7-1, 39087428, 158989968)
  • Else Kröner-Fresenius-Stiftung
  • European Regional Development Fund

About these checks

Registry, retraction, Cites and statistics results are computed, not judged, with one exception: a printed reference that no index lists is read once by a model before it counts as a citation error. Claims are extracted by a model and kept only when their quote appears verbatim in the text; each cited source is then checked, with a model’s help, for whether it says what the claim relies on. Those verdicts can be wrong — read the claim’s quote and the cited source before relying on one.

Statistics and arithmetic are recomputed, not judged.

Confidence bands are shown only for fields calibrated on our annotated test set. None is calibrated yet, so no band is shown.

What counts as a claim ›How we measure confidence ›How we check this ›

Are you an author, or do you see a problem with this page? Request a review

How to cite

Cite CoChat for the checks on this page, and the paper for its own findings.

This page
CoChat. (2026). Citation check: Systems biology analysis reveals distinct molecular signatures associated with immune responsiveness to the BNT162b COVID-19 vaccine. https://app.cochat.ai/papers/10.1016/j.ebiom.2023.104947
The paper
Odak, I., Riemann, L., Sandrock, I., Cossmann, A., Ramos, G. M., Hammerschmidt, S. I., Ritter, C., Friedrichsen, M., Hassan, A., Dopfer-Jablonka, A., Stankov, M. V., Weskamm, L. M., Addo, M. M., Ravens, I., Willenzon, S., Schimrock, A., Ristenpart, J., Janssen, A., Barros-Martins, J., . . . Förster, R. (2024). Systems biology analysis reveals distinct molecular signatures associated with immune responsiveness to the BNT162b COVID-19 vaccine. eBioMedicine. https://doi.org/10.1016/j.ebiom.2023.104947

Data sources

Bibliographic data: Semantic Scholar, OpenAlex, Crossref.

Contains information from the Semantic Scholar Academic Graph Datasets, made available under the ODC Attribution License (ODC-BY 1.0).

Semantic Scholar’s data is described in: Kinney, R., et al. (2023). The Semantic Scholar Open Data Platform. arXiv:2301.10140.