

The DOI matches its Crossref record; 47 of the 47 references it cites were found in a registry or an index.
Dysregulated lipid and fatty acid metabolism link perfluoroalkyl substances exposure and impaired glucose metabolism in young adults
Open accessAbstract
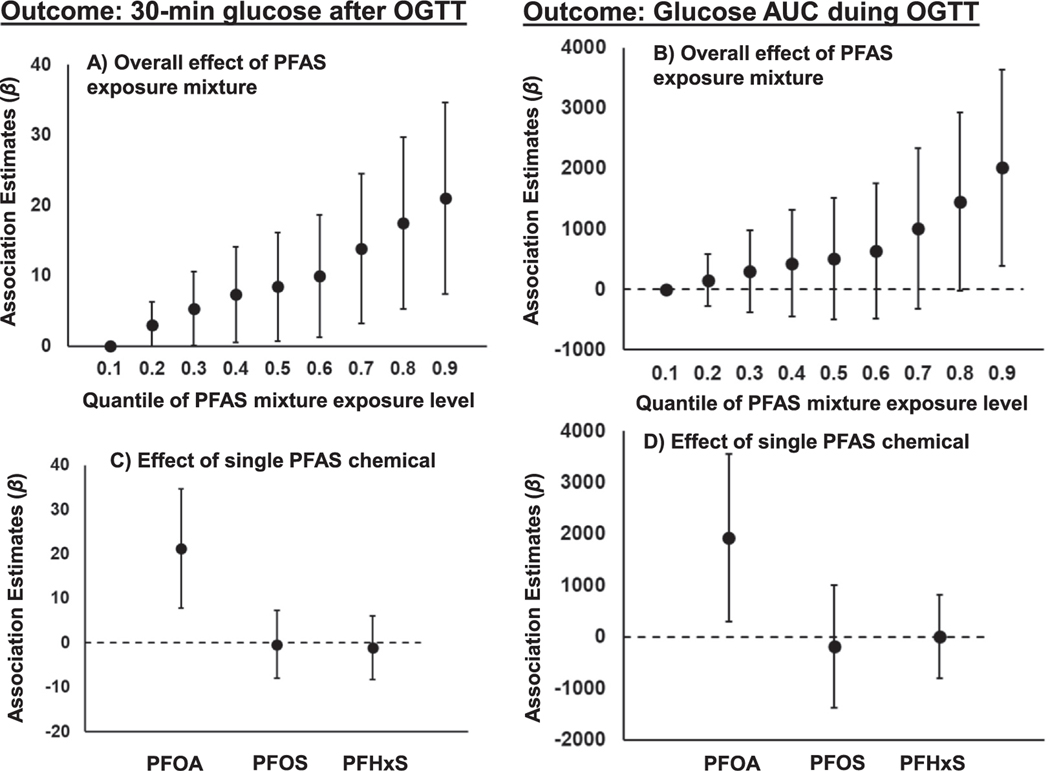
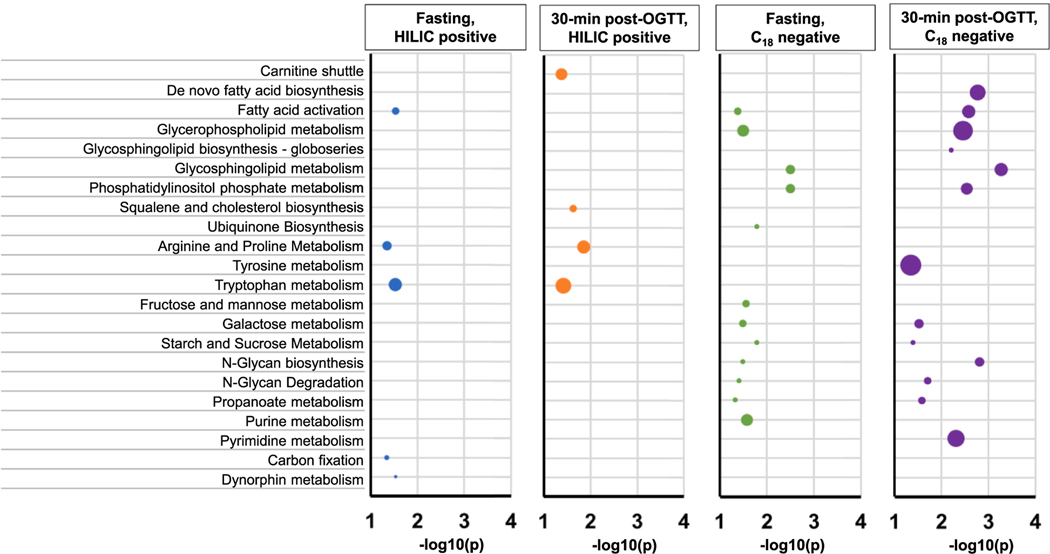
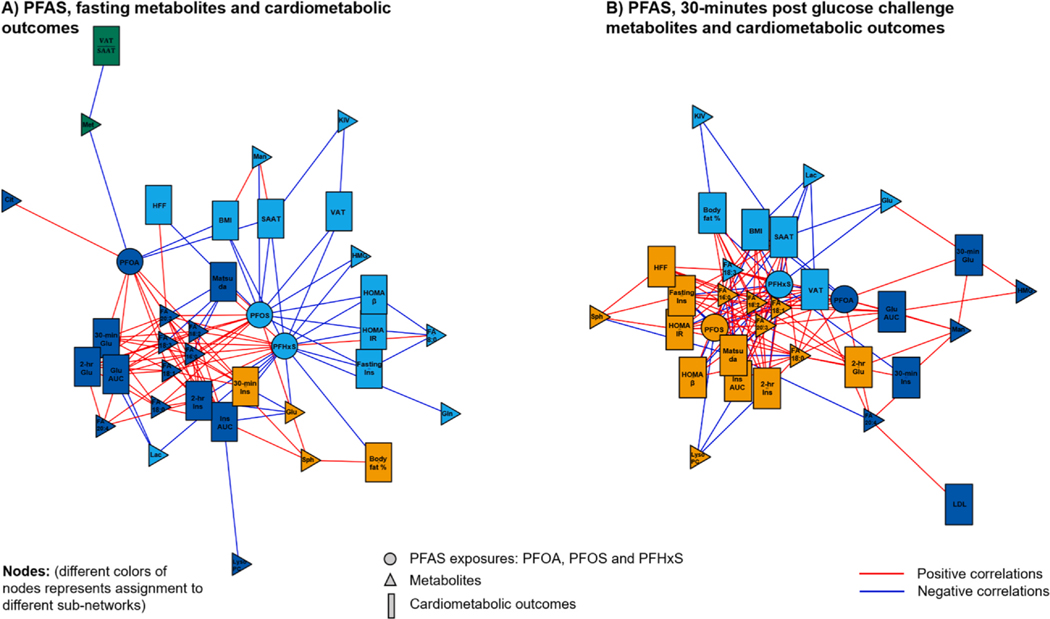
BACKGROUND: Per- and polyfluoroalkyl substances (PFASs) exposure is ubiquitous among the US population and has been linked to adverse health outcomes including cardiometabolic diseases, immune dysregulation and endocrine disruption. However, the metabolic mechanism underlying the adverse health effect of PFASs exposure is unknown. OBJECTIVE: The aim of this project is to investigate the association between PFASs exposure and altered metabolic pathways linked to increased cardiometabolic risk in young adults. METHODS: A total of 102 young adults with 82% overweight or obese participants were enrolled from Southern California between 2014 and 2017. Cardiometabolic outcomes were assessed including oral glucose tolerance test (OGTT) measures, body fat and lipid profiles. High-resolution metabolomics was used to quantify plasma exposure levels of three PFAS congeners and intensity profiles of the untargeted metabolome. Fasting concentrations of 45 targeted metabolites involved in fatty acid and lipid metabolism were used to verify untargeted metabolomics findings. Bayesian Kernel Machine Regression (BKMR) was used to examine the associations between PFAS exposure mixture and cardiometabolic outcomes adjusting for covariates. Mummichog pathway enrichment analysis was used to explore PFAS-associated metabolic pathways. Moreover, the effect of PFAS exposure on the metabolic network, including metabolomic profiles and cardiometabolic outcomes, was investigated. RESULTS: Higher exposure to perfluorooctanoic acid (PFOA) was associated with higher 30-minute glucose levels and glucose area under the curve (AUC) during the OGTT (p < 0.001). PFAS exposure was also associated with altered lipid pathways, which contributed to the metabolic network connecting PFOA and higher glucose levels following the OGTT. Targeted metabolomics analysis indicated that higher PFOA exposure was associated with higher levels of glycerol (p = 0.006), which itself was associated with higher 30-minute glucose (p = 0.006). CONCLUSIONS: Increased lipolysis and fatty acid oxidation could contribute to the biological mechanisms linking PFAS exposure and impaired glucose metabolism among young adults. Findings of this study warrants future experimental studies and epidemiological studies with larger sample size to replicate.
Overview
The claims and statistics of this paper haven’t been checked yet.
Run the check — free, no account needed. It reads the open-access text and checks the sources it cites.
Integrity signals
Registry
Cites
Statistics
Figures
Verification
Claims the paper makes
The claims and statistics of this paper haven’t been checked yet.
Run the check — free, no account needed. It reads the open-access text and checks the sources it cites.
Claims other papers make about this one
Each is checked against this paper’s own text: does it say what the citing paper says it does?
The cited source says what the claim attributes to it.
In the citing paper
“In young adults, exposure to PFASs, especially PFOA, has been associated with increased breakdown of fats and oxidation of fatty acids, potentially leading to disrupted glucose metabolism [210].”
From Industrial Applications, Environmental Fate, Human Exposure, and Health Effects of PFAS (2025) · cites this paper as [210]
Self-check
Percentages, sums and reported differences re-computed from the paper’s own numbers.
The self-check needs the paper’s full text.
Citations
Cites
Controlling the False Discovery Rate: A Practical and Powerful Approach to Multiple Testing
Benjamini, Y., & Hochberg, Y. (1995) · Journal of the Royal Statistical Society Series B: Statistical Methodology · doi:10.1111/j.2517-6161.1995.tb02031.x · Cited by 109,482
Matthews, D. R., Hosker, J. P., Rudenski, A. S., Naylor, B. A., Treacher, D. F., & Turner, R. C. (1985) · Diabetologia · doi:10.1007/bf00280883 · Cited by 31,502 · cited 3×
“Statistical analysis 1) PFAS association with cardiometabolic outcomes: Triglycerides, VLDL cholesterol, insulin traits, HOMA-IR and Matsuda Index were log transformed to approximate normal distributions.”
MethodInfluentialToprak, Ö., Kurt, H., Sarı, Y., Şarkış, C., Us, H., & Kırık, A. (2017) · Kidney & Blood Pressure Research · doi:10.1159/000468530 · Cited by 29,772
Asymptotic Confidence Intervals for Indirect Effects in Structural Equation Models
Sobel, M. E. (1982) · Sociological Methodology · doi:10.2307/270723 · Cited by 12,810
Matsuda, M., & DeFronzo, R. A. (1999) · Diabetes Care · doi:10.2337/diacare.22.9.1462 · Cited by 5,621
Sumner, L. W., Amberg, A., Barrett, D., Beale, M. H., Beger, R., Daykin, C. A., Fan, T. W.-M., Fiehn, O., Goodacre, R., Griffin, J. L., et al. (2007) · Metabolomics · doi:10.1007/s11306-007-0082-2 · Cited by 5,368
Newgard, C. B., An, J., Bain, J. R., Muehlbauer, M. J., Stevens, R. D., Lien, L. F., Haqq, A. M., Shah, S. H., Arlotto, M., Slentz, C. A., et al. (2009) · Cell Metabolism · doi:10.1016/j.cmet.2009.02.002 · Cited by 3,165
Sunderland, E. M., Hu, X. C., Dassuncao, C., Tokranov, A. K., Wagner, C. C., & Allen, J. G. (2019) · Journal of Exposure Science & Environmental Epidemiology · doi:10.1038/s41370-018-0094-1 · Cited by 2,786
Bayesian kernel machine regression for estimating the health effects of multi-pollutant mixtures
Bobb, J. F., Valeri, L., Henn, B. C., Christiani, D. C., Wright, R. O., Mazumdar, M., Godleski, J. J., & Coull, B. A. (2014) · Biostatistics · doi:10.1093/biostatistics/kxu058 · Cited by 1,873
Environmental Protection Agency (EPA)
Philander, S. G. (2008) · Sage eBooks · doi:10.4135/9781412963893.n235 · Cited by 1,683
Research works printed but not linked: 2
- Salihovic, 2018, Identification of metabolic profiles associated with human exposure to perfluoroalkyl substances, J. Expo Sci. Environ. Epidemiol.
- Patsouris, 2004, PPARalpha governs glycerol metabolism, J. Clin. Invest., 114, 94, 10.1172/JCI200420468 · DOI
Cited by
Sorted by citations
Roth, K., Yang, Z., Agarwal, M., Liu, W. J., Peng, Z., Long, Z., Birbeck, J. A., Westrick, J. A., Liu, W., & Petriello, M. C. (2021) · Environment International · doi:10.1016/j.envint.2021.106843 · Cited by 322
Espartero, L. J. L., Yamada, M., Ford, J., Owens, G., Prow, T. W., & Juhasz, A. L. (2022) · Environmental Research · doi:10.1016/j.envres.2022.113431 · Cited by 292
Obesity II: Establishing causal links between chemical exposures and obesity
Heindel, J. J., Howard, S. G., Agay‐Shay, K., Arrebola, J. P., Audouze, K., Babin, P. J., Barouki, R., Bansal, A., Blanc, É., Cave, M. C., et al. (2022) · Biochemical Pharmacology · doi:10.1016/j.bcp.2022.115015 · Cited by 220
Chang, C.-J., Barr, D. B., Ryan, P. B., Panuwet, P., Smarr, M. M., Liu, K., Kannan, K., Yakimavets, V., Tan, Y., Ly, V. T., et al. (2021) · Environment International · doi:10.1016/j.envint.2021.106964 · Cited by 173
Fischer, F. C., Ludtke, S., Thackray, C. P., Pickard, H. M., Haque, F., Dassuncao, C., Endo, S., Schaider, L. A., & Sunderland, E. M. (2024) · Environmental Science & Technology · doi:10.1021/acs.est.3c07415 · Cited by 187
Metadata
- Authors
- Chen, Z., Yang, T., Walker, D. I., Thomas, D. C., Qiu, C., Chatzi, L., Alderete, T. L., Kim, J. S., Conti, D. V., Breton, C. V., Liang, D., Hauser, E. R., Jones, D. P., & Gilliland, F. D.
- Affiliations
- University of Southern California (US)
- Icahn School of Medicine at Mount Sinai (US)
- University of Colorado Boulder (US)
- Emory University (US)
- Duke University (US)
- Corresponding author
- Chen, Zhanghua
- ORCID
- Venue
- Environment International
- Publisher
- Elsevier BV
- Published
- 2020-12
- Volume
- 145
- Pages
- 106091
- ISSN
- 0160-4120 (ISSN-L)
- PMC
- PMC8009052
- OpenAlex
- W3083268731
- Cited by
- 176
- References
- 47
- Citations by year
- 2026: 25 · 2025: 39 · 2024: 33 · 2023: 33 · 2022: 27 · 2021: 18 · 2020: 1
- FWCI
- 7.29
- Type
- journal article
- Language
- en
- Open access
- gold
- doi.org
- Licence
- Locations
- Environment International (publishedVersion, cc-by-nc-nd)
- PubMed (publishedVersion)
- PubMed Central (acceptedVersion, cc-by-nc-nd)
- DOAJ (DOAJ: Directory of Open Access Journals) (submittedVersion, cc-by-sa)
- Funders
- National Institute of Environmental Health Sciences
- U.S. Environmental Protection Agency
- Topics
- Physical Sciences › Environmental Science › Environmental Chemistry › Per- and polyfluoroalkyl substances research
- Life Sciences › Biochemistry, Genetics and Molecular Biology › Molecular Biology › Metabolomics and Mass Spectrometry Studies
- Life Sciences › Biochemistry, Genetics and Molecular Biology › Molecular Biology › Peroxisome Proliferator-Activated Receptors
- Keywords
- per- and polyfluoroalkyl substances, PFAS exposure, perfluorooctanoic acid, impaired glucose metabolism, lipid metabolism, fatty acid metabolism, glycerol, lipolysis, fatty acid oxidation, cardiometabolic risk, young adults, obesity, oral glucose tolerance test, plasma metabolome
- MeSH terms
- Bayes Theorem, Environmental Pollutants, Fatty Acids, Fluorocarbons, Glucose, Humans, Lipids, Alkanesulfonic Acids, Lipid Metabolism, Young Adult
About these checks
Registry, retraction, Cites and statistics results are computed, not judged, with one exception: a printed reference that no index lists is read once by a model before it counts as a citation error. Claims are extracted by a model and kept only when their quote appears verbatim in the text; each cited source is then checked, with a model’s help, for whether it says what the claim relies on. Those verdicts can be wrong — read the claim’s quote and the cited source before relying on one.
Statistics and arithmetic are recomputed, not judged.
Confidence bands are shown only for fields calibrated on our annotated test set. None is calibrated yet, so no band is shown.
What counts as a claim ›How we measure confidence ›How we check this ›
Are you an author, or do you see a problem with this page? Request a review
