

The DOI matches its Crossref record; 1 of the 1 references it cites were found in a registry or an index.
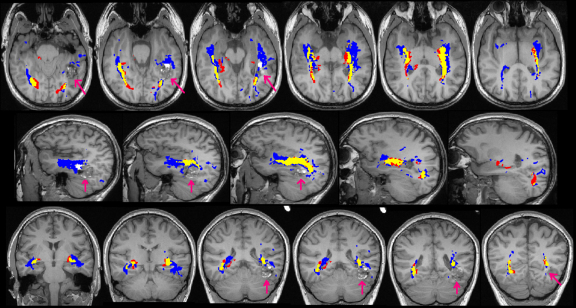
Diffusion tensor imaging tractography of the optic radiation for epilepsy surgical planning: A comparison of two methods
Overview
The claims and statistics of this paper haven’t been checked yet.
Run the check — free, no account needed. It reads the open-access text and checks the sources it cites.
Integrity signals
Registry
Cites
Statistics
Figures
Verification
Claims the paper makes
The claims and statistics of this paper haven’t been checked yet.
Run the check — free, no account needed. It reads the open-access text and checks the sources it cites.
Claims other papers make about this one
Each is checked against this paper’s own text: does it say what the citing paper says it does?
In the citing paper
“Advantages of probabilistic tractography, which was used in this study, include greater robustness to noise, as well as the ability to detect pathways with sharper angles and to distinguish crossing fibers (Behrens et al., 2007; Winston et al., 2011).”
From The Ascending Reticular Activating System from Pontine Reticular Formation to the Thalamus in the Human Brain (2013) · cites this paper as Winston et al., 2011
Self-check
Percentages, sums and reported differences re-computed from the paper’s own numbers.
The self-check needs the paper’s full text.
Citations
Cites
Non-invasive mapping of connections between human thalamus and cortex using diffusion imaging
Behrens, T. E. J., Johansen-Berg, H., Woolrich, M. W., Smith, S. M., Wheeler-Kingshott, C. A. M., Boulby, P. A., Barker, G. J., Sillery, E. L., Sheehan, K., Ciccarelli, O., et al. (2003) · Nature Neuroscience · doi:10.1038/nn1075 · Cited by 2,330
Research works printed but not linked: 28
- Alexander, 2002, Detection and modeling of non-Gaussian apparent diffusion coefficient profiles in human brain data, Magn. Reson. Med., 48, 331, 10.1002/mrm.10209 · DOI
- Barton, 2005, The field defects of anterior temporal lobectomy: a quantitative reassessment of Meyer's loop, Brain, 128, 2123, 10.1093/brain/awh544 · DOI
- Basser, 1995, Inferring microstructural features and the physiological state of tissues from diffusion-weighted images, NMR Biomed., 8, 333, 10.1002/nbm.1940080707 · DOI
- Catani, 2003, Occipito-temporal connections in the human brain, Brain, 126, 2093, 10.1093/brain/awg203 · DOI
- Chen, 2009, Prediction of visual field deficits by diffusion tensor imaging in temporal lobe epilepsy surgery, Neuroimage, 45, 286, 10.1016/j.neuroimage.2008.11.038 · DOI
- Ciccarelli, 2003, From diffusion tractography to quantitative white matter tract measures: a reproducibility study, Neuroimage, 18, 348, 10.1016/S1053-8119(02)00042-3 · DOI · Paper page
- Clatworthy, 2010, Probabilistic tractography of the optic radiations – an automated method and anatomical validation, Neuroimage, 49, 2001, 10.1016/j.neuroimage.2009.10.083 · DOI
- Cook, 2004, Modelling noise-induced fibre-orientation error in diffusion-tensor MRI, IEEE Int. Symp. Biomed. Imaging, 32
- Cook, 2007, Optimal acquisition orders of diffusion-weighted MRI measurements, J. Magn. Reson. Imaging, 25, 1051, 10.1002/jmri.20905 · DOI
- Ebeling, 1988, Neurosurgical topography of the optic radiation in the temporal lobe, Acta Neurochir. (Wien), 92, 29, 10.1007/BF01401969 · DOI
- Hofer, 2010, Reconstruction and dissection of the entire human visual pathway using diffusion tensor MRI, Front. Neuroanat., 4, 15
- Manji, 2000, Epilepsy surgery, visual fields, and driving: a study of the visual field criteria for driving in patients after temporal lobe epilepsy surgery with a comparison of Goldmann and Esterman perimetry, J. Neurol. Neurosurg. Psychiatry, 68, 80, 10.1136/jnnp.68.1.80 · DOI
- Meyer, 1907, The connections of the occipital lobes and the present state of the cerebral visual affections, Trans. Ass. Am. Phys., 22, 7
- Mori, 2002, Fiber tracking: principles and strategies – a technical review, NMR Biomed., 15, 468, 10.1002/nbm.781 · DOI
- Nilsson, 2004, Visual field defects after temporal lobectomy – comparing methods and analysing resection size, Acta Neurol. Scand., 110, 301, 10.1111/j.1600-0404.2004.00331.x · DOI
- Nilsson, 2010, Anatomical accuracy and feasibility of probabilistic and determinstic tractography of the optic radiation. 9th European Congress on Epileptology: Rhodes, Epilepsia, 51, 91
- Parker, 2003, Probabilistic Monte Carlo based mapping of cerebral connections utilising whole-brain crossing fibre information, Inf. Process. Med. Imaging, 18, 684
- Parker, 2003, A framework for a streamline-based probabilistic index of connectivity (PICo) using a structural interpretation of MRI diffusion measurements, J. Magn. Reson. Imaging, 18, 242, 10.1002/jmri.10350 · DOI · Paper page
- Powell, 2005, MR tractography predicts visual field defects following temporal lobe resection, Neurology, 65, 596, 10.1212/01.wnl.0000172858.20354.73 · DOI
- Romano, 2009, Pre-surgical planning and MR-tractography utility in brain tumour resection, Eur. Radiol., 19, 2798, 10.1007/s00330-009-1483-6 · DOI
- Sherbondy, 2008, Identifying the human optic radiation using diffusion imaging and fiber tractography, J. Vis., 8, 11, 10.1167/8.10.12 · DOI
- Smith, 2004, Advances in functional and structural MR image analysis and implementation as FSL, Neuroimage, 23, S208, 10.1016/j.neuroimage.2004.07.051 · DOI · Paper page
- Wheeler-Kingshott, 2002, Investigating cervical spinal cord structure using axial diffusion tensor imaging, Neuroimage, 16, 93, 10.1006/nimg.2001.1022 · DOI
- Wiebe, 2001, A randomized, controlled trial of surgery for temporal-lobe epilepsy, N. Engl. J. Med., 345, 311, 10.1056/NEJM200108023450501 · DOI
- Winston, 2011, Diffusion tensor imaging tractography to visualise the relationship of the optic radiation to epileptogenic lesions prior to neurosurgery, Epilepsia, 52, 1430, 10.1111/j.1528-1167.2011.03088.x · DOI
- Yamamoto, 2007, Diffusion tensor fiber tractography of the optic radiation: analysis with 6-, 12-, 40-, and 81-directional motion-probing gradients, a preliminary study, AJNR Am. J. Neuroradiol., 28, 92
- Yamamoto, 2005, Tractography to depict three layers of visual field trajectories to the calcarine gyri, Am. J. Ophthalmol., 140, 781, 10.1016/j.ajo.2005.05.018 · DOI
- Yogarajah, 2009, Defining Meyer's loop-temporal lobe resections, visual field deficits and diffusion tensor tractography, Brain, 132, 1656, 10.1093/brain/awp114 · DOI
Cited by
Sorted by citations
Yeo, S. S., Chang, P. H., & Jang, S. H. (2013) · Frontiers in Human Neuroscience · doi:10.3389/fnhum.2013.00416 · Cited by 162
Metadata
- Authors
- Winston, G. P., Mancini, L., Stretton, J., Ashmore, J., Symms, M. R., Duncan, J. S., & Yousry, T. A.
- Venue
- Epilepsy Research
- Publisher
- Elsevier BV
- Published
- 2011-11
- Volume
- 97
- Issue
- 1-2
- Pages
- 124-132
- ISSN
- 0920-1211
- PMC
- PMC3223565
- Cited by
- 32
- References
- 1
- Language
- en
- Licence
- Funders
- Wellcome Trust Programme
About these checks
Registry, retraction, Cites and statistics results are computed, not judged, with one exception: a printed reference that no index lists is read once by a model before it counts as a citation error. Claims are extracted by a model and kept only when their quote appears verbatim in the text; each cited source is then checked, with a model’s help, for whether it says what the claim relies on. Those verdicts can be wrong — read the claim’s quote and the cited source before relying on one.
Statistics and arithmetic are recomputed, not judged.
Confidence bands are shown only for fields calibrated on our annotated test set. None is calibrated yet, so no band is shown.
What counts as a claim ›How we measure confidence ›How we check this ›
Are you an author, or do you see a problem with this page? Request a review
