Cited by 35

The DOI matches its Crossref record; 2 of the 2 references it cites were found in a registry or an index.

Spontaneous recurrent seizures in an intra-amygdala kainate microinjection model of temporal lobe epilepsy are differentially sensitive to antiseizure drugs

West, Peter J., Thomson, Kyle, Billingsley, Peggy, Pruess, Timothy, Rueda, Carlos, Saunders, Gerald W., Smith, Misty D., Metcalf, Cameron S., Wilcox, Karen S.·2022·Experimental Neurology

Published version of a preprint

Overview

The claims and statistics of this paper haven’t been checked yet.

Run the check — free, no account needed. It reads the open-access text and checks the sources it cites.

A few free checks a day · papers already verified open instantly · results are public

Integrity signals

Registry

Crossref · 10.1016/j.expneurol.2021.113954

Cites

2 of 2 references verified0 citation errors · 0 not checkable

Statistics

Figures

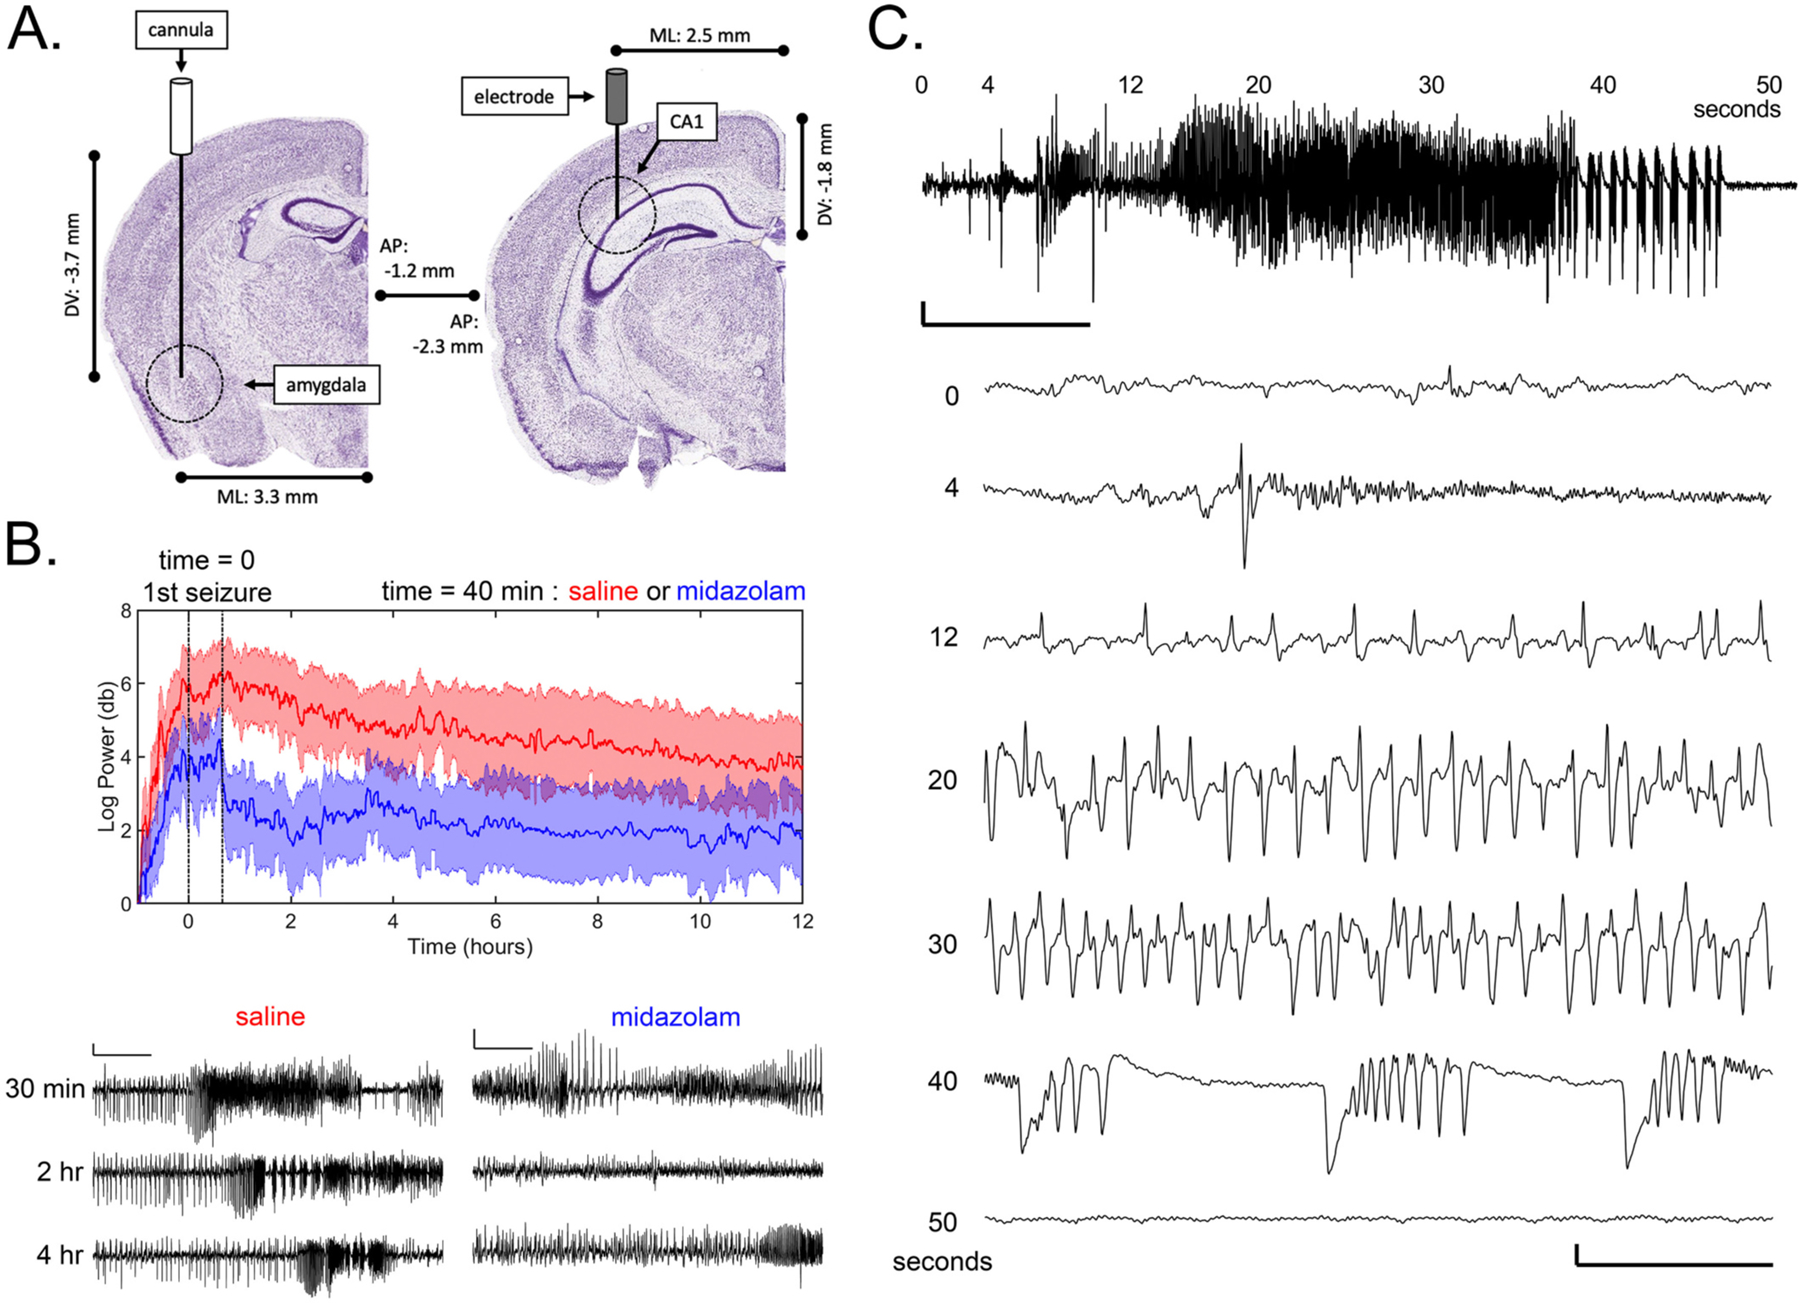
Fig. 1. Microinjection of kainic acid (KA) into the mouse amygdala induces status epilepticus (SE) and the subsequent development of spontaneous recurrent seizures (SRS). A) Schematic showing coordinates for injection cannula and CA1 electrode implantation sites. Anatomic reference images courtesy of the Allen Mouse Brain Atlas (Lein et al., 2007). B) Gamma-band power resulting from microinjection of KA for mice given midazolam (N = 9, Blue) or saline (N = 9, Red) 40 min after detection of their first seizure. All mice EEG recordings were aligned to time = 0 when their first seizures were detected and time = 40 min when either 8 mg/kg midazolam or saline was administered. Data are represented by the mean (solid lines) and SEM (shaded area) for the Log10 of gamma frequency power (db). One-minute-long representative EEG traces for a saline-treated (left) and midazolam-treated (right) IAK mouse are shown below. Relative to time zero, traces were captured at 30 min (before saline or midazolam treatment), 2 h (approximate time of largest midazolam effect), and 4 h (after recovery from midazolam). Note the attenuation (at 2 h) and recovery (at 4 h) of large amplitude EEG spikes in the midazolam group. Scale bar represents 2 mV and 10 s. C) Representative EEG seizure recorded from an IAK mouse with an ipsilateral CA1 hippocampal depth electrode during a Racine stage 4–5 behavioral seizure. Scale bar represents 2 mV and 10 s. Time points (seconds) above the trace correspond to the expanded traces below (total duration = 2 s; bottom scale bar represents 2 mV and 0.5 s). Similar to EEG waveforms documented in other seizure models (e.g. see (Williams et al., 2009)), seizure initiation begins with a large EEG spike (4 s), followed by progressive high amplitude high frequency EEG spikes (12, 20, and 30 s), large amplitude waves containing multiple EEG spikes (40 s), and finally post-ictal depression (50 s).
Fig. 1. Microinjection of kainic acid (KA) into the mouse amygdala induces status epilepticus (SE) and the subsequent development of spontaneous recurrent seizures (SRS). A) Schematic showing coordinates for injection cannula and CA1 electrode implantation sites. Anatomic reference images courtesy of the Allen Mouse Brain Atlas (Lein et al., 2007). B) Gamma-band power resulting from microinjection of KA for mice given midazolam (N = 9, Blue) or saline (N = 9, Red) 40 min after detection of their first seizure. All mice EEG recordings were aligned to time = 0 when their first seizures were detected and time = 40 min when either 8 mg/kg midazolam or saline was administered. Data are represented by the mean (solid lines) and SEM (shaded area) for the Log10 of gamma frequency power (db). One-minute-long representative EEG traces for a saline-treated (left) and midazolam-treated (right) IAK mouse are shown below. Relative to time zero, traces were captured at 30 min (before saline or midazolam treatment), 2 h (approximate time of largest midazolam effect), and 4 h (after recovery from midazolam). Note the attenuation (at 2 h) and recovery (at 4 h) of large amplitude EEG spikes in the midazolam group. Scale bar represents 2 mV and 10 s. C) Representative EEG seizure recorded from an IAK mouse with an ipsilateral CA1 hippocampal depth electrode during a Racine stage 4–5 behavioral seizure. Scale bar represents 2 mV and 10 s. Time points (seconds) above the trace correspond to the expanded traces below (total duration = 2 s; bottom scale bar represents 2 mV and 0.5 s). Similar to EEG waveforms documented in other seizure models (e.g. see (Williams et al., 2009)), seizure initiation begins with a large EEG spike (4 s), followed by progressive high amplitude high frequency EEG spikes (12, 20, and 30 s), large amplitude waves containing multiple EEG spikes (40 s), and finally post-ictal depression (50 s).CC BY-NC-ND · PubMed Central
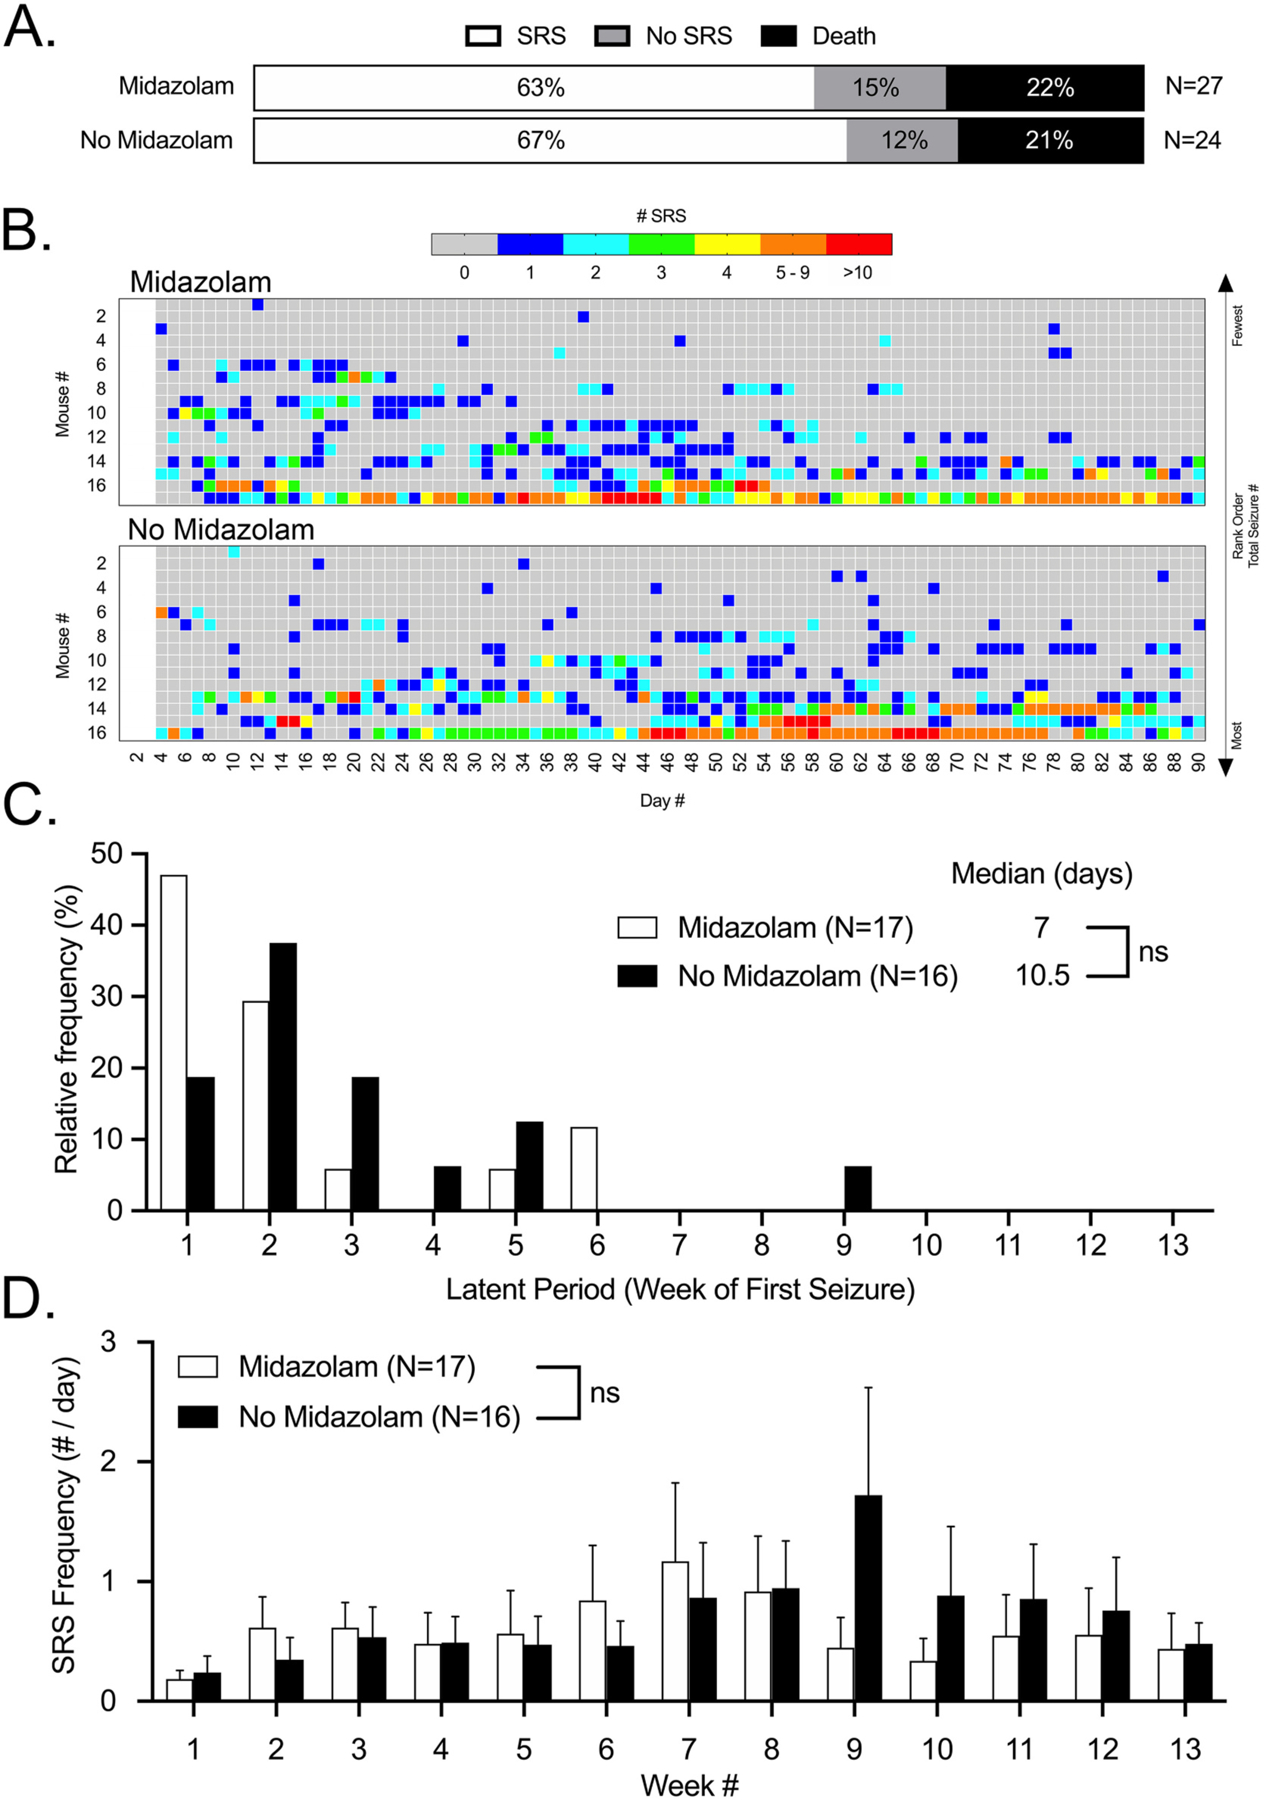
Fig. 2. Midazolam treatment during SE does not significantly affect survival or the development of epilepsy in IAK mice. A) Percentages of those animals developing spontaneous recurrent seizures (SRS), not developing SRS, and died in a cohort of mice that received 8 mg/kg midazolam 40 min after initiation of SE and another cohort of mice that did not receive midazolam. B) Heatmaps depicting the daily number of SRSs experienced by each mouse in both cohorts over a 90-day video-EEG observation period. From top to bottom, mice were rank ordered by the total number of SRSs experienced over 90 days from lowest to highest respectively. Note: video EEG was not recorded for the first 3 days after SE. C) Relative frequency distributions for latent periods and group medians. Open bars represent midazolam treated mice and closed bars represent mice whose SE was uninterrupted. Median latent periods were not significantly different (ns, Mann-Whitney test). D) Weekly averages for SRS daily frequencies over the 90-day natural history observation period. Open bars represent midazolam treated mice and closed bars represent mice whose SE was uninterrupted. There were no significant differences in seizure frequency between these cohorts over the entire period (ns, two-way repeated-measures ANOVA).
Fig. 2. Midazolam treatment during SE does not significantly affect survival or the development of epilepsy in IAK mice. A) Percentages of those animals developing spontaneous recurrent seizures (SRS), not developing SRS, and died in a cohort of mice that received 8 mg/kg midazolam 40 min after initiation of SE and another cohort of mice that did not receive midazolam. B) Heatmaps depicting the daily number of SRSs experienced by each mouse in both cohorts over a 90-day video-EEG observation period. From top to bottom, mice were rank ordered by the total number of SRSs experienced over 90 days from lowest to highest respectively. Note: video EEG was not recorded for the first 3 days after SE. C) Relative frequency distributions for latent periods and group medians. Open bars represent midazolam treated mice and closed bars represent mice whose SE was uninterrupted. Median latent periods were not significantly different (ns, Mann-Whitney test). D) Weekly averages for SRS daily frequencies over the 90-day natural history observation period. Open bars represent midazolam treated mice and closed bars represent mice whose SE was uninterrupted. There were no significant differences in seizure frequency between these cohorts over the entire period (ns, two-way repeated-measures ANOVA).CC BY-NC-ND · PubMed Central
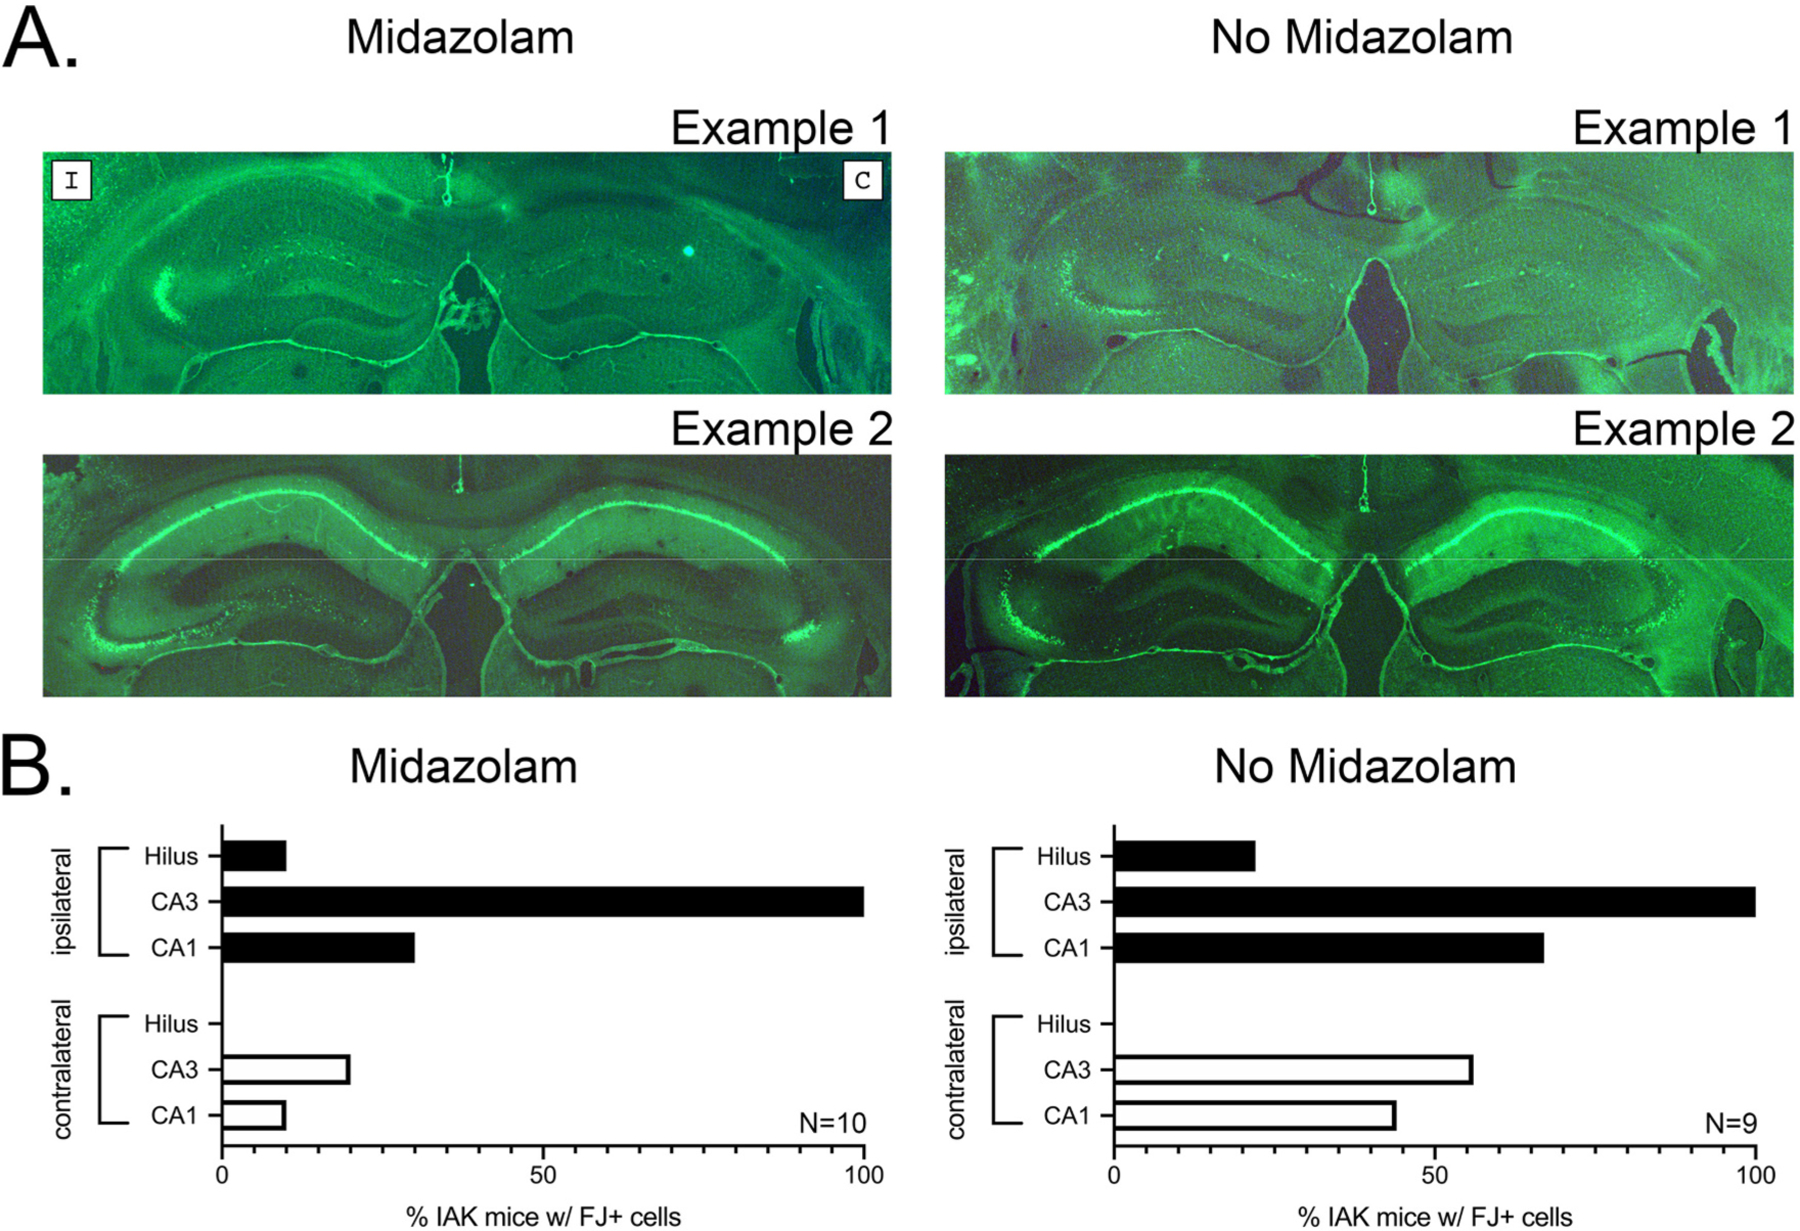
Fig. 3. Midazolam treatment during SE does not significantly affect hippocampal damage 48 h after SE. A) Representative photomicrographs of FluoroJade-B stained neurons in the dorsal hippocampi of midazolam-treated (Left) and non-treated (Right) IAK mice. As depicted in Example 1 of the Midazolam images, the left hemisphere is ipsilateral “I” to the site of KA injection, and the right hemisphere is contralateral “C”; this orientation applies to all images. In both midazolam and no midazolam images, Example 1 represents isolated ipsilateral CA3 damage and Example 2 represents extensive ipsilateral and contralateral damage. B) Quantified percentages of mice with FluoroJade-B positive cells in each subdivision of the ipsilateral and contralateral dorsal hippocampus reveals no significant differences between midazolam-treated and non-treated groups. In both graphs, solid bars represent ipsilateral percentages and open bars represent contralateral percentages.
Fig. 3. Midazolam treatment during SE does not significantly affect hippocampal damage 48 h after SE. A) Representative photomicrographs of FluoroJade-B stained neurons in the dorsal hippocampi of midazolam-treated (Left) and non-treated (Right) IAK mice. As depicted in Example 1 of the Midazolam images, the left hemisphere is ipsilateral “I” to the site of KA injection, and the right hemisphere is contralateral “C”; this orientation applies to all images. In both midazolam and no midazolam images, Example 1 represents isolated ipsilateral CA3 damage and Example 2 represents extensive ipsilateral and contralateral damage. B) Quantified percentages of mice with FluoroJade-B positive cells in each subdivision of the ipsilateral and contralateral dorsal hippocampus reveals no significant differences between midazolam-treated and non-treated groups. In both graphs, solid bars represent ipsilateral percentages and open bars represent contralateral percentages.CC BY-NC-ND · PubMed Central
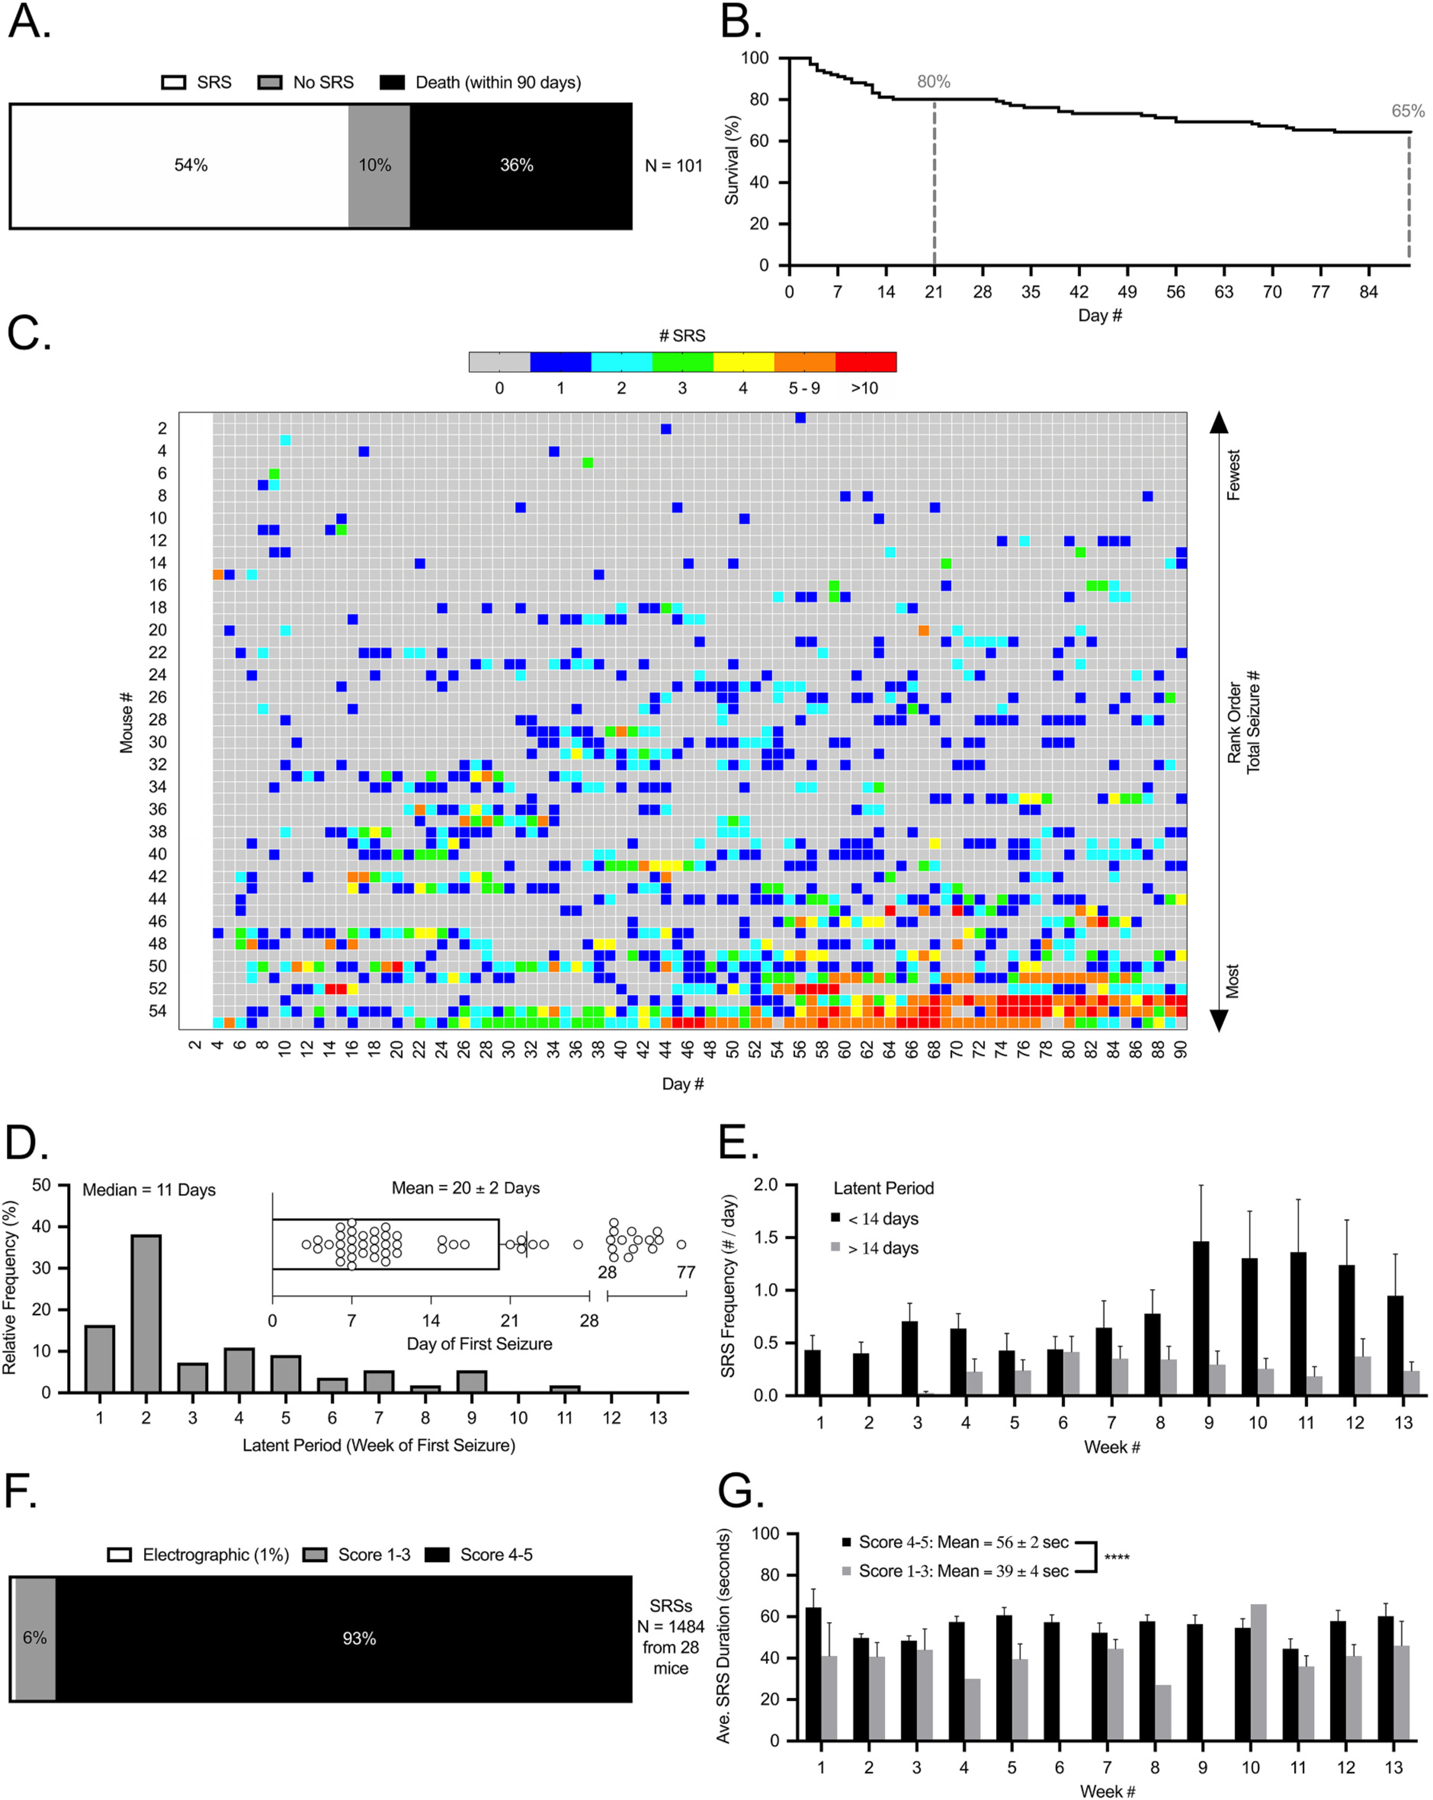
Fig. 4. Natural history and characterization of SRSs in this IAK microinjection model of MTLE. A) Percentages of SRS, no SRS, and death for a cohort of 101 IAK mice. B) Survival curve for the 36 mice that died at varying times over the course of the 90-day observation period. Dashed lines highlight 80% survival at 21 days and 65% survival at 90 days. C) Heatmaps depicting the daily number of SRSs experience by each mouse over the 90-day video-EEG observation period. From top to bottom, mice were rank ordered by the total number of SRSs experienced over 90 days from lowest to highest respectively. Note: video EEG was not recorded for the first 3 days after SE. D) Relative frequency distribution of latent periods for all mice in this study. Median latent period was 11 days (Mean latent period was 20 ± 2 days). E) Weekly averages for SRS daily frequencies over the 90-day natural history observation period. Solid bars represent 30 mice whose latent period was < 14 days, and gray bars represent 25 mice whose latent periods were > 14 days. F) Percentages of SRSs that were accompanied by Racine score 4–5 behavioral seizures (93%), score 1–3 behavioral seizures (6%), or without obvious behaviors (1%). G) Weekly averages for SRS durations over the 90-day observation period. Solid bars represent seizure durations for score 4–5 behavioral seizures, and gray bars represent seizure durations for score 1–3 behavioral seizures. For panels F and G, a subset of 1484 SRSs were analyzed from a total of 28 mice.
Fig. 4. Natural history and characterization of SRSs in this IAK microinjection model of MTLE. A) Percentages of SRS, no SRS, and death for a cohort of 101 IAK mice. B) Survival curve for the 36 mice that died at varying times over the course of the 90-day observation period. Dashed lines highlight 80% survival at 21 days and 65% survival at 90 days. C) Heatmaps depicting the daily number of SRSs experience by each mouse over the 90-day video-EEG observation period. From top to bottom, mice were rank ordered by the total number of SRSs experienced over 90 days from lowest to highest respectively. Note: video EEG was not recorded for the first 3 days after SE. D) Relative frequency distribution of latent periods for all mice in this study. Median latent period was 11 days (Mean latent period was 20 ± 2 days). E) Weekly averages for SRS daily frequencies over the 90-day natural history observation period. Solid bars represent 30 mice whose latent period was < 14 days, and gray bars represent 25 mice whose latent periods were > 14 days. F) Percentages of SRSs that were accompanied by Racine score 4–5 behavioral seizures (93%), score 1–3 behavioral seizures (6%), or without obvious behaviors (1%). G) Weekly averages for SRS durations over the 90-day observation period. Solid bars represent seizure durations for score 4–5 behavioral seizures, and gray bars represent seizure durations for score 1–3 behavioral seizures. For panels F and G, a subset of 1484 SRSs were analyzed from a total of 28 mice.CC BY-NC-ND · PubMed Central
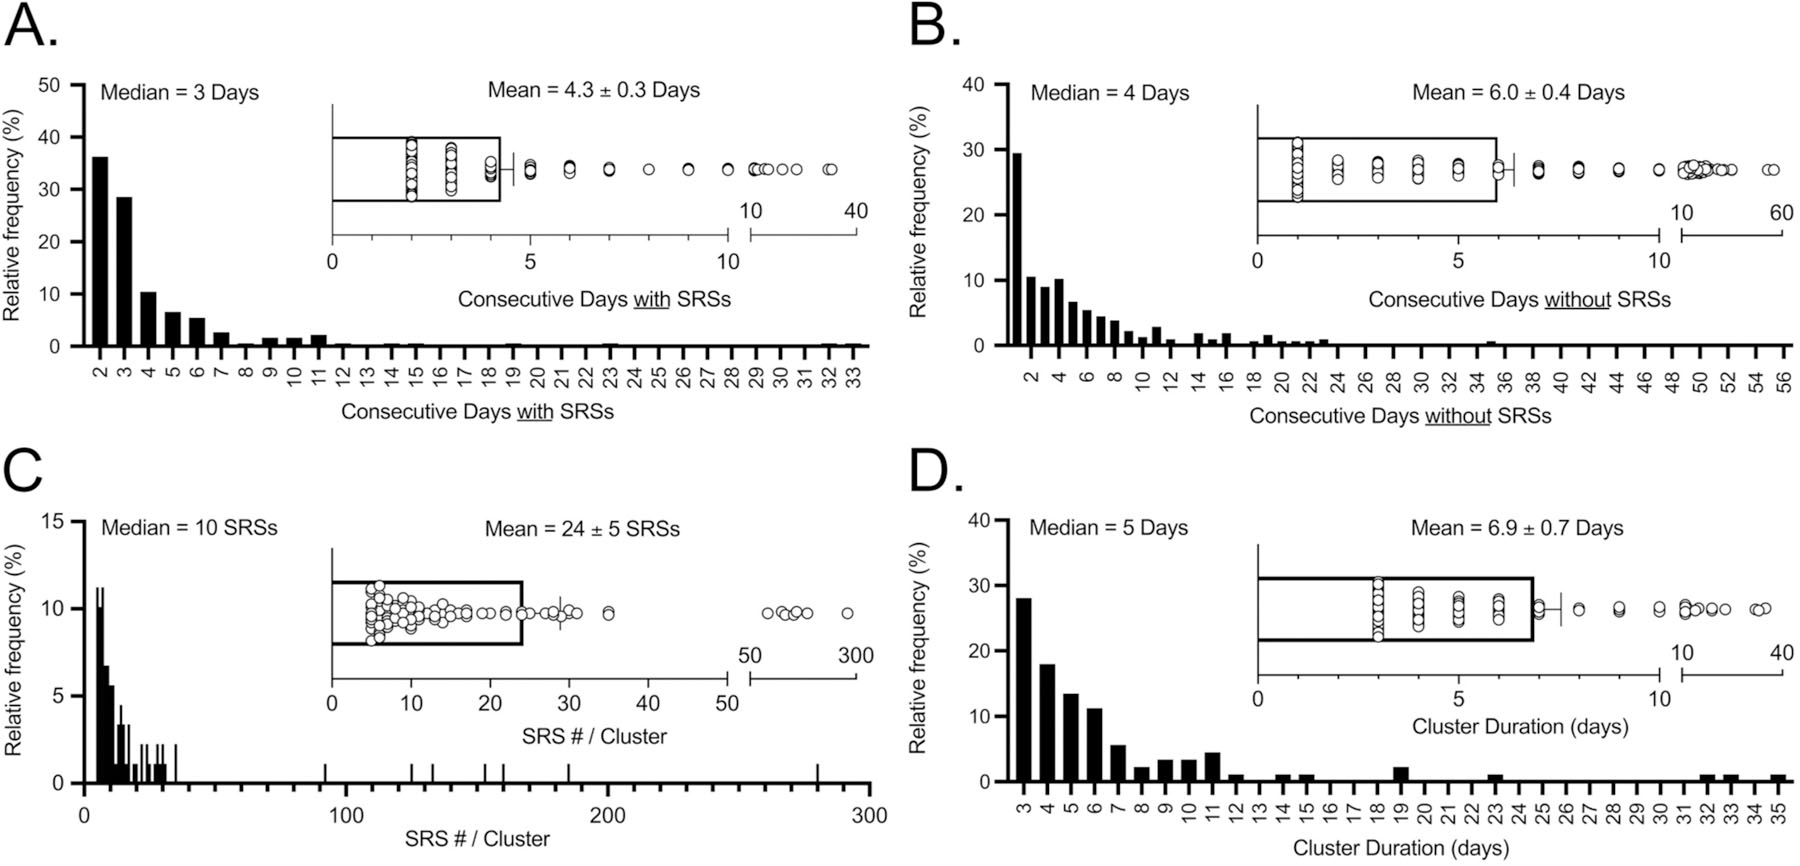
Fig. 5. Natural history and characterization of SRS clusters in this IAK microinjection model of MTLE. A) Relative frequency distribution of the number of consecutive days IAK mice experienced SRSs. Median was 3 days. Inset bar graph represents mean (4.3 ± 0.3 days) of this distribution and individual consecutive day events. B) Relative frequency distribution of the number of consecutive days IAK mice did not experienced SRSs. Median was 4 days. Inset bar graph represents mean (6.0 ± 0.4 days) of this distribution and individual consecutive day zero-SRSs periods. C) Relative frequency distribution of the total number of SRSs per seizure cluster. Median was 10 SRSs. Inset bar graph represents mean (24 ± 5 SRSs) of this distribution and individual SRS number per cluster. D) Relative frequency distribution of seizure cluster durations (days). Median was 5 days. Inset bar graph represents mean (6.9 ± 0.7 days) of this distribution and individual seizure cluster durations.
Fig. 5. Natural history and characterization of SRS clusters in this IAK microinjection model of MTLE. A) Relative frequency distribution of the number of consecutive days IAK mice experienced SRSs. Median was 3 days. Inset bar graph represents mean (4.3 ± 0.3 days) of this distribution and individual consecutive day events. B) Relative frequency distribution of the number of consecutive days IAK mice did not experienced SRSs. Median was 4 days. Inset bar graph represents mean (6.0 ± 0.4 days) of this distribution and individual consecutive day zero-SRSs periods. C) Relative frequency distribution of the total number of SRSs per seizure cluster. Median was 10 SRSs. Inset bar graph represents mean (24 ± 5 SRSs) of this distribution and individual SRS number per cluster. D) Relative frequency distribution of seizure cluster durations (days). Median was 5 days. Inset bar graph represents mean (6.9 ± 0.7 days) of this distribution and individual seizure cluster durations.CC BY-NC-ND · PubMed Central
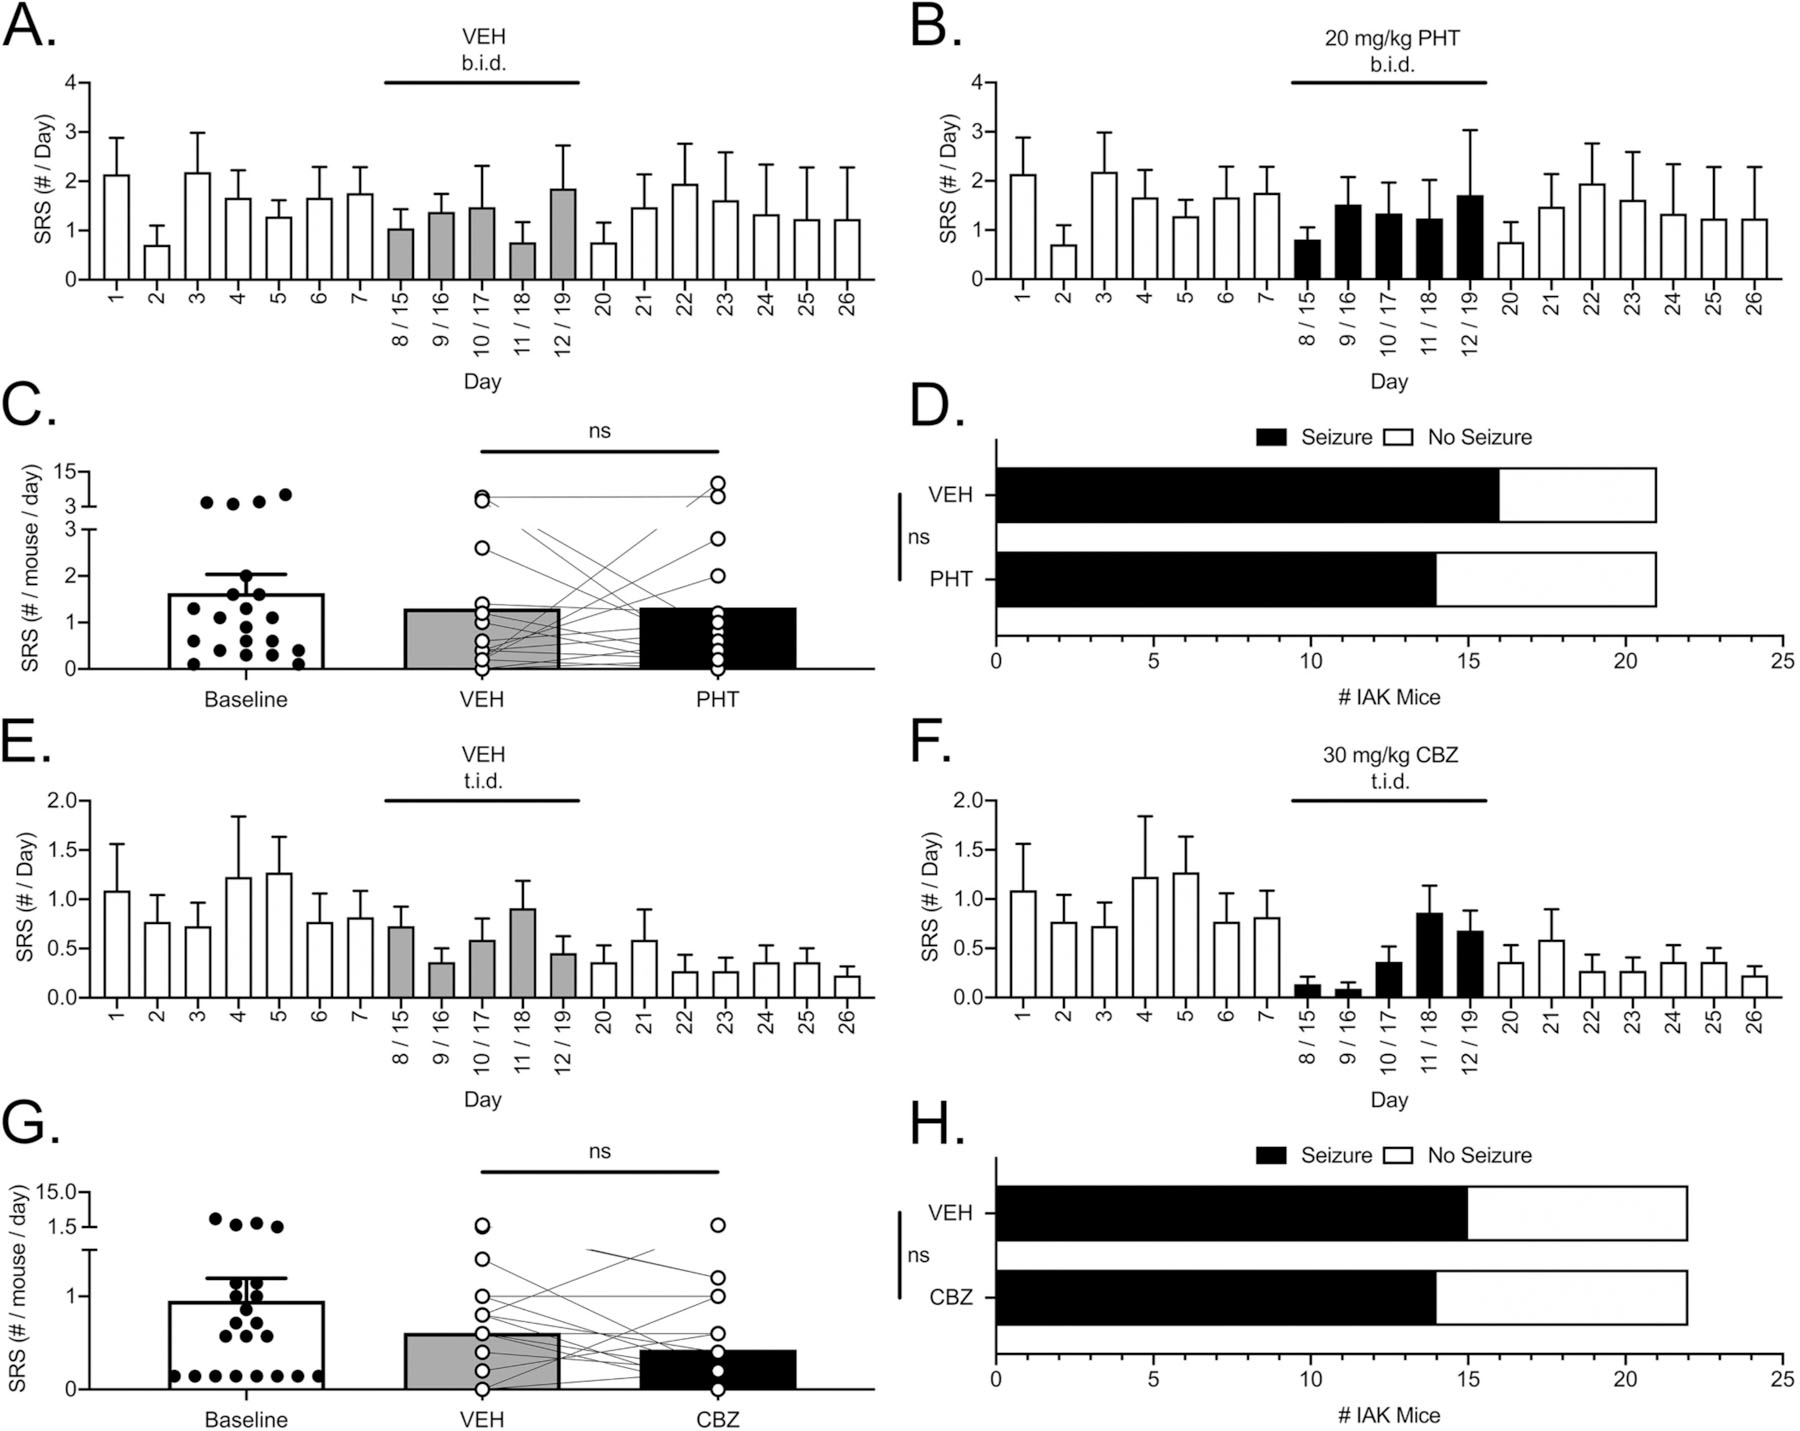
Fig. 6. SRSs in IAK mice are resistant to phenytoin (40 mg/kg/day) and carbamazepine (90 mg/kg/day). A-B and E-F) Daily average SRS frequencies over 26-day evaluation periods for vehicle (A: saline or E: methylcellulose) and (B) PHT or (F) CBZ treatments. In all panels, open bars represent baseline and washout periods, while gray bars represent vehicle treatment averages (VEH) and solid black bars represent PHT or CBZ treatment averages for both halves of the crossover. C and G) SRS frequency daily averages, and individual mouse data points, for baseline (open bar), vehicle (gray bar), and (C) PHT or (G) CBZ (black bar) treatments. Vehicle and PHT data were not significantly different (ns, Wilcoxon Test). Likewise, Vehicle and CBZ data were not significantly different (ns, Wilcoxon Test). D and H) Comparisons of the percentages of SRS-free mice during vehicle and (D) PHT or (H) CBZ treatments. Solid black bars represent percentages of mice that experienced SRS, and open white bars represent percentages of mice that were SRS-free, during each treatment period. Differences between vehicle and PHT groups were not significant (ns, Fisher’s Exact Test). Likewise, differences between vehicle and CBZ groups were not significant (ns, Fisher’s Exact Test).
Fig. 6. SRSs in IAK mice are resistant to phenytoin (40 mg/kg/day) and carbamazepine (90 mg/kg/day). A-B and E-F) Daily average SRS frequencies over 26-day evaluation periods for vehicle (A: saline or E: methylcellulose) and (B) PHT or (F) CBZ treatments. In all panels, open bars represent baseline and washout periods, while gray bars represent vehicle treatment averages (VEH) and solid black bars represent PHT or CBZ treatment averages for both halves of the crossover. C and G) SRS frequency daily averages, and individual mouse data points, for baseline (open bar), vehicle (gray bar), and (C) PHT or (G) CBZ (black bar) treatments. Vehicle and PHT data were not significantly different (ns, Wilcoxon Test). Likewise, Vehicle and CBZ data were not significantly different (ns, Wilcoxon Test). D and H) Comparisons of the percentages of SRS-free mice during vehicle and (D) PHT or (H) CBZ treatments. Solid black bars represent percentages of mice that experienced SRS, and open white bars represent percentages of mice that were SRS-free, during each treatment period. Differences between vehicle and PHT groups were not significant (ns, Fisher’s Exact Test). Likewise, differences between vehicle and CBZ groups were not significant (ns, Fisher’s Exact Test).CC BY-NC-ND · PubMed Central
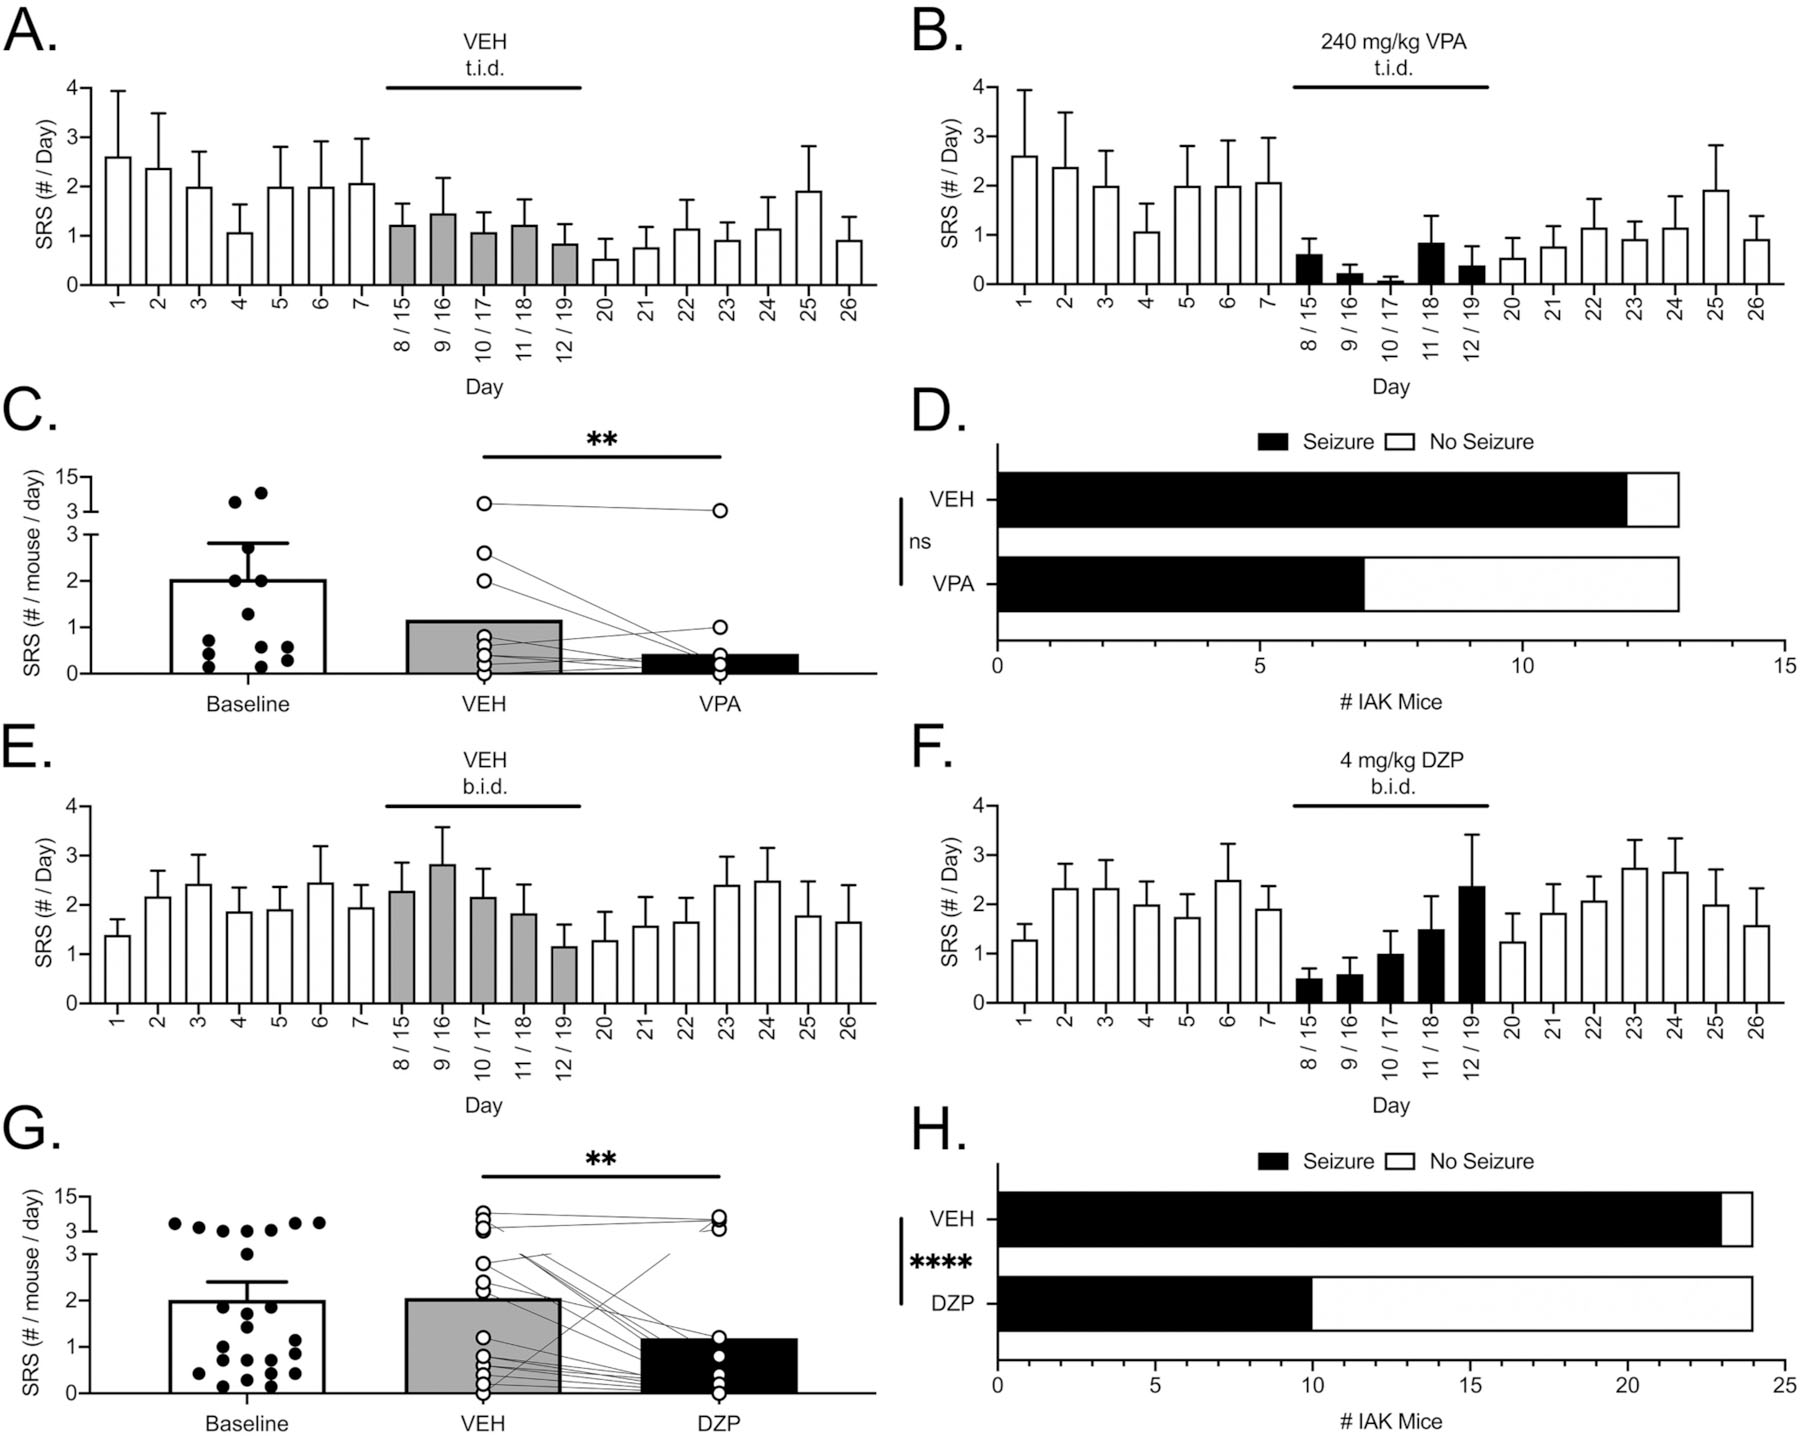
Fig. 7. SRSs in IAK mice are sensitive to valproic acid (VPA) (720 mg/kg/day) and diazepam (DZP) (8 mg/kg/day). A-B and E-F) Daily average SRS frequencies over 26-day evaluation periods for vehicle (A: saline and E: saline) and (B) VPA or (F) DZP treatments. In all panels, open bars represent baseline and washout periods, while gray bars represent vehicle treatment averages (VEH) and solid black bars represent VPA or DZP treatment averages for both halves of the crossover. C and G) SRS frequency daily averages, and individual mouse data points, for baseline (open bar), vehicle (gray bar), and (C) VPA or (G) DZP (black bar) treatments. Vehicle and VPA data were significantly different (**, Wilcoxon Test). Likewise, Vehicle and DZP data were significantly different (**, Wilcoxon Test). D and H) Comparisons of the percentages of SRS-free mice during vehicle and (D) VPA or (H) DZP treatments. Solid black bars represent percentages of mice that experienced SRS, and open white bars represent percentages of mice that were SRS-free, during each treatment period. Differences between vehicle and VPA groups were not significant (ns, Fisher’s Exact Test). However, differences between vehicle and DZP groups were significant (****, Fisher’s Exact Test).
Fig. 7. SRSs in IAK mice are sensitive to valproic acid (VPA) (720 mg/kg/day) and diazepam (DZP) (8 mg/kg/day). A-B and E-F) Daily average SRS frequencies over 26-day evaluation periods for vehicle (A: saline and E: saline) and (B) VPA or (F) DZP treatments. In all panels, open bars represent baseline and washout periods, while gray bars represent vehicle treatment averages (VEH) and solid black bars represent VPA or DZP treatment averages for both halves of the crossover. C and G) SRS frequency daily averages, and individual mouse data points, for baseline (open bar), vehicle (gray bar), and (C) VPA or (G) DZP (black bar) treatments. Vehicle and VPA data were significantly different (**, Wilcoxon Test). Likewise, Vehicle and DZP data were significantly different (**, Wilcoxon Test). D and H) Comparisons of the percentages of SRS-free mice during vehicle and (D) VPA or (H) DZP treatments. Solid black bars represent percentages of mice that experienced SRS, and open white bars represent percentages of mice that were SRS-free, during each treatment period. Differences between vehicle and VPA groups were not significant (ns, Fisher’s Exact Test). However, differences between vehicle and DZP groups were significant (****, Fisher’s Exact Test).CC BY-NC-ND · PubMed Central
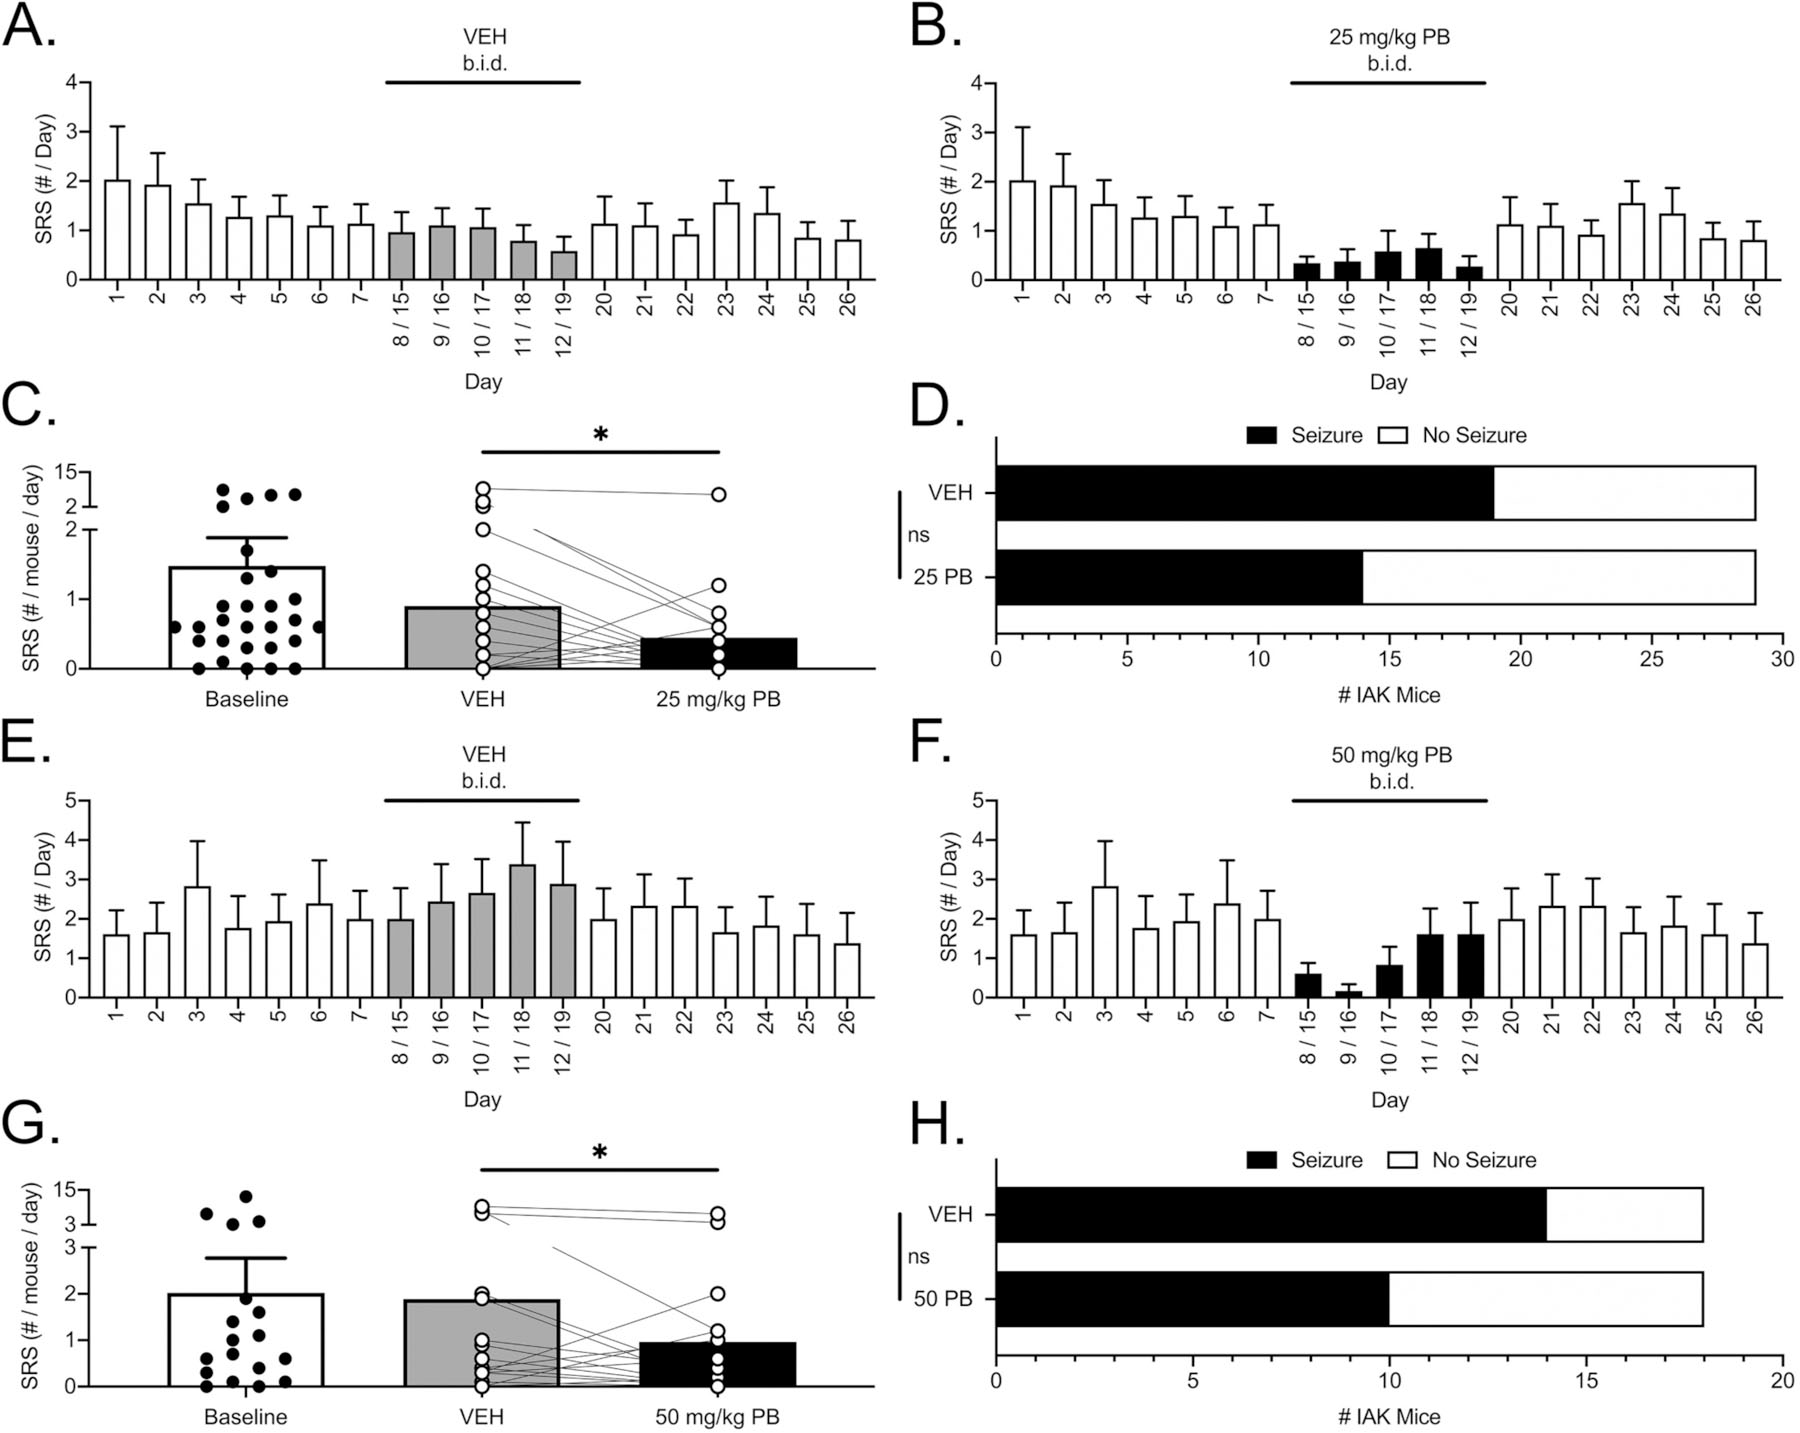
Fig. 8. SRSs in IAK mice are sensitive to phenobarbital (PB) (50 mg/kg/day and 100 mg/kg/day). A-B and E-F) Daily average SRS frequencies over 26-day evaluation periods for vehicle (A and E: saline) and (B) 25 mg/kg b.i.d. or (F) 50 mg/kg b.i.d. PB treatments. In all panels, open bars represent baseline and washout periods, while gray bars represent vehicle treatment averages (VEH), and solid black bars represent 25 or 50 mg/kg b.i.d. PB treatment averages for both halves of the crossover. C and G) SRS frequency daily averages, and individual mouse data points, for baseline (open bar), vehicle (gray bar), and (C) 25 mg/kg b.i.d. or (G) 50 mg/kg b.i.d. PB (black bar) treatments. For both doses, vehicle and PB data were significantly different (*, Wilcoxon Test). D and H) Comparisons of the percentages of SRS-free mice during vehicle and (D) 25 mg/kg b.i.d. or (H) 50 mg/kg b.i.d. PB treatments. Solid black bars represent percentages of mice that experienced SRS, and open white bars represent percentages of mice that were SRS-free, during each treatment period. Differences between vehicle and PB groups, for either dose, were not significant (ns, Fisher’s Exact Test).
Fig. 8. SRSs in IAK mice are sensitive to phenobarbital (PB) (50 mg/kg/day and 100 mg/kg/day). A-B and E-F) Daily average SRS frequencies over 26-day evaluation periods for vehicle (A and E: saline) and (B) 25 mg/kg b.i.d. or (F) 50 mg/kg b.i.d. PB treatments. In all panels, open bars represent baseline and washout periods, while gray bars represent vehicle treatment averages (VEH), and solid black bars represent 25 or 50 mg/kg b.i.d. PB treatment averages for both halves of the crossover. C and G) SRS frequency daily averages, and individual mouse data points, for baseline (open bar), vehicle (gray bar), and (C) 25 mg/kg b.i.d. or (G) 50 mg/kg b.i.d. PB (black bar) treatments. For both doses, vehicle and PB data were significantly different (*, Wilcoxon Test). D and H) Comparisons of the percentages of SRS-free mice during vehicle and (D) 25 mg/kg b.i.d. or (H) 50 mg/kg b.i.d. PB treatments. Solid black bars represent percentages of mice that experienced SRS, and open white bars represent percentages of mice that were SRS-free, during each treatment period. Differences between vehicle and PB groups, for either dose, were not significant (ns, Fisher’s Exact Test).CC BY-NC-ND · PubMed Central

Verification

Claims the paper makes

The claims and statistics of this paper haven’t been checked yet.

Run the check — free, no account needed. It reads the open-access text and checks the sources it cites.

A few free checks a day · papers already verified open instantly · results are public

Claims other papers make about this one

Each is checked against this paper’s own text: does it say what the citing paper says it does?

Self-check

Percentages, sums and reported differences re-computed from the paper’s own numbers.

The self-check needs the paper’s full text.

Citations

Cites

Show all 2 references

Research works printed but not linked: 47

  1. Araki, 2002, Characterization of neuronal death induced by focally evoked limbic seizures in the C57BL/6 mouse, J. Neurosci. Res., 69, 614, 10.1002/jnr.10356 · DOI
  2. Ben-Ari, 1979, A new model of focal status epilepticus: intra-amygdaloid application of kainic acid elicits repetitive secondarily generalized convulsive seizures, Brain Res., 163, 176, 10.1016/0006-8993(79)90163-X · DOI
  3. Ben-Ari, 1980, Injections of kainic acid into the amygdaloid complex of the rat: an electrographic, clinical and histological study in relation to the pathology of epilepsy, Neuroscience, 5, 515, 10.1016/0306-4522(80)90049-4 · DOI
  4. Bethmann, 2007, Resistance to phenobarbital extends to phenytoin in a rat model of temporal lobe epilepsy, Epilepsia, 48, 816, 10.1111/j.1528-1167.2007.00980.x · DOI
  5. Bortel, 2010, Convulsive status epilepticus duration as determinant for epileptogenesis and interictal discharge generation in the rat limbic system, Neurobiol. Dis., 40, 478, 10.1016/j.nbd.2010.07.015 · DOI
  6. Brandt, 2004, Striking differences in individual anticonvulsant response to phenobarbital in rats with spontaneous seizures after status epilepticus, Epilepsia, 45, 1488, 10.1111/j.0013-9580.2004.16904.x · DOI
  7. Diviney, 2015, Comparison of short-term effects of midazolam and lorazepam in the intra-amygdala kainic acid model of status epilepticus in mice, Epilepsy Behav. : E&B, 51, 191, 10.1016/j.yebeh.2015.07.038 · DOI
  8. Duveau, 2016, Differential effects of antiepileptic drugs on focal seizures in the Intrahippocampal Kainate mouse model of mesial temporal lobe epilepsy, CNS Neurosci. Therapeut., 22, 497, 10.1111/cns.12523 · DOI
  9. Engel, 2013, CHOP regulates the p53-MDM2 axis and is required for neuronal survival after seizures, Brain, 136, 577, 10.1093/brain/aws337 · DOI
  10. Faul, 2009, Statistical power analyses using G*Power 3.1: tests for correlation and regression analyses, Behav. Res. Methods, 41, 1149, 10.3758/BRM.41.4.1149 · DOI · Paper page
  11. Frigerio, 2018, N-3 Docosapentaenoic acid-derived protectin D1 promotes resolution of neuroinflammation and arrests epileptogenesis, Brain, 141, 3130
  12. Goffin, 2007, Cyclicity of spontaneous recurrent seizures in pilocarpine model of temporal lobe epilepsy in rat, Exp. Neurol., 205, 501, 10.1016/j.expneurol.2007.03.008 · DOI
  13. Goldstein, 2018, What’s in a (Sub)strain?, Stem Cell Rep, 11, 303, 10.1016/j.stemcr.2018.07.011 · DOI · Paper page
  14. Haut, 2006, Seizure clustering, Epilepsy Behav., 8, 50, 10.1016/j.yebeh.2005.08.018 · DOI
  15. Hosford, 2016, Ablation of newly generated hippocampal granule cells has disease-modifying effects in epilepsy, J. Neurosci., 36, 11013, 10.1523/JNEUROSCI.1371-16.2016 · DOI
  16. Iori, 2016, Blockade of the IL-1R1/TLR4 pathway mediates disease-modification therapeutic effects in a model of acquired epilepsy, Neurobiol. Dis., 99, 12, 10.1016/j.nbd.2016.12.007 · DOI · Paper page
  17. Jimenez-Pacheco, 2013, Increased neocortical expression of the P2X7 receptor after status epilepticus and anticonvulsant effect of P2X7 receptor antagonist A-438079, Epilepsia, 54, 1551, 10.1111/epi.12257 · DOI
  18. Jimenez-Pacheco, 2016, Transient P2X7 receptor antagonism produces lasting reductions in spontaneous seizures and gliosis in experimental temporal lobe epilepsy, J. Neurosci., 36, 5920, 10.1523/JNEUROSCI.4009-15.2016 · DOI
  19. Kang, 2019, C57BL/6J and C57BL/6N substrains differentially influence phenotype severity in the Scn1a+/− mouse model of Dravet syndrome, Epilepsia Open, 4, 164, 10.1002/epi4.12287 · DOI
  20. Kondratiuk, 2015, Epileptogenesis following kainic acid-induced status epilepticus in cyclin D2 knock-out mice with diminished adult neurogenesis, PLoS One, 10, 10.1371/journal.pone.0128285 · DOI
  21. Kwan, 2010, Definition of drug resistant epilepsy: consensus proposal by the ad hoc task force of the ILAE commission on therapeutic strategies, Epilepsia, 51, 1069, 10.1111/j.1528-1167.2009.02397.x · DOI
  22. Lehmkuhle, 2009, A simple quantitative method for analyzing electrographic status epilepticus in rats, J. Neurophysiol., 101, 1660, 10.1152/jn.91062.2008 · DOI
  23. Lein, 2007, Genome-wide atlas of gene expression in the adult mouse brain, Nature, 445, 168, 10.1038/nature05453 · DOI · Paper page
  24. Leite, 1995, Effects of conventional antiepileptic drugs in a model of spontaneous recurrent seizures in rats, Epilepsy Res., 20, 93, 10.1016/0920-1211(94)00070-D · DOI
  25. Li, 2008, Adenosine kinase is a target for the prediction and prevention of epileptogenesis in mice, J. Clin. Invest., 118, 571
  26. Lim, 2018, Clustering of spontaneous recurrent seizures separated by long seizure-free periods: an extended video-EEG monitoring study of a pilocarpine mouse model, PLoS One, 13, 10.1371/journal.pone.0194552 · DOI
  27. Long, 2016, 2014 Epilepsy benchmarks: progress and opportunities, Epilepsy Curr./ American Epilepsy Society, 16, 179, 10.5698/1535-7511-16.3.179 · DOI
  28. Löscher, 2006, Experimental and clinical evidence for loss of effect (tolerance) during prolonged treatment with antiepileptic drugs, Epilepsia, 47, 1253, 10.1111/j.1528-1167.2006.00607.x · DOI
  29. Löscher, 2017, The relevance of inter- and intrastrain differences in mice and rats and their implications for models of seizures and epilepsy, Epilepsy Behav., 73, 214, 10.1016/j.yebeh.2017.05.040 · DOI
  30. Mekada, 2021, Substrains matter in phenotyping of C57BL/6 mice, Exp Anim Tokyo, 70, 145, 10.1538/expanim.20-0158 · DOI
  31. Metcalf, 2017, Development and pharmacologic characterization of the rat 6 Hz model of partial seizures, Epilepsia, 58, 1073, 10.1111/epi.13764 · DOI
  32. Metcalf, 2019, Evaluation of antiseizure drug efficacy and tolerability in the rat lamotrigine-resistant amygdala kindling model, Epilepsia Open, 4, 452, 10.1002/epi4.12354 · DOI
  33. Mouri, 2008, Unilateral hippocampal CA3-predominant damage and short latency epileptogenesis after intra-amygdala microinjection of kainic acid in mice, Brain Res., 1213, 140, 10.1016/j.brainres.2008.03.061 · DOI · Paper page
  34. Pitkänen, 2005, Administration of diazepam during status epilepticus reduces development and severity of epilepsy in rat, Epilepsy Res., 63, 27, 10.1016/j.eplepsyres.2004.10.003 · DOI
  35. Sapia, 2021, CXCL1-CXCR1/2 signaling is induced in human temporal lobe epilepsy and contributes to seizures in a murine model of acquired epilepsy, Neurobiol. Dis., 158, 10.1016/j.nbd.2021.105468 · DOI
  36. Shinoda, 2004, Development of a model of seizure-induced hippocampal injury with features of programmed cell death in the BALB/c mouse, J. Neurosci. Res., 76, 121, 10.1002/jnr.20064 · DOI
  37. Silva, 2016, Distinct behavioral and epileptic phenotype differences in 129/P mice compared to C57BL/6 mice subject to intraamygdala kainic acid-induced status epilepticus, Epilepsy Behav. : E&B, 64, 186, 10.1016/j.yebeh.2016.09.031 · DOI
  38. Tang, 2017, Drug-resistant epilepsy: multiple hypotheses, few answers, Front. Neurol., 8, 301, 10.3389/fneur.2017.00301 · DOI
  39. Thomson, 2014, A novel open-source drug-delivery system that allows for first-of-kind simulation of nonadherence to pharmacological interventions in animal disease models, J. Neurosci. Methods, 238, 105, 10.1016/j.jneumeth.2014.09.019 · DOI
  40. Thomson, 2020, Evaluation of subchronic administration of antiseizure drugs in spontaneously seizing rats, Epilepsia, 61, 1301, 10.1111/epi.16531 · DOI
  41. Traynelis, 2020, Epilepsy benchmarks area III: improved treatment options for controlling seizures and epilepsy-related conditions without side effects, Epilepsy Curr, 20, 23S, 10.1177/1535759719895279 · DOI
  42. Welzel, 2020, A face-to-face comparison of the intra-amygdala and intrahippocampal kainate mouse models of mesial temporal lobe epilepsy and their utility for testing novel therapies, Epilepsia, 61, 157, 10.1111/epi.16406 · DOI
  43. West, 2014, Antiseizure drugs differentially modulate theta-burst induced long-term potentiation in C57BL/6 mice, Epilepsia, 55, 214, 10.1111/epi.12524 · DOI
  44. West, 2018, Recurrent epileptiform discharges in the medial entorhinal cortex of kainate-treated rats are differentially sensitive to antiseizure drugs, Epilepsia, 59, 2035, 10.1111/epi.14563 · DOI
  45. Wilcox, 2019, The current approach of the epilepsy therapy screening program contract site for identifying improved therapies for the treatment of pharmacoresistant seizures in epilepsy, Neuropharmacology, 166
  46. Williams, 2009, Development of spontaneous recurrent seizures after Kainate-induced status epilepticus, J. Neurosci., 29, 2103, 10.1523/JNEUROSCI.0980-08.2009 · DOI
  47. Wu, 2000, The tissue plasminogen activator (Tpa/plasmin) extracellular proteolytic system regulates seizure-induced hippocampal mossy fiber outgrowth through a proteoglycan substrate, J. Cell Biol., 148, 1295, 10.1083/jcb.148.6.1295 · DOI

Cited by

Sorted by citations

Metadata

Authors
West, P. J., Thomson, K., Billingsley, P., Pruess, T., Rueda, C., Saunders, G. W., Smith, M. D., Metcalf, C. S., & Wilcox, K. S.
Venue
Experimental Neurology
Publisher
Elsevier BV
Published
2022-03
Volume
349
Pages
113954
ISSN
0014-4886
Cited by
35
References
2
Language
en
Funders
NINDS

About these checks

Registry, retraction, Cites and statistics results are computed, not judged, with one exception: a printed reference that no index lists is read once by a model before it counts as a citation error. Claims are extracted by a model and kept only when their quote appears verbatim in the text; each cited source is then checked, with a model’s help, for whether it says what the claim relies on. Those verdicts can be wrong — read the claim’s quote and the cited source before relying on one.

Statistics and arithmetic are recomputed, not judged.

Confidence bands are shown only for fields calibrated on our annotated test set. None is calibrated yet, so no band is shown.

What counts as a claim ›How we measure confidence ›How we check this ›

Are you an author, or do you see a problem with this page? Request a review