

The DOI matches its Crossref record; 37 of the 39 references it cites were found in a registry or an index; 2 of the 17 sources its claims cite were checked for support.
The demographics of dog bites in the United States
Open accessAbstract
Dog bites are a significant public health issue. There is no comprehensive study of dog bite demographics. It was the purpose of this study to perform such an analysis across the US. The National Electronic Injury Surveillance System All Injury Program data for the years 2005 through 2013 was accessed; dog bite injuries were extracted and analyzed. Statistical analyses were performed with SUDAAN 11.0.01™ software to account for the weighted, stratified nature of the data. Incidence values were calculated using population data from the US Census Bureau. A P < 0.05 was considered significant. There was an average 337,103 ED visits each year for dog bites. The average age was 28.9 years; 52.6% were male and 47.4% female. The bites were located on the upper extremity in 47.3%, head/neck in 26.8%, lower extremity in 21.5%, and trunk in 4.4%. Younger patients had more bites involving the head/neck, while older patients the upper extremity. More occurred in the summer and on weekends and 80.2% occurred at home. Hospital admission occurred in 1.7%. Logistic regression analysis demonstrated that the odds of admission was solely dependent upon the age group. The OR for admission was 11.03 [4.68, 26.01] for those >85 years of age, 4.88 [2.89, 8.24] 75-84 years, and 2.79 [1.77, 4.39] those ≤4 years of age, with the 10-14 year age group the reference group. The average annual incidence was 1.1 per 1,000, and was slightly higher in males (1.18 vs 1.02 per 1,000). The estimated cost was at least 400 million US$ per year. Potential prevention strategies are educational programs directed at both children and parents/caretakers outlining the responsibilities of owning a dog. This information can be disseminated in health care facilities, radio/TV/Internet venues, and dog kennels/shelters.
Overview
AI snapshot
Written from the paper’s full text.
TL;DR
This study analyzed US emergency department visits for non-fatal dog bites from 2005–2013 using NEISS-AIP data, estimating about 337,103 ED visits per year and an annual incidence of 1.1 per 1,000. Bites were most common on the upper extremity, occurred mostly at home, and hospital admission was rare but strongly associated with age group.
Key findings
- Dog bites accounted for 1.1% of ED injury visits, an estimated 3,033,931 visits over 9 years, or 337,103 per year; average age was 28.9 years, 52.6% male, and 80.2% occurred at home.
- Anatomic distribution was upper extremity 47.3%, head/neck 26.8%, lower extremity 21.5%, and trunk 4.4%; younger patients had more head/neck bites, while older patients had more upper extremity bites.
- Hospital admission occurred in 1.7%; the only significant predictor was age group, with OR 11.03 [4.68, 26.01] for >85 years, 4.88 [2.89, 8.24] for 75–84 years, and 2.79 [1.77, 4.39] for ≤4 years, using 10–14 years as reference.
- The estimated cost was at least 400 million US$ per year, with a higher estimate of $795 million annually depending on cost assumptions.
Methods
- Retrospective analysis of National Electronic Injury Surveillance System All Injury Program (NEISS-AIP) data for 2005–2013; dog bite injuries identified by NEISS AIP codes PCAUSE_C = 16 and/or ICAUSE_C = 16.
- Data came from about 100 US hospitals with EDs, including about 65 hospitals reporting all injuries; analyses used SUDAAN 11.0.01 to account for weighted, stratified data, with incidence calculated from US Census Bureau population data.
- Statistical testing used t-tests, ANOVA, χ² tests, and multivariate logistic regression; P < 0.05 was considered significant.
Limitations
- The paper states NEISS only captures individuals who sought ED care, excluding urgent care, physician offices, and those who did not seek care, so the true number of dog bites is likely higher.
- The paper notes limited detail on injury severity and diagnosis, with diagnosis coded as “other” in 33.8% of cases; NEISS data accuracy has been reported as over 90% in prior studies.
- Evident from the text: this is a retrospective, cross-sectional database analysis, so associations such as age with admission or bite location cannot establish causation; race/ethnicity reporting was also restricted because of small numbers of Polynesian and Indo-Mediterranean peoples.
Model-written summary. Check it against the paper before relying on it.
Integrity signals
Registry
Cites
Statistics
Figures
Verification
Claims the paper makes
56 Own result · 9 Own interpretation · 5 No full text of the sources · 3 Not checked yet · 2 Own method · 1 Partly supported · 1 Couldn’t confirm · 1 Sources not found · accuracy not yet measured
The cited sources that could be checked couldn’t confirm or dispute this claim.
In the paper
“These studies [5, 29] suggest that ED visits for dog bites account for only ∼8% of all dog bites.”
§ The demographics of dog bites in the United States > Discussion
What the sources say
- Could not verifycites [5] Cornelissen, 2010, Dog bites in The Netherlands: a study of victims, injuries, circumstances and aggressors to support evaluation of breed specific legislation, Vet. J. sourceExperimental — accuracy not yet measured
The supplied copy contains a title record and bibliographic information in the section labelled Abstract, but no passage about how many dog bites result in ED visits. Searches for “8% emergency department dog bites” and the proportion of all dog bites represented by emergency-department visits found no relevant passage, so the claim cannot be checked against this copy. (LLM, conf=0.73)
- Not checked — no full text of the sourcecites [29] Berzon, 1978, The animal bite epidemic in Baltimore, Maryland: review and update, Am. J. Pub. Health source
hedged- Asserted: passes — The authors put it forward as true.
- Checkable: passes — It can be checked against evidence.
- Load-bearing: unclear — It is unclear whether the paper’s conclusions depend on it.
- Based: passes — The paper gives a reason why it holds.
- Could not verify
A result the paper reports from its own data — it cites no other source for it, so there is none to check. The quote shows it is in the paper.
In the paper
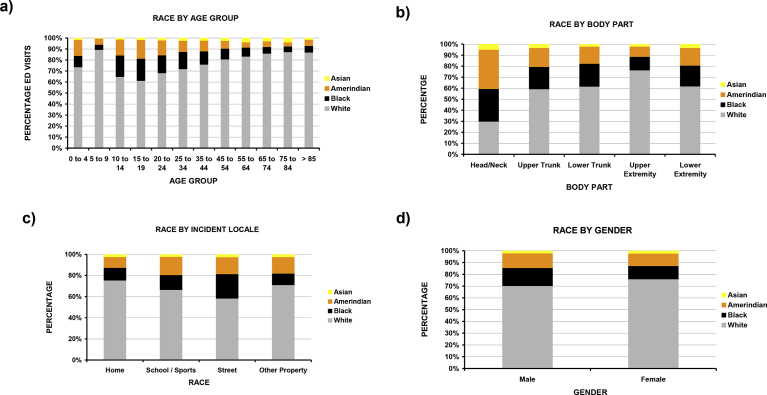
“There were differences by race for age, incident locale, and anatomic location of the bite (Fig. 5).”
§ The demographics of dog bites in the United States > Results > Analyses by race
plaincorrelational- Asserted: passes — The authors put it forward as true.
- Checkable: passes — It can be checked against evidence.
- Load-bearing: passes — The paper’s conclusions depend on it.
- Based: passes — The paper gives a reason why it holds.
- Rests on an assumption: The NEISS-AIP sample of approximately 100 hospitals is representative of US emergency departments, allowing nationwide estimates.
A result the paper reports from its own data — it cites no other source for it, so there is none to check. The quote shows it is in the paper.
In the paper
“They were also more likely in Whites (OR 1.36 [1.12, 1.66]) with Asians the reference group.”
§ The demographics of dog bites in the United States > Results > Outcome predictors from multivariate logistic regression analysis
plaincorrelational- Asserted: passes — The authors put it forward as true.
- Checkable: passes — It can be checked against evidence.
- Load-bearing: unclear — It is unclear whether the paper’s conclusions depend on it.
- Based: passes — The paper gives a reason why it holds.
- Rests on an assumption: The NEISS-AIP sample of approximately 100 hospitals is representative of US emergency departments, allowing nationwide estimates.
A result the paper reports from its own data — it cites no other source for it, so there is none to check. The quote shows it is in the paper.
In the paper
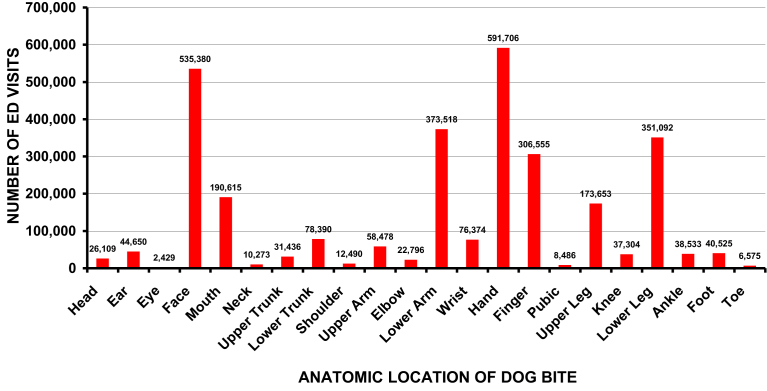
“The bite was located in the upper extremity in 47.3%, head/neck in 26.8%, lower extremity in 21.5%, and trunk in 4.4%.”
§ The demographics of dog bites in the United States > Conclusion
plain- Asserted: passes — The authors put it forward as true.
- Checkable: passes — It can be checked against evidence.
- Load-bearing: unclear — It is unclear whether the paper’s conclusions depend on it.
- Based: passes — The paper gives a reason why it holds.
A result the paper reports from its own data — it cites no other source for it, so there is none to check. The quote shows it is in the paper.
In the paper
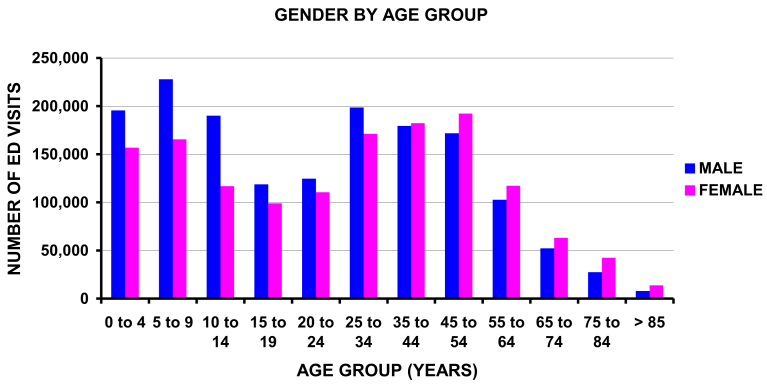
“There were significant differences by age and gender (Fig. 3)”
§ The demographics of dog bites in the United States > Results
plaincorrelational- Asserted: passes — The authors put it forward as true.
- Checkable: passes — It can be checked against evidence.
- Load-bearing: passes — The paper’s conclusions depend on it.
- Based: passes — The paper gives a reason why it holds.
- Rests on an assumption: The NEISS-AIP sample of approximately 100 hospitals is representative of US emergency departments, allowing nationwide estimates.
A result the paper reports from its own data — it cites no other source for it, so there is none to check. The quote shows it is in the paper.
In the paper
“They were more likely in Whites (OR 2.06 [1.69, 2.50]) with Blacks the reference group.”
§ The demographics of dog bites in the United States > Results > Outcome predictors from multivariate logistic regression analysis
plaincorrelational- Asserted: passes — The authors put it forward as true.
- Checkable: passes — It can be checked against evidence.
- Load-bearing: unclear — It is unclear whether the paper’s conclusions depend on it.
- Based: passes — The paper gives a reason why it holds.
- Rests on an assumption: The NEISS-AIP sample of approximately 100 hospitals is representative of US emergency departments, allowing nationwide estimates.
A result the paper reports from its own data — it cites no other source for it, so there is none to check. The quote shows it is in the paper.
In the paper
“years (OR 5.69 [4.17, 7.77]) of age with the reference group those ≤4 years of age.”
- Also stated in: § Outcome predictors from multivariate logistic regression analysis · plain
“15 to 19 | 9.67 | 4.77 | 19.62 | <10−4 | 4.51 | 3.62 | 5.61 | <10−4 | 5.69 | 4.17 | 7.77 | <10−4 | 1.54 | 0.81 | 2.91 | 0.19”
§ The demographics of dog bites in the United States > Results > Outcome predictors from multivariate logistic regression analysis
plaincorrelational- Asserted: passes — The authors put it forward as true.
- Checkable: passes — It can be checked against evidence.
- Load-bearing: unclear — It is unclear whether the paper’s conclusions depend on it.
- Based: passes — The paper gives a reason why it holds.
- Also stated in: § Outcome predictors from multivariate logistic regression analysis · plain
A result the paper reports from its own data — it cites no other source for it, so there is none to check. The quote shows it is in the paper.
In the paper
“The average age of those was 28.9 years with a slight male predominance (52.6%), especially in those <35 years of age.”
§ The demographics of dog bites in the United States > Conclusion
plain- Asserted: passes — The authors put it forward as true.
- Checkable: passes — It can be checked against evidence.
- Load-bearing: unclear — It is unclear whether the paper’s conclusions depend on it.
- Based: passes — The paper gives a reason why it holds.
A result the paper reports from its own data — it cites no other source for it, so there is none to check. The quote shows it is in the paper.
In the paper
“the race was 71.6% [62.5, 81.0] White, 13.3% [9.3, 18.7] Black, 11.5% [6.3, 20.2] Amerindian, and 2.4% [1.0, 5.3] Asian.”
§ The demographics of dog bites in the United States > Results
plain- Asserted: passes — The authors put it forward as true.
- Checkable: passes — It can be checked against evidence.
- Load-bearing: unclear — It is unclear whether the paper’s conclusions depend on it.
- Based: passes — The paper gives a reason why it holds.
- Rests on an assumption: The NEISS-AIP sample of approximately 100 hospitals is representative of US emergency departments, allowing nationwide estimates.
A result the paper reports from its own data — it cites no other source for it, so there is none to check. The quote shows it is in the paper.
In the paper
“Another area lacking information is the diagnosis, and was given as “other” in 33.8% of the cases.”
§ The demographics of dog bites in the United States > Discussion
plain- Asserted: passes — The authors put it forward as true.
- Checkable: passes — It can be checked against evidence.
- Load-bearing: unclear — It is unclear whether the paper’s conclusions depend on it.
- Based: passes — The paper gives a reason why it holds.
A result the paper reports from its own data — it cites no other source for it, so there is none to check. The quote shows it is in the paper.
In the paper
“They were most likely to occur on the street (OR 2.48 [2.22, 2.77]) with home being the reference group”
- Also stated in: § Outcome predictors from multivariate logistic regression analysis · plain
“Street | R | - | - | - | R | - | - | | 2.48 | 2.22 | 2.77 | <10−4 | | | | |”
§ The demographics of dog bites in the United States > Results > Outcome predictors from multivariate logistic regression analysis
plaincorrelational- Asserted: passes — The authors put it forward as true.
- Checkable: passes — It can be checked against evidence.
- Load-bearing: unclear — It is unclear whether the paper’s conclusions depend on it.
- Based: passes — The paper gives a reason why it holds.
- Also stated in: § Outcome predictors from multivariate logistic regression analysis · plain
A result the paper reports from its own data — it cites no other source for it, so there is none to check. The quote shows it is in the paper.
In the paper
“The bite occurred in the upper extremity in 47.3% [46.0, 48.7], head/neck in 26.8% [25.2, 28.5], lower extremity in 21.5% [19.9, 23.1], lower trunk in 2.9% [2.6, 3.2], and upper trunk in 1.5% [1.3, 1.6].”
§ The demographics of dog bites in the United States > Results
plain- Asserted: passes — The authors put it forward as true.
- Checkable: passes — It can be checked against evidence.
- Load-bearing: unclear — It is unclear whether the paper’s conclusions depend on it.
- Based: passes — The paper gives a reason why it holds.
- Rests on an assumption: The NEISS-AIP sample of approximately 100 hospitals is representative of US emergency departments, allowing nationwide estimates.
A result the paper reports from its own data — it cites no other source for it, so there is none to check. The quote shows it is in the paper.
In the paper
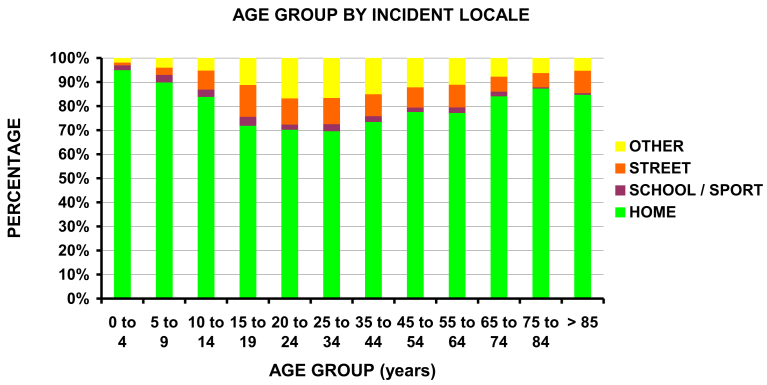
“For those <10 years of age the bite nearly always occurred in the home (P < 10−4).”
§ The demographics of dog bites in the United States > Results > Analyses by incident locale
plaincorrelational- Asserted: passes — The authors put it forward as true.
- Checkable: passes — It can be checked against evidence.
- Load-bearing: unclear — It is unclear whether the paper’s conclusions depend on it.
- Based: passes — The paper gives a reason why it holds.
- Rests on an assumption: The NEISS-AIP sample of approximately 100 hospitals is representative of US emergency departments, allowing nationwide estimates.
A result the paper reports from its own data — it cites no other source for it, so there is none to check. The quote shows it is in the paper.
In the paper
“There was an average 337,103 ED visits each year for dog bites.”
- Also stated in: § Results · hedged
“This equates to an estimated 337,103 dog bite visits per year to US EDs.”
§ The demographics of dog bites in the United States > Abstract
plain- Asserted: passes — The authors put it forward as true.
- Checkable: passes — It can be checked against evidence.
- Load-bearing: unclear — It is unclear whether the paper’s conclusions depend on it.
- Based: passes — The paper gives a reason why it holds.
- Rests on an assumption: The NEISS-AIP sample of approximately 100 hospitals is representative of US emergency departments, allowing nationwide estimates.
- Also stated in: § Results · hedged
A result the paper reports from its own data — it cites no other source for it, so there is none to check. The quote shows it is in the paper.
In the paper
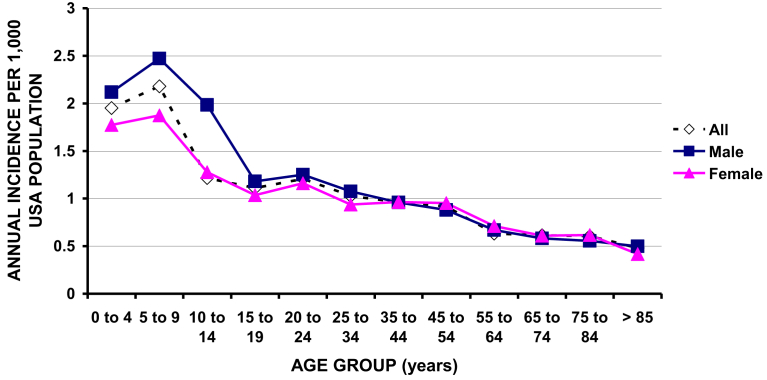
“There were significant differences by age and gender (Fig. 3), with males having a slightly higher incidence (1.18 vs 1.02 per 1,000).”
§ The demographics of dog bites in the United States > Results
plaincorrelational- Asserted: passes — The authors put it forward as true.
- Checkable: passes — It can be checked against evidence.
- Load-bearing: unclear — It is unclear whether the paper’s conclusions depend on it.
- Based: passes — The paper gives a reason why it holds.
- Rests on an assumption: The NEISS-AIP sample of approximately 100 hospitals is representative of US emergency departments, allowing nationwide estimates.
A result the paper reports from its own data — it cites no other source for it, so there is none to check. The quote shows it is in the paper.
In the paper
“The overall annual incidence of dog bite injures seen in US EDs was 1.1 per 1,000 US population.”
§ The demographics of dog bites in the United States > Results
plain- Asserted: passes — The authors put it forward as true.
- Checkable: passes — It can be checked against evidence.
- Load-bearing: unclear — It is unclear whether the paper’s conclusions depend on it.
- Based: passes — The paper gives a reason why it holds.
- Rests on an assumption: The NEISS-AIP sample of approximately 100 hospitals is representative of US emergency departments, allowing nationwide estimates.
A result the paper reports from its own data — it cites no other source for it, so there is none to check. The quote shows it is in the paper.
In the paper
“and Asians (OR 2.07 [1.78, 2.38] with Whites the reference group.”
- Also stated in: § Outcome predictors from multivariate logistic regression analysis · plain
“Asian | 1.23 | 0.92 | 1.64 | 0.16 | R | - | - | | 2.07 | 1.78 | 2.38 | <10−4 | | | | |”
§ The demographics of dog bites in the United States > Results > Outcome predictors from multivariate logistic regression analysis
plaincorrelational- Asserted: passes — The authors put it forward as true.
- Checkable: passes — It can be checked against evidence.
- Load-bearing: unclear — It is unclear whether the paper’s conclusions depend on it.
- Based: passes — The paper gives a reason why it holds.
- Also stated in: § Outcome predictors from multivariate logistic regression analysis · plain
A result the paper reports from its own data — it cites no other source for it, so there is none to check. The quote shows it is in the paper.
In the paper
“A bite to the lower extremity was most common in those 10-14 years (OR 5.82 [4.49, 7.56]) and 15-19 years (OR 5.69 [4.17, 7.77]) of age with the reference group those ≤4 years of age.”
§ The demographics of dog bites in the United States > Results > Outcome predictors from multivariate logistic regression analysis
plaincorrelational- Asserted: passes — The authors put it forward as true.
- Checkable: passes — It can be checked against evidence.
- Load-bearing: unclear — It is unclear whether the paper’s conclusions depend on it.
- Based: passes — The paper gives a reason why it holds.
- Rests on an assumption: The NEISS-AIP sample of approximately 100 hospitals is representative of US emergency departments, allowing nationwide estimates.
A result the paper reports from its own data — it cites no other source for it, so there is none to check. The quote shows it is in the paper.
In the paper
“Amerindians and Blacks comprised a larger proportion of those 10–34 years of age (31.6%–27.3%) (P < 10−4) (Fig. 5a),”
§ The demographics of dog bites in the United States > Results > Analyses by race
plaincorrelational- Asserted: passes — The authors put it forward as true.
- Checkable: passes — It can be checked against evidence.
- Load-bearing: unclear — It is unclear whether the paper’s conclusions depend on it.
- Based: passes — The paper gives a reason why it holds.
- Rests on an assumption: The NEISS-AIP sample of approximately 100 hospitals is representative of US emergency departments, allowing nationwide estimates.
A result the paper reports from its own data — it cites no other source for it, so there is none to check. The quote shows it is in the paper.
In the paper
“The most common bite locations were the head/neck, upper, and lower extremity.”
§ The demographics of dog bites in the United States > Results > Outcome predictors from multivariate logistic regression analysis
plain- Asserted: passes — The authors put it forward as true.
- Checkable: passes — It can be checked against evidence.
- Load-bearing: unclear — It is unclear whether the paper’s conclusions depend on it.
- Based: passes — The paper gives a reason why it holds.
- Rests on an assumption: The NEISS-AIP sample of approximately 100 hospitals is representative of US emergency departments, allowing nationwide estimates.
A result the paper reports from its own data — it cites no other source for it, so there is none to check. The quote shows it is in the paper.
In the paper
“Upper extremity bites occurred most commonly at home (OR 1.54 [1.30, 1.81]) with the street the reference group.”
§ The demographics of dog bites in the United States > Results > Outcome predictors from multivariate logistic regression analysis
plaincorrelational- Asserted: passes — The authors put it forward as true.
- Checkable: passes — It can be checked against evidence.
- Load-bearing: unclear — It is unclear whether the paper’s conclusions depend on it.
- Based: passes — The paper gives a reason why it holds.
- Rests on an assumption: The NEISS-AIP sample of approximately 100 hospitals is representative of US emergency departments, allowing nationwide estimates.
A result the paper reports from its own data — it cites no other source for it, so there is none to check. The quote shows it is in the paper.
In the paper
“Non-fatal human dog bites account for 1.1% of ED injury visits in the US with an average annual incidence of 1.1 per 1000; 98.8% were unintentional and 80.2% occurred at home.”
§ The demographics of dog bites in the United States > Conclusion
plain- Asserted: passes — The authors put it forward as true.
- Checkable: passes — It can be checked against evidence.
- Load-bearing: unclear — It is unclear whether the paper’s conclusions depend on it.
- Based: passes — The paper gives a reason why it holds.
A result the paper reports from its own data — it cites no other source for it, so there is none to check. The quote shows it is in the paper.
In the paper
“In this study the average annual incidence of dog bites seen in US EDs was 1.1 per 1,000.”
§ The demographics of dog bites in the United States > Discussion
plain- Asserted: passes — The authors put it forward as true.
- Checkable: passes — It can be checked against evidence.
- Load-bearing: unclear — It is unclear whether the paper’s conclusions depend on it.
- Based: passes — The paper gives a reason why it holds.
A result the paper reports from its own data — it cites no other source for it, so there is none to check. The quote shows it is in the paper.
In the paper
“Although all age groups demonstrated a White predominance (71.6% White, 24.9% Black/Amerindian),”
§ The demographics of dog bites in the United States > Results > Analyses by race
plain- Asserted: passes — The authors put it forward as true.
- Checkable: passes — It can be checked against evidence.
- Load-bearing: unclear — It is unclear whether the paper’s conclusions depend on it.
- Based: passes — The paper gives a reason why it holds.
- Rests on an assumption: The NEISS-AIP sample of approximately 100 hospitals is representative of US emergency departments, allowing nationwide estimates.
A result the paper reports from its own data — it cites no other source for it, so there is none to check. The quote shows it is in the paper.
In the paper
“Hospital admission was rare 1.7%, and there was a higher occurrence in the summer and on weekends.”
- Also stated in: § Discussion · plain
“Even in those that presented to the ED for medical care in this study, only 1.7% were admitted to the hospital.”
§ The demographics of dog bites in the United States > Conclusion
plain- Asserted: passes — The authors put it forward as true.
- Checkable: passes — It can be checked against evidence.
- Load-bearing: passes — The paper’s conclusions depend on it.
- Based: passes — The paper gives a reason why it holds.
- Also stated in: § Discussion · plain
A result the paper reports from its own data — it cites no other source for it, so there is none to check. The quote shows it is in the paper.
In the paper
“and in Amerindians (OR 2.06 [1.43, 2.96])”
- Also stated in: § Outcome predictors from multivariate logistic regression analysis · plain
“Amerindian | 1.25 | 0.96 | 1.62 | 0.092 | 1.07 | 0.8 | 1.43 | 0.65 | 2.06 | 1.43 | 2.96 | 0.0002 | | | | |”
§ The demographics of dog bites in the United States > Results > Outcome predictors from multivariate logistic regression analysis
plaincorrelational- Asserted: passes — The authors put it forward as true.
- Checkable: passes — It can be checked against evidence.
- Load-bearing: passes — The paper’s conclusions depend on it.
- Based: passes — The paper gives a reason why it holds.
- Also stated in: § Outcome predictors from multivariate logistic regression analysis · plain
A result the paper reports from its own data — it cites no other source for it, so there is none to check. The quote shows it is in the paper.
In the paper
“Non-fatal human dog bites account for 1.1% of ED injury visits in the US with an average annual incidence of 1.1 per 1000; 98.8% were unintentional and 80.2% occurred at home.”
- Also stated in: § Discussion · plain
“In this study, 35% of the injuries occurred in those <14 years old, with the vast majority occurring at home (Fig. 7).”
§ The demographics of dog bites in the United States > Conclusion
plain- Asserted: passes — The authors put it forward as true.
- Checkable: passes — It can be checked against evidence.
- Load-bearing: passes — The paper’s conclusions depend on it.
- Based: passes — The paper gives a reason why it holds.
- Also stated in: § Discussion · plain
A result the paper reports from its own data — it cites no other source for it, so there is none to check. The quote shows it is in the paper.
In the paper
“By contrast, a bite to the upper extremity was most likely in the oldest group >85 years of age (OR 15.49 [9.17, 26.15] with the reference group those ≤4 years of age.”
§ The demographics of dog bites in the United States > Results > Outcome predictors from multivariate logistic regression analysis
plaincorrelational- Asserted: passes — The authors put it forward as true.
- Checkable: passes — It can be checked against evidence.
- Load-bearing: passes — The paper’s conclusions depend on it.
- Based: passes — The paper gives a reason why it holds.
- Rests on an assumption: The NEISS-AIP sample of approximately 100 hospitals is representative of US emergency departments, allowing nationwide estimates.
A result the paper reports from its own data — it cites no other source for it, so there is none to check. The quote shows it is in the paper.
In the paper
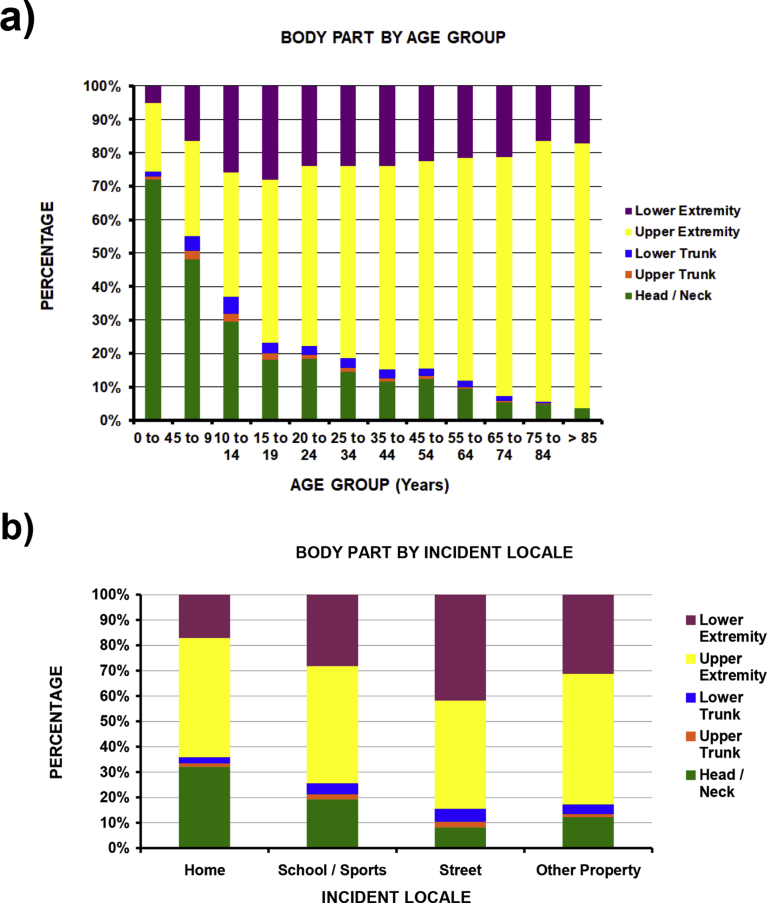
“Lower extremity bites more commonly occurred on the street (41.8%) compared to other locations (17.1%–30.9%) (P < 10−4) (Fig. 4b).”
§ The demographics of dog bites in the United States > Results > Analyses by anatomic area of injury
plaincorrelational- Asserted: passes — The authors put it forward as true.
- Checkable: passes — It can be checked against evidence.
- Load-bearing: unclear — It is unclear whether the paper’s conclusions depend on it.
- Based: passes — The paper gives a reason why it holds.
- Rests on an assumption: The NEISS-AIP sample of approximately 100 hospitals is representative of US emergency departments, allowing nationwide estimates.
A result the paper reports from its own data — it cites no other source for it, so there is none to check. The quote shows it is in the paper.
In the paper
“Such bites most commonly occurred in the home (OR 3.13 [2.74, 3.58] with the street the reference group.”
§ The demographics of dog bites in the United States > Results > Outcome predictors from multivariate logistic regression analysis
plaincorrelational- Asserted: passes — The authors put it forward as true.
- Checkable: passes — It can be checked against evidence.
- Load-bearing: unclear — It is unclear whether the paper’s conclusions depend on it.
- Based: passes — The paper gives a reason why it holds.
- Rests on an assumption: The NEISS-AIP sample of approximately 100 hospitals is representative of US emergency departments, allowing nationwide estimates.
A result the paper reports from its own data — it cites no other source for it, so there is none to check. The quote shows it is in the paper.
In the paper
“The only predictor (Table 3) for hospital admission was the age group.”
- Also stated in: § Abstract · boosted
“Logistic regression analysis demonstrated that the odds of admission was solely dependent upon the age group.”
§ The demographics of dog bites in the United States > Results > Outcome predictors from multivariate logistic regression analysis
boostedcorrelational- Asserted: passes — The authors put it forward as true.
- Checkable: passes — It can be checked against evidence.
- Load-bearing: passes — The paper’s conclusions depend on it.
- Based: passes — The paper gives a reason why it holds.
- The authors state this as an assumption: A hospital admission is a surrogate for a serious injury.
- Rests on an assumption: The NEISS-AIP sample of approximately 100 hospitals is representative of US emergency departments, allowing nationwide estimates.
- Also stated in: § Abstract · boosted
A result the paper reports from its own data — it cites no other source for it, so there is none to check. The quote shows it is in the paper.
In the paper
“In this study, 35% of the injuries occurred in those <14 years old, with the vast majority occurring at home (Fig. 7).”
§ The demographics of dog bites in the United States > Discussion
plain- Asserted: passes — The authors put it forward as true.
- Checkable: passes — It can be checked against evidence.
- Load-bearing: passes — The paper’s conclusions depend on it.
- Based: passes — The paper gives a reason why it holds.
A conclusion the paper draws from its own results — it cites no other source for it, so there is none to check. The quote shows it is in the paper.
In the paper
“Thus the overall number of injuries in this study is likely lower than the true number.”
§ The demographics of dog bites in the United States > Discussion
hedged- Asserted: passes — The authors put it forward as true.
- Checkable: passes — It can be checked against evidence.
- Load-bearing: unclear — It is unclear whether the paper’s conclusions depend on it.
- Based: passes — The paper gives a reason why it holds.
- Rests on an assumption: The NEISS only identifies individuals who sought care in an ED and does not include those treated in urgent care centers, physician offices, or those who did not seek medical care.
A conclusion the paper draws from its own results — it cites no other source for it, so there is none to check. The quote shows it is in the paper.
In the paper
“It likely portrays the most representative national analysis of dog bite injuries, which is the major strength of this study.”
§ The demographics of dog bites in the United States > Discussion
hedged- Asserted: passes — The authors put it forward as true.
- Checkable: unclear — It is unclear whether it could be checked against evidence.
- Load-bearing: passes — The paper’s conclusions depend on it.
- Based: passes — The paper gives a reason why it holds.
None of the sources cited for this claim have been checked yet.
In the paper
“In 2006–2008, the median ED charge for an open wound of an extremity (likely similar to a dog bite) was $979 [37].”
§ The demographics of dog bites in the United States > Discussion
What the sources say
- Not checked yetcites [37] Caldwell, 2013, “How much will I get charged for this?” Patient charges for top ten diagnoses in the emergency department, PLoS One source
Checked before — its earlier verdict is held back until a new check runs.
hedged- Asserted: passes — The authors put it forward as true.
- Checkable: passes — It can be checked against evidence.
- Load-bearing: unclear — It is unclear whether the paper’s conclusions depend on it.
- Based: passes — The paper gives a reason why it holds.
- Not checked yet
A conclusion the paper draws from its own results — it cites no other source for it, so there is none to check. The quote shows it is in the paper.
In the paper
“As the vast majority of the patients were released from the ED, injury severity is likely minor overall.”
§ The demographics of dog bites in the United States > Discussion
hedged- Asserted: passes — The authors put it forward as true.
- Checkable: passes — It can be checked against evidence.
- Load-bearing: unclear — It is unclear whether the paper’s conclusions depend on it.
- Based: passes — The paper gives a reason why it holds.
A claim is checked only against the cited paper’s full text, never its abstract, and none is available for its sources.
In the paper
“However two studies have demonstrated over 90% accuracy [26, 27].”
§ The demographics of dog bites in the United States > Discussion
What the sources say
- Not checked — no full text of the sourcecites [26] Annest, 1995, National estimates of nonfatal firearm-related injuries. Beyond the tip of the iceberg, JAMA source
- Not checked — no full text of the sourcecites [27] Hopkins, 1989, Consumer product-related injuries in Athens, Ohio, 1980–1985: assessment of emergency room-based surveillance, Am. J. Prev. Med. source
boosted- Asserted: passes — The authors put it forward as true.
- Checkable: passes — It can be checked against evidence.
- Load-bearing: unclear — It is unclear whether the paper’s conclusions depend on it.
- Based: passes — The paper gives a reason why it holds.
In the paper
“In Baltimore, Maryland, when using hospital and police records, the annual incidence was 6.42 per 1,000 [29].”
§ The demographics of dog bites in the United States > Discussion
What the sources say
- Not checked — no full text of the sourcecites [29] Berzon, 1978, The animal bite epidemic in Baltimore, Maryland: review and update, Am. J. Pub. Health source
plain- Asserted: passes — The authors put it forward as true.
- Checkable: passes — It can be checked against evidence.
- Load-bearing: passes — The paper’s conclusions depend on it.
- Based: passes — The paper gives a reason why it holds.
A conclusion the paper draws from its own results — it cites no other source for it, so there is none to check. The quote shows it is in the paper.
In the paper
“This likely represents the injury being a dog bite, as that is a valid NEISS data base code as a cause of injury.”
§ The demographics of dog bites in the United States > Discussion
hedged- Asserted: passes — The authors put it forward as true.
- Checkable: passes — It can be checked against evidence.
- Load-bearing: unclear — It is unclear whether the paper’s conclusions depend on it.
- Based: passes — The paper gives a reason why it holds.
A conclusion the paper draws from its own results — it cites no other source for it, so there is none to check. The quote shows it is in the paper.
In the paper
“The rapid drop in the percentage of bites to the head/neck with a corresponding increase in upper extremity bites is likely due to the size and motor ability of the patient.”
§ The demographics of dog bites in the United States > Discussion
hedgedconditional- Asserted: passes — The authors put it forward as true.
- Checkable: passes — It can be checked against evidence.
- Load-bearing: passes — The paper’s conclusions depend on it.
- Based: passes — The paper gives a reason why it holds.
A conclusion the paper draws from its own results — it cites no other source for it, so there is none to check. The quote shows it is in the paper.
In the paper
“This is the first study to the author's knowledge to analyze the demographics of non-fatal human dog bite ED visits across the entire US for all age groups, geographic locations (ie. both rural and urban), and ED disposition (released/admitted).”
§ The demographics of dog bites in the United States > Discussion
hedged- Asserted: passes — The authors put it forward as true.
- Checkable: passes — It can be checked against evidence.
- Load-bearing: passes — The paper’s conclusions depend on it.
- Based: unclear — It is unclear why the paper says it holds.
- It may state two separate claims as one. 31
- The quote only partly states this claim. 2
- Probably not a substantial claim. 6
The cited sources support only part of this claim — read each source’s verdict below.
In the paper
“A detailed Internet survey of dog owners in The Netherlands [5] found an ED visit incidence of 0.7 per 1,000 while the self reported incidence was 8.3 per 1,000.”
§ The demographics of dog bites in the United States > Discussion
What the sources say
- Partly supportedcites [5] Cornelissen, 2010, Dog bites in The Netherlands: a study of victims, injuries, circumstances and aggressors to support evaluation of breed specific legislation, Vet. J. sourceExperimental — accuracy not yet measured
The indexed Abstract (page unavailable) says the authors used Internet surveys of dog-bite victims and dog owners in the Netherlands and reported dog-bite incidence. It does not give either the 0.7-per-1,000 ED-visit figure or the 8.3-per-1,000 self-reported figure; searches for both numbers found no supporting passage in our copy. (LLM, conf=0.76)
plain- Asserted: passes — The authors put it forward as true.
- Checkable: passes — It can be checked against evidence.
- Load-bearing: passes — The paper’s conclusions depend on it.
- Based: passes — The paper gives a reason why it holds.
It may state two separate claims as one.
- Partly supported
A result the paper reports from its own data — it cites no other source for it, so there is none to check. The quote shows it is in the paper.
In the paper
“Dog bites were the 13th most common injury, and exceeded those occurring on motorcycles (14th), to pedestrians (15th) and firearm gunshot injuries (16th).”
§ The demographics of dog bites in the United States > Results
plain- Asserted: passes — The authors put it forward as true.
- Checkable: passes — It can be checked against evidence.
- Load-bearing: unclear — It is unclear whether the paper’s conclusions depend on it.
- Based: passes — The paper gives a reason why it holds.
It may state two separate claims as one.
- Rests on an assumption: The NEISS-AIP sample of approximately 100 hospitals is representative of US emergency departments, allowing nationwide estimates.
A result the paper reports from its own data — it cites no other source for it, so there is none to check. The quote shows it is in the paper.
In the paper
“Younger patients had more bites involving the head/neck, while older patients the upper extremity (Fig. 4a).”
- Also stated in: § Abstract · plain
“Younger patients had more bites involving the head/neck, while older patients the upper extremity.”
§ The demographics of dog bites in the United States > Results > Analyses by anatomic area of injury
plaincorrelational- Asserted: passes — The authors put it forward as true.
- Checkable: passes — It can be checked against evidence.
- Load-bearing: passes — The paper’s conclusions depend on it.
- Based: passes — The paper gives a reason why it holds.
It may state two separate claims as one.
- Rests on an assumption: The NEISS-AIP sample of approximately 100 hospitals is representative of US emergency departments, allowing nationwide estimates.
- Also stated in: § Abstract · plain
A result the paper reports from its own data — it cites no other source for it, so there is none to check. The quote shows it is in the paper.
In the paper
“Dog bite injuries accounted for 51,486 of the actual 4.6 million ED injury visits, or an estimated 3,033,931 [2,832,649, 3,245,171] million ED visits (1.1%).”
§ The demographics of dog bites in the United States > Results
hedged- Asserted: passes — The authors put it forward as true.
- Checkable: passes — It can be checked against evidence.
- Load-bearing: unclear — It is unclear whether the paper’s conclusions depend on it.
- Based: passes — The paper gives a reason why it holds.
It may state two separate claims as one.
- Rests on an assumption: The NEISS-AIP sample of approximately 100 hospitals is representative of US emergency departments, allowing nationwide estimates.
A result the paper reports from its own data — it cites no other source for it, so there is none to check. The quote shows it is in the paper.
In the paper
“Non-fatal human dog bites account for 1.1% of ED injury visits in the US with an average annual incidence of 1.1 per 1000; 98.8% were unintentional and 80.2% occurred at home.”
§ The demographics of dog bites in the United States > Conclusion
plain- Asserted: passes — The authors put it forward as true.
- Checkable: passes — It can be checked against evidence.
- Load-bearing: unclear — It is unclear whether the paper’s conclusions depend on it.
- Based: passes — The paper gives a reason why it holds.
The quote only partly states this claim.
A result the paper reports from its own data — it cites no other source for it, so there is none to check. The quote shows it is in the paper.
In the paper
“The average age for those with head/neck bites was 15.3, upper trunk 20.7, lower trunk 24.0, upper extremity 36.0, and lower extremity 31.5 years.”
§ The demographics of dog bites in the United States > Results > Analyses by anatomic area of injury
plaincorrelational- Asserted: passes — The authors put it forward as true.
- Checkable: passes — It can be checked against evidence.
- Load-bearing: unclear — It is unclear whether the paper’s conclusions depend on it.
- Based: passes — The paper gives a reason why it holds.
It may state two separate claims as one.
- Rests on an assumption: The NEISS-AIP sample of approximately 100 hospitals is representative of US emergency departments, allowing nationwide estimates.
A result the paper reports from its own data — it cites no other source for it, so there is none to check. The quote shows it is in the paper.
In the paper
“There were notable differences by age and incident locale (P < 10−4).”
§ The demographics of dog bites in the United States > Results > Analyses by anatomic area of injury
plaincorrelational- Asserted: passes — The authors put it forward as true.
- Checkable: passes — It can be checked against evidence.
- Load-bearing: passes — The paper’s conclusions depend on it.
- Based: passes — The paper gives a reason why it holds.
It may state two separate claims as one.
- Rests on an assumption: The NEISS-AIP sample of approximately 100 hospitals is representative of US emergency departments, allowing nationwide estimates.
A result the paper reports from its own data — it cites no other source for it, so there is none to check. The quote shows it is in the paper.
In the paper
“The gender was male in 52.6% [51.5, 53.7] and female in 47.4% [46.3, 48.5];”
- Also stated in: § Abstract · plain
“52.6% were male and 47.4% female.”
§ The demographics of dog bites in the United States > Results
plain- Asserted: passes — The authors put it forward as true.
- Checkable: passes — It can be checked against evidence.
- Load-bearing: unclear — It is unclear whether the paper’s conclusions depend on it.
- Based: passes — The paper gives a reason why it holds.
It may state two separate claims as one.
- Rests on an assumption: The NEISS-AIP sample of approximately 100 hospitals is representative of US emergency departments, allowing nationwide estimates.
- Also stated in: § Abstract · plain
A result the paper reports from its own data — it cites no other source for it, so there is none to check. The quote shows it is in the paper.
In the paper
“The patients were treated and released from the ED in 98.3% [97.8, 98.7] and hospitalized in 1.7% [1.3, 2.2].”
§ The demographics of dog bites in the United States > Results
plain- Asserted: passes — The authors put it forward as true.
- Checkable: passes — It can be checked against evidence.
- Load-bearing: unclear — It is unclear whether the paper’s conclusions depend on it.
- Based: passes — The paper gives a reason why it holds.
It may state two separate claims as one.
- Rests on an assumption: The NEISS-AIP sample of approximately 100 hospitals is representative of US emergency departments, allowing nationwide estimates.
A result the paper reports from its own data — it cites no other source for it, so there is none to check. The quote shows it is in the paper.
In the paper
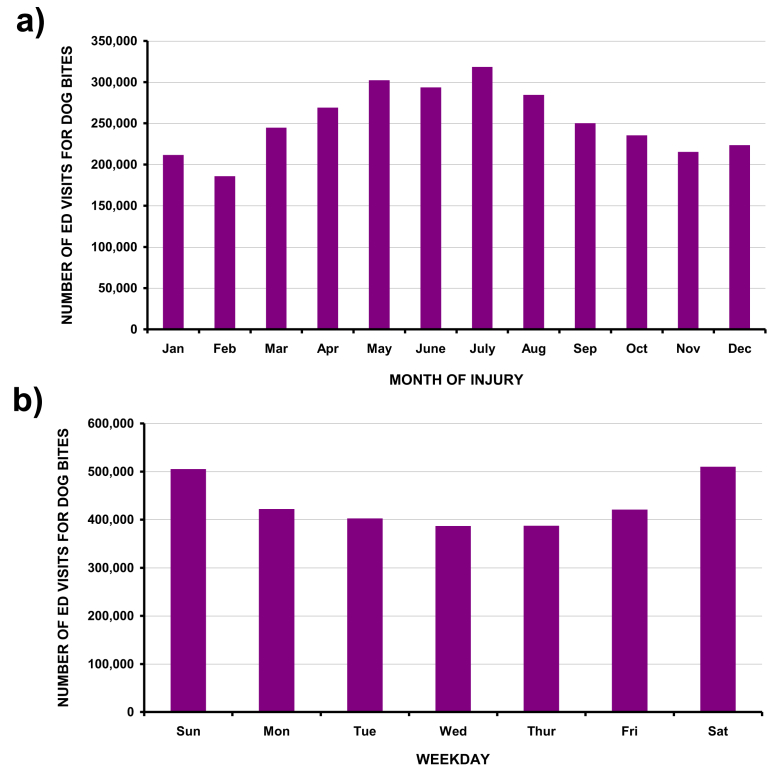
“Bites were more common in the summer and on weekends (Fig. 2).”
§ The demographics of dog bites in the United States > Results
plaincorrelational- Asserted: passes — The authors put it forward as true.
- Checkable: passes — It can be checked against evidence.
- Load-bearing: unclear — It is unclear whether the paper’s conclusions depend on it.
- Based: passes — The paper gives a reason why it holds.
It may state two separate claims as one.
- Rests on an assumption: The NEISS-AIP sample of approximately 100 hospitals is representative of US emergency departments, allowing nationwide estimates.
A result the paper reports from its own data — it cites no other source for it, so there is none to check. The quote shows it is in the paper.
In the paper
“The average age of those was 28.9 years with a slight male predominance (52.6%), especially in those <35 years of age.”
§ The demographics of dog bites in the United States > Conclusion
plaincorrelational- Asserted: passes — The authors put it forward as true.
- Checkable: passes — It can be checked against evidence.
- Load-bearing: unclear — It is unclear whether the paper’s conclusions depend on it.
- Based: passes — The paper gives a reason why it holds.
It may state two separate claims as one.
A result the paper reports from its own data — it cites no other source for it, so there is none to check. The quote shows it is in the paper.
In the paper
“The OR for admission was greater for the older and younger patients, and lowest for those 10–14 years of age.”
§ The demographics of dog bites in the United States > Discussion
plaincorrelational- Asserted: passes — The authors put it forward as true.
- Checkable: passes — It can be checked against evidence.
- Load-bearing: passes — The paper’s conclusions depend on it.
- Based: passes — The paper gives a reason why it holds.
It may state two separate claims as one.
A result the paper reports from its own data — it cites no other source for it, so there is none to check. The quote shows it is in the paper.
In the paper
“White patients were 75.7% female and 70.0% male (P < 10−4) (Fig. 5d).”
§ The demographics of dog bites in the United States > Results > Analyses by race
plain- Asserted: passes — The authors put it forward as true.
- Checkable: passes — It can be checked against evidence.
- Load-bearing: unclear — It is unclear whether the paper’s conclusions depend on it.
- Based: passes — The paper gives a reason why it holds.
It may state two separate claims as one.
- Rests on an assumption: The NEISS-AIP sample of approximately 100 hospitals is representative of US emergency departments, allowing nationwide estimates.
A result the paper reports from its own data — it cites no other source for it, so there is none to check. The quote shows it is in the paper.
In the paper
“The average age for males was 26.9 years and for females 31.1 years (P < 10−4),”
§ The demographics of dog bites in the United States > Results > Analyses by gender
plain- Asserted: passes — The authors put it forward as true.
- Checkable: passes — It can be checked against evidence.
- Load-bearing: unclear — It is unclear whether the paper’s conclusions depend on it.
- Based: passes — The paper gives a reason why it holds.
It may state two separate claims as one.
- Rests on an assumption: The NEISS-AIP sample of approximately 100 hospitals is representative of US emergency departments, allowing nationwide estimates.
A result the paper reports from its own data — it cites no other source for it, so there is none to check. The quote shows it is in the paper.
In the paper
“The OR for admission was greater for the older and younger patients, and lowest for those 10–14 years of age.”
§ The demographics of dog bites in the United States > Results > Outcome predictors from multivariate logistic regression analysis
plaincorrelational- Asserted: passes — The authors put it forward as true.
- Checkable: passes — It can be checked against evidence.
- Load-bearing: passes — The paper’s conclusions depend on it.
- Based: passes — The paper gives a reason why it holds.
It may state two separate claims as one.
- The authors state this as an assumption: A hospital admission is a surrogate for a serious injury.
- Rests on an assumption: The NEISS-AIP sample of approximately 100 hospitals is representative of US emergency departments, allowing nationwide estimates.
A result the paper reports from its own data — it cites no other source for it, so there is none to check. The quote shows it is in the paper.
In the paper
“Hospital admission was rare 1.7%, and there was a higher occurrence in the summer and on weekends.”
§ The demographics of dog bites in the United States > Conclusion
plaincorrelational- Asserted: passes — The authors put it forward as true.
- Checkable: passes — It can be checked against evidence.
- Load-bearing: passes — The paper’s conclusions depend on it.
- Based: passes — The paper gives a reason why it holds.
It may state two separate claims as one. The quote only partly states this claim.
A result the paper reports from its own data — it cites no other source for it, so there is none to check. The quote shows it is in the paper.
In the paper
“A bite to the head neck was most common in those ≤4 years of age (OR 100.2 [43.2, 232.4]) and decreased with increasing age, with the reference group those >85 years of age.”
§ The demographics of dog bites in the United States > Results > Outcome predictors from multivariate logistic regression analysis
plaincorrelational- Asserted: passes — The authors put it forward as true.
- Checkable: passes — It can be checked against evidence.
- Load-bearing: passes — The paper’s conclusions depend on it.
- Based: passes — The paper gives a reason why it holds.
It may state two separate claims as one.
- Rests on an assumption: The NEISS-AIP sample of approximately 100 hospitals is representative of US emergency departments, allowing nationwide estimates.
A result the paper reports from its own data — it cites no other source for it, so there is none to check. The quote shows it is in the paper.
In the paper
“The OR for those >85 years of age was 11.03 [4.68, 26.01], 75–84 years 4.88 [2.89, 8.24], and those ≤4 years of age 2.79 [1.77, 4.39] with the 10–14 year age group the reference group.”
§ The demographics of dog bites in the United States > Results > Outcome predictors from multivariate logistic regression analysis
plaincorrelational- Asserted: passes — The authors put it forward as true.
- Checkable: passes — It can be checked against evidence.
- Load-bearing: passes — The paper’s conclusions depend on it.
- Based: passes — The paper gives a reason why it holds.
It may state two separate claims as one.
- The authors state this as an assumption: A hospital admission is a surrogate for a serious injury.
- Rests on an assumption: The NEISS-AIP sample of approximately 100 hospitals is representative of US emergency departments, allowing nationwide estimates.
A result the paper reports from its own data — it cites no other source for it, so there is none to check. The quote shows it is in the paper.
In the paper
“The majority (80.2% [77.7, 82.4]) of the bites occurred at home, 7.1% [5.9, 9.2] on the street, 2.5% [2.0, 3.2] at schools or sporting places, and the remaining 10% [7.7, 12.1] at other locations.”
§ The demographics of dog bites in the United States > Results
plain- Asserted: passes — The authors put it forward as true.
- Checkable: passes — It can be checked against evidence.
- Load-bearing: unclear — It is unclear whether the paper’s conclusions depend on it.
- Based: passes — The paper gives a reason why it holds.
It may state two separate claims as one.
- Rests on an assumption: The NEISS-AIP sample of approximately 100 hospitals is representative of US emergency departments, allowing nationwide estimates.
A result the paper reports from its own data — it cites no other source for it, so there is none to check. The quote shows it is in the paper.
In the paper
“The dog bite was unintentional in 98.8% [98.1, 99.2], due to legal intervention in 1.1% [0.7, 1.8], and an assault in 0.2% [0.1, 0.3].”
§ The demographics of dog bites in the United States > Results
plain- Asserted: passes — The authors put it forward as true.
- Checkable: passes — It can be checked against evidence.
- Load-bearing: unclear — It is unclear whether the paper’s conclusions depend on it.
- Based: passes — The paper gives a reason why it holds.
It may state two separate claims as one.
- Rests on an assumption: The NEISS-AIP sample of approximately 100 hospitals is representative of US emergency departments, allowing nationwide estimates.
A result the paper reports from its own data — it cites no other source for it, so there is none to check. The quote shows it is in the paper.
In the paper
“Predictors of a bite to the head/neck, upper extremity, and lower extremity were all dependent upon the age group, race, and incident locale.”
§ The demographics of dog bites in the United States > Results > Outcome predictors from multivariate logistic regression analysis
plaincorrelational- Asserted: passes — The authors put it forward as true.
- Checkable: passes — It can be checked against evidence.
- Load-bearing: passes — The paper’s conclusions depend on it.
- Based: passes — The paper gives a reason why it holds.
It may state two separate claims as one.
- Rests on an assumption: The NEISS-AIP sample of approximately 100 hospitals is representative of US emergency departments, allowing nationwide estimates.
A result the paper reports from its own data — it cites no other source for it, so there is none to check. The quote shows it is in the paper.
In the paper
“bites to the trunk (P < 10−4) (3.6% Whites, 6.4% Black/Amerindian) (Fig. 5b),”
§ The demographics of dog bites in the United States > Results > Analyses by race
plaincorrelational- Asserted: passes — The authors put it forward as true.
- Checkable: passes — It can be checked against evidence.
- Load-bearing: unclear — It is unclear whether the paper’s conclusions depend on it.
- Based: passes — The paper gives a reason why it holds.
It may state two separate claims as one.
- Rests on an assumption: The NEISS-AIP sample of approximately 100 hospitals is representative of US emergency departments, allowing nationwide estimates.
A result the paper reports from its own data — it cites no other source for it, so there is none to check. The quote shows it is in the paper.
In the paper
“with males having a higher proportion in those <35 years old and females in those ≥45 years old (Fig. 6).”
§ The demographics of dog bites in the United States > Results > Analyses by gender
plaincorrelational- Asserted: passes — The authors put it forward as true.
- Checkable: passes — It can be checked against evidence.
- Load-bearing: passes — The paper’s conclusions depend on it.
- Based: passes — The paper gives a reason why it holds.
It may state two separate claims as one.
- Rests on an assumption: The NEISS-AIP sample of approximately 100 hospitals is representative of US emergency departments, allowing nationwide estimates.
A result the paper reports from its own data — it cites no other source for it, so there is none to check. The quote shows it is in the paper.
In the paper
“The average age of those with dog bites was 28.9 [28.0, 29.8] years and median age 24 [23.6, 26.2] years.”
§ The demographics of dog bites in the United States > Results
plain- Asserted: passes — The authors put it forward as true.
- Checkable: passes — It can be checked against evidence.
- Load-bearing: unclear — It is unclear whether the paper’s conclusions depend on it.
- Based: passes — The paper gives a reason why it holds.
It may state two separate claims as one.
- Rests on an assumption: The NEISS-AIP sample of approximately 100 hospitals is representative of US emergency departments, allowing nationwide estimates.
A result the paper reports from its own data — it cites no other source for it, so there is none to check. The quote shows it is in the paper.
In the paper
“The peak incidence was 2.18 per 1,000 in the 5–9 year age group and the lowest 0.47 per 1,000 in those ≥85 years old.”
§ The demographics of dog bites in the United States > Results
plain- Asserted: passes — The authors put it forward as true.
- Checkable: passes — It can be checked against evidence.
- Load-bearing: unclear — It is unclear whether the paper’s conclusions depend on it.
- Based: passes — The paper gives a reason why it holds.
It may state two separate claims as one.
- Rests on an assumption: The NEISS-AIP sample of approximately 100 hospitals is representative of US emergency departments, allowing nationwide estimates.
A result the paper reports from its own data — it cites no other source for it, so there is none to check. The quote shows it is in the paper.
In the paper
“and those occurring on the street (P = 0.017) (60% White, 14.3% Black/Amerindian) (Fig. 5c).”
§ The demographics of dog bites in the United States > Results > Analyses by race
plaincorrelational- Asserted: passes — The authors put it forward as true.
- Checkable: passes — It can be checked against evidence.
- Load-bearing: unclear — It is unclear whether the paper’s conclusions depend on it.
- Based: passes — The paper gives a reason why it holds.
It may state two separate claims as one.
- Rests on an assumption: The NEISS-AIP sample of approximately 100 hospitals is representative of US emergency departments, allowing nationwide estimates.
What the paper did — it cites no source for this, so there is none to check. The quote shows it is in the paper.
In the paper
“Statistical analyses were performed with SUDAAN 11.0.01™ software (RTI International, Research Triangle Park, North Carolina, 2013) which accounts for the weighted, stratified nature of the data.”
§ The demographics of dog bites in the United States > Materials and methods > Statistical analysis
plain- Asserted: passes — The authors put it forward as true.
- Checkable: passes — It can be checked against evidence.
- Load-bearing: passes — The paper’s conclusions depend on it.
- Based: passes — The paper gives a reason why it holds.
Probably not a substantial claim.
What the paper did — it cites no source for this, so there is none to check. The quote shows it is in the paper.
In the paper
“Use of this publicly available de-identified data was considered exempt by our local Institutional Review Board.”
§ The demographics of dog bites in the United States > Materials and methods > Data source
plain- Asserted: passes — The authors put it forward as true.
- Checkable: passes — It can be checked against evidence.
- Load-bearing: fails — The paper’s conclusions may not depend on it.
- Based: passes — The paper gives a reason why it holds.
Probably not a substantial claim. The paper’s conclusions may not depend on it.
None of the sources cited for this claim have been checked yet.
In the paper
“and are in the top 15 causes of non-fatal injuries [19].”
§ The demographics of dog bites in the United States > Introduction
What the sources say
- Not checked yetcites [19] Nilson, 2018, The effect of breed-specific legislation on hospital treated dog bites in Odense, Denmark – a time series intervention study, PLoS One source
Checked before — its earlier verdict is held back until a new check runs.
plain- Asserted: passes — The authors put it forward as true.
- Checkable: passes — It can be checked against evidence.
- Load-bearing: fails — The paper’s conclusions may not depend on it.
- Based: passes — The paper gives a reason why it holds.
Probably not a substantial claim. The paper’s conclusions may not depend on it.
- Not checked yet
A conclusion the paper draws from its own results — it cites no other source for it, so there is none to check. The quote shows it is in the paper.
In the paper
“Dog bite injuries represent a significant financial burden to society with a conservative estimate of an annual 400 million US$ in the USA alone.”
§ The demographics of dog bites in the United States > Conclusion
hedged- Asserted: passes — The authors put it forward as true.
- Checkable: passes — It can be checked against evidence.
- Load-bearing: fails — The paper’s conclusions may not depend on it.
- Based: passes — The paper gives a reason why it holds.
Probably not a substantial claim. The paper’s conclusions may not depend on it.
None of the sources cited for this claim have been checked yet.
In the paper
“Another study suggested that 17% of dog bites were reported [31].”
§ The demographics of dog bites in the United States > Discussion
What the sources say
- Not checked yetcites [31] Sacks, 1996, Dog bites: how big a problem?, Inj. Prev. source
Checked before — its earlier verdict is held back until a new check runs.
hedged- Asserted: passes — The authors put it forward as true.
- Checkable: passes — It can be checked against evidence.
- Load-bearing: fails — The paper’s conclusions may not depend on it.
- Based: passes — The paper gives a reason why it holds.
Probably not a substantial claim. The paper’s conclusions may not depend on it.
- Not checked yet
A conclusion the paper draws from its own results — it cites no other source for it, so there is none to check. The quote shows it is in the paper.
In the paper
“Assuming that the costs for those admitted with dog bites in this study was the average of the surgical and medical groups ($30,083.11), then the overall expenditure in 2016 US$ for these nine years was $7.163 billion ($5.631 billion for those treated and released from the ED and $1.532 billion for those admitted to the hospital), or an annual $795 million in the US alone.”
§ The demographics of dog bites in the United States > Discussion
hedged- Asserted: passes — The authors put it forward as true.
- Checkable: passes — It can be checked against evidence.
- Load-bearing: unclear — It is unclear whether the paper’s conclusions depend on it.
- Based: passes — The paper gives a reason why it holds.
It may state two separate claims as one.
- The authors state this as an assumption: The costs for those admitted with dog bites in this study was the average of the surgical and medical groups ($30,083.11).
None of the sources cited for this claim could be matched to a paper in Crossref, so there is nothing to check it against.
In the paper
“According to the Health Care Cost Institute, the average price of an ED visit in the US in 2016 was $1917.20, the average cost of a surgical admission was $41,701.60, and the average cost of a medical admission was $18,464.62 [35, 36].”
§ The demographics of dog bites in the United States > Discussion
What the sources say
- Not matchedcites [35] Health Care Cost Institute, 2018
Couldn’t be matched to a paper in Crossref, so it can’t be checked.
- Not matchedcites [36] Frost, 2018
Couldn’t be matched to a paper in Crossref, so it can’t be checked.
plain- Asserted: passes — The authors put it forward as true.
- Checkable: passes — It can be checked against evidence.
- Load-bearing: passes — The paper’s conclusions depend on it.
- Based: passes — The paper gives a reason why it holds.
Probably not a substantial claim. It may state two separate claims as one.
- Not matched
A conclusion the paper draws from its own results — it cites no other source for it, so there is none to check. The quote shows it is in the paper.
In the paper
“Using this value, then the ED cost for those treated and release is $3.366 billion over 9 years, or $374 million annually.”
§ The demographics of dog bites in the United States > Discussion
plain- Asserted: passes — The authors put it forward as true.
- Checkable: passes — It can be checked against evidence.
- Load-bearing: unclear — It is unclear whether the paper’s conclusions depend on it.
- Based: passes — The paper gives a reason why it holds.
It may state two separate claims as one.
- The authors state this as an assumption: The median ED charge for an open wound of an extremity is likely similar to a dog bite.
In the paper
“Children are shorter than adults which places their head/neck at the same level as the dog's mouth; for adults, the dog's mouth is at the level of the lower extremity, or the hand if reaching toward the dog [34].”
§ The demographics of dog bites in the United States > Discussion
What the sources say
- Not checked — no full text of the sourcecites [34] Overall, 2001, Dog bites to humans-demography, epidemiology, injury, and risk, JAVMA source
plaindirect- Asserted: passes — The authors put it forward as true.
- Checkable: passes — It can be checked against evidence.
- Load-bearing: passes — The paper’s conclusions depend on it.
- Based: passes — The paper gives a reason why it holds.
It may state two separate claims as one.
In the paper
“Under reporting of dog bites has also been noted in Pennsylvania children, with up to 45% having been bitten during childhood [30].”
§ The demographics of dog bites in the United States > Discussion
What the sources say
- Not checked — no full text of the sourcecites [30] Beck, 1985, Unreported dog bites in children, Public Health Rep.
plain- Asserted: passes — The authors put it forward as true.
- Checkable: passes — It can be checked against evidence.
- Load-bearing: unclear — It is unclear whether the paper’s conclusions depend on it.
- Based: passes — The paper gives a reason why it holds.
It may state two separate claims as one.
A claim is checked only against the cited paper’s full text, never its abstract, and none is available for its sources.
In the paper
“Several authors [14, 21, 32, 33] have noted that children are more likely to sustain bites to the head and neck, while adults are more likely to sustain bites to the extremities.”
§ The demographics of dog bites in the United States > Discussion
What the sources say
- Not checked — no full text of the sourcecites [14] Gandhi, 1999, Dog bite injuries in children: a preliminary survey, Am. Surg. source
- Not checked — no full text of the sourcecites [21] Golinko, 2016, Characteristics of 1616 consecutive dog bite injuries at a single institution, Clin. Pediatr. source
- Not checked — no full text of the sourcecites [32] Speirs, 2015, Dog bites to the upper extremity in children, J. Paediatr. Child Health source
- Not checked — no full text of the sourcecites [33] Reisner, 2011, Behavioural characteristics associated with dog bites to children presenting to an urban trauma centre, Inj. Prev. source
plaincorrelational- Asserted: passes — The authors put it forward as true.
- Checkable: passes — It can be checked against evidence.
- Load-bearing: passes — The paper’s conclusions depend on it.
- Based: passes — The paper gives a reason why it holds.
It may state two separate claims as one.
The paper relies on this without support.
There is no comprehensive or in-depth study of human dog bites encompassing the entire United States for all age groups, especially adults, studying anatomic location, gender, race, month/weekday, and other demographic variables.
“There is no comprehensive study of dog bite demographics.”
“There is no in depth study of human dog bites encompassing the entire United States for all age groups, especially adults, studying anatomic location of injury, gender, race, month/weekday of injury, and other demographic variables.”
The authors state this as an assumption.
A hospital admission is a surrogate for a serious injury.
“A hospital admission was used as a surrogate for a serious injury.”
The paper relies on this without support.
The NEISS-AIP sample of approximately 100 hospitals is representative of US emergency departments, allowing nationwide estimates.
“The NEISS is a dataset managed by the US Consumer Product Safety Commission (USCPSC) which collects emergency department (ED) injury data from ∼100 hospitals in the United States and its territories that have an ED.”
“With appropriate statistical techniques, an estimated number of injuries is then calculated from this weighted, stratified data.”
The paper relies on this without support.
The NEISS only identifies individuals who sought care in an ED and does not include those treated in urgent care centers, physician offices, or those who did not seek medical care.
“First, the NEISS only identifies individuals who sought care in an ED. It does not include those who might have been treated in urgent care centers, physician offices, or those persons who did not seek medical care.”
The paper relies on this without support.
The severity of the injury, aside from either the patient being treated and released or admitted, is unknown.
“The severity of the injury, aside from either the patient being treated and released or admitted, is unknown.”
The authors state this as an assumption.
Hospital admission is a proxy for severity.
“Using hospital admission as a proxy for severity, logistic regression demonstrated analysis that the OR for admission was the age group.”
The authors state this as an assumption.
The costs for those admitted with dog bites in this study was the average of the surgical and medical groups ($30,083.11).
“Assuming that the costs for those admitted with dog bites in this study was the average of the surgical and medical groups ($30,083.11)”
The authors state this as an assumption.
The median ED charge for an open wound of an extremity is likely similar to a dog bite.
“In 2006–2008, the median ED charge for an open wound of an extremity (likely similar to a dog bite) was $979 [37].”
Self-check
Percentages, sums and reported differences re-computed from the paper’s own numbers.
Each contradiction between two passages listed here was confirmed by an independent check.
Rated minor: it would not touch a result — a value no result rests on, a p-value that stays on the same side of the significance level, or a conflict that is clerical, resolved elsewhere in the paper, or outside its own findings.
In the paper
§ The demographics of dog bites in the United States > Results
“an estimated 3,033,931 [2,832,649, 3,245,171] million ED visits (1.1%)”
§ The demographics of dog bites in the United States > Results
“Figure: Fig. 1 Anatomic location of the estimated 3.03 million non-fatal dog bites.”
Rated minor: it would not touch a result — a value no result rests on, a p-value that stays on the same side of the significance level, or a conflict that is clerical, resolved elsewhere in the paper, or outside its own findings.
In the paper
§ The demographics of dog bites in the United States > Results
“| Foot | 705 | 40,525 | 345,862 | 47,632 | 1.3 |”
§ The demographics of dog bites in the United States > Results
“L 95% CL is the lower 95% confidence limit of the estimate.”
Citations
Cites
Worldwide Variation in Human Growth
Eveleth, P. B., & Tanner, J. M. (1991) · Cambridge University Press eBooks · doi:10.1017/cbo9780511629105 · Cited by 1,444
Worldwide Variation in Human Growth
Jm, B. (1991) · Archives of Disease in Childhood · doi:10.1136/adc.66.7.910-a · Cited by 822
Incidence of Dog Bite Injuries Treated in Emergency Departments
Weiss, H. B. (1998) · JAMA · doi:10.1001/jama.279.1.51 · Cited by 436
Dog bites to humans—demography, epidemiology, injury, and risk
Overall, K. L., & Love, M. (2001) · Journal of the American Veterinary Medical Association · doi:10.2460/javma.2001.218.1923 · Cited by 239
National Estimates of Nonfatal Firearm-Related Injuries: Beyond the Tip of the Iceberg
Annest, J. L. (1995) · JAMA · doi:10.1001/jama.273.22.1749 · Cited by 209
Which Dogs Bite? A Case-Control Study of Risk Factors
Gershman, K. A., Sacks, J. J., & Wright, J. C. (1994) · PEDIATRICS · doi:10.1542/peds.93.6.913 · Cited by 203
Morgan, M. S., & Palmer, J. C. (2007) · BMJ · doi:10.1136/bmj.39105.659919.be · Cited by 197
Sacks, J. J., Kresnow, M., & Houston, B. (1996) · Injury Prevention · doi:10.1136/ip.2.1.52 · Cited by 172
A community approach to dog bite prevention
_, _. (2001) · Journal of the American Veterinary Medical Association · doi:10.2460/javma.2001.218.1732 · Cited by 151
Kaye, A. E., Belz, J. M., & Kirschner, R. E. (2009) · Plastic & Reconstructive Surgery · doi:10.1097/prs.0b013e3181addad9 · Cited by 125
Research works printed but not linked: 1
- Springer, 2018
Cited by
Sorted by citations
Pet dog bites in children: management and prevention
Jakeman, M., Oxley, J. A., Owczarczak-Garstecka, S. C., & Westgarth, C. (2020) · BMJ Paediatrics Open · doi:10.1136/bmjpo-2020-000726 · Cited by 78
The changing epidemiology of dog bite injuries in the United States, 2005–2018
Tuckel, P. S., & Milczarski, W. (2020) · Injury Epidemiology · doi:10.1186/s40621-020-00281-y · Cited by 67
Tulloch, J. S. P., Owczarczak-Garstecka, S. C., Fleming, K. M., Vivancos, R., & Westgarth, C. (2021) · Scientific Reports · doi:10.1038/s41598-021-81527-7 · Cited by 63
Tulloch, J. S. P., Minford, S., Pimblett, V., Rotheram, M., Christley, R. M., & Westgarth, C. (2021) · BMJ Paediatrics Open · doi:10.1136/bmjpo-2021-001040 · Cited by 62
Bitten or struck by dog: A rising number of fatalities in Europe, 1995–2016
Sarenbo, S., & Svensson, P. A. (2020) · Forensic Science International · doi:10.1016/j.forsciint.2020.110592 · Cited by 60
Metadata
- Authors
- Loder, R. T.
- Affiliations
- Riley Hospital for Children (US)
- Corresponding author
- Loder, Randall T.
- ORCID
- Loder, Randall T.
- Venue
- Heliyon
- Publisher
- Elsevier BV
- Published
- 2019-03
- Volume
- 5
- Issue
- 3
- Pages
- e01360
- ISSN
- 2405-8440 (ISSN-L)
- PMC
- PMC6431755
- OpenAlex
- W2924793014
- Cited by
- 92
- References
- 39
- Citations by year
- 2026: 14 · 2025: 14 · 2024: 10 · 2023: 9 · 2022: 10 · 2021: 20 · 2020: 12 · 2019: 3
- FWCI
- 10.71
- Type
- journal article
- Language
- en
- Open access
- gold
- doi.org
- Licence
- Locations
- Heliyon (publishedVersion, cc-by-nc-nd)
- Europe PMC (PubMed Central) (publishedVersion, cc-by-nc-nd)
- PubMed Central (publishedVersion, cc-by-nc-nd)
- PubMed (publishedVersion)
- DOAJ (DOAJ: Directory of Open Access Journals) (submittedVersion, cc-by-sa)
- IUScholarWorks (Indiana University) (submittedVersion, cc-by-nc-nd)
- PMC
- Funders
- Garceau Professorship Fund
- Rapp Pediatric Orthopaedic Research Fund
- Riley Children's Foundation
- Topics
- Health Sciences › Medicine › Public Health, Environmental and Occupational Health › Injury Epidemiology and Prevention
- Health Sciences › Medicine › Emergency Medicine › Trauma and Emergency Care Studies
- Life Sciences › Agricultural and Biological Sciences › Animal Science and Zoology › Human-Animal Interaction Studies
- Keywords
- dog bites, demographics, injury incidence, emergency department visits, hospitalization, age differences, body site distribution, seasonal variation, dog bite prevention
About these checks
Registry, retraction, Cites and statistics results are computed, not judged, with one exception: a printed reference that no index lists is read once by a model before it counts as a citation error. Claims are extracted by a model and kept only when their quote appears verbatim in the text; each cited source is then checked, with a model’s help, for whether it says what the claim relies on. Those verdicts can be wrong — read the claim’s quote and the cited source before relying on one.
A language model drew the claims from the paper on 2026-11-10, under version 3 of the claim definition (model deepseek-v4.1-flash, prompt extract-v3).
A second model labelled each claim on 2026-11-10 (model jev-1.13-20260917, definition revision gold-guideline-v0.2).
Cited sources are checked with a language model’s help (gpt-6-sol).
Statistics and arithmetic are recomputed, not judged.
Confidence bands are shown only for fields calibrated on our annotated test set. None is calibrated yet, so no band is shown.
What counts as a claim ›How we measure confidence ›How we check this ›
Are you an author, or do you see a problem with this page? Request a review
