Cited by 5

The DOI matches its Crossref record; 13 of the 13 references it cites were found in a registry or an index.

miRNA375-3p/rapamycin mediates the mTOR pathway by decreasing PS1, enhances microglial cell activity to regulate autophagy in Alzheimer's disease

Wang, Yuxiang, Xiao, Zixuan, Yin, Hanlan, Ren, Zhichao, Ma, Xueting, Wang, Yibo, Zhang, Yan, Fu, Xueqi, Zhang, Fuqiang, Zeng, Linlin·2024·Heliyon

Overview

The claims and statistics of this paper haven’t been checked yet.

Run the check — free, no account needed. It reads the open-access text and checks the sources it cites.

A few free checks a day · papers already verified open instantly · results are public

Integrity signals

Registry

Crossref · 10.1016/j.heliyon.2024.e37589

Cites

13 of 13 references verified0 citation errors · 0 not checkable

Statistics

Figures
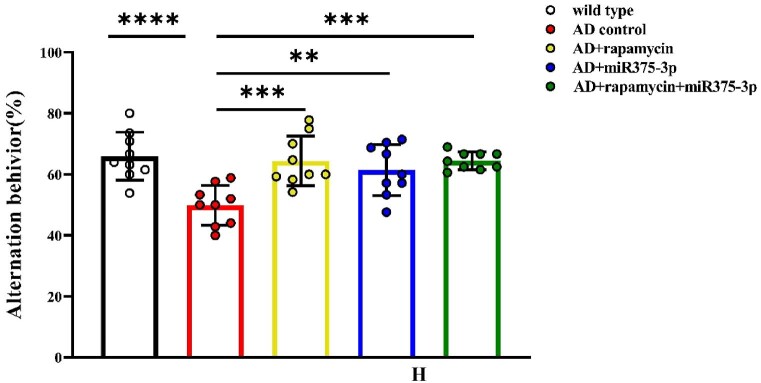
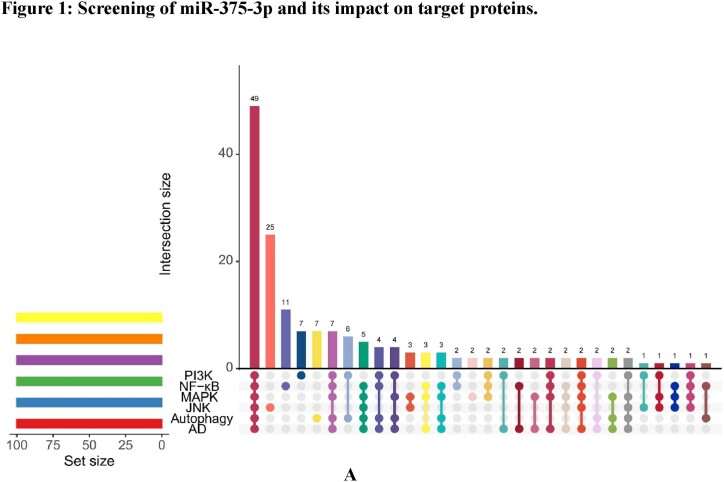
Fig. 1A The mRNA-miRNA interactions were predicted using 63 gene sets related to Alzheimer's disease (AD), autophagy, and microglial cell activation.
Fig. 1A The mRNA-miRNA interactions were predicted using 63 gene sets related to Alzheimer's disease (AD), autophagy, and microglial cell activation.CC BY · PubMed Central
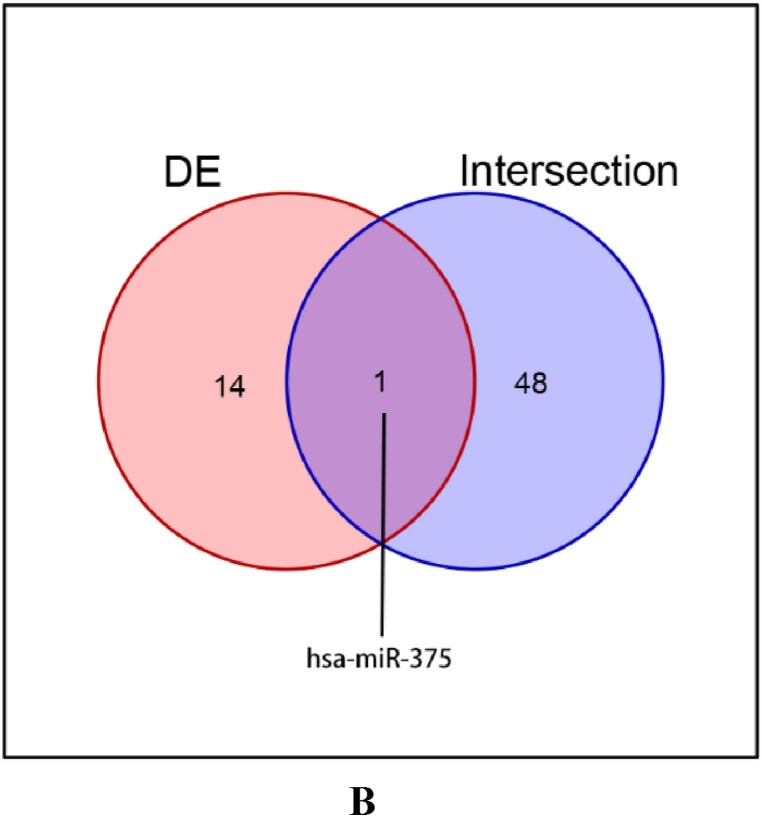
Fig. 1B Venn diagram illustrating the independent and overlapping miRNAs between the predicted proteins in (A) and data sets published by Denk J and others.
Fig. 1B Venn diagram illustrating the independent and overlapping miRNAs between the predicted proteins in (A) and data sets published by Denk J and others.CC BY · PubMed Central
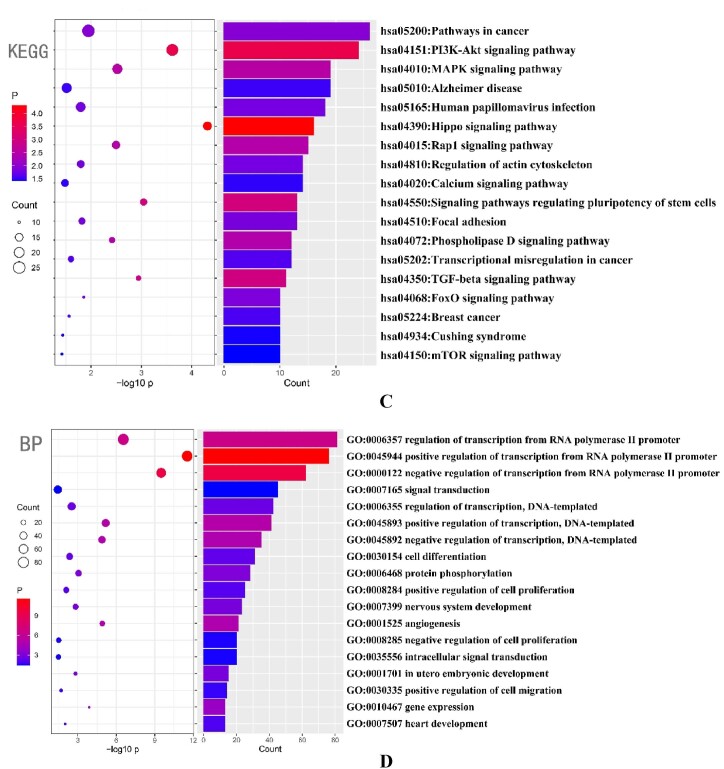
Fig. 1C and D Bubble plots depicting the enrichment of miR-375-3p target proteins using KEGG (C) and GO biological processes. (D) The predicted results were sorted by the number of proteins in respective pathways.
Fig. 1C and D Bubble plots depicting the enrichment of miR-375-3p target proteins using KEGG (C) and GO biological processes. (D) The predicted results were sorted by the number of proteins in respective pathways.CC BY · PubMed Central
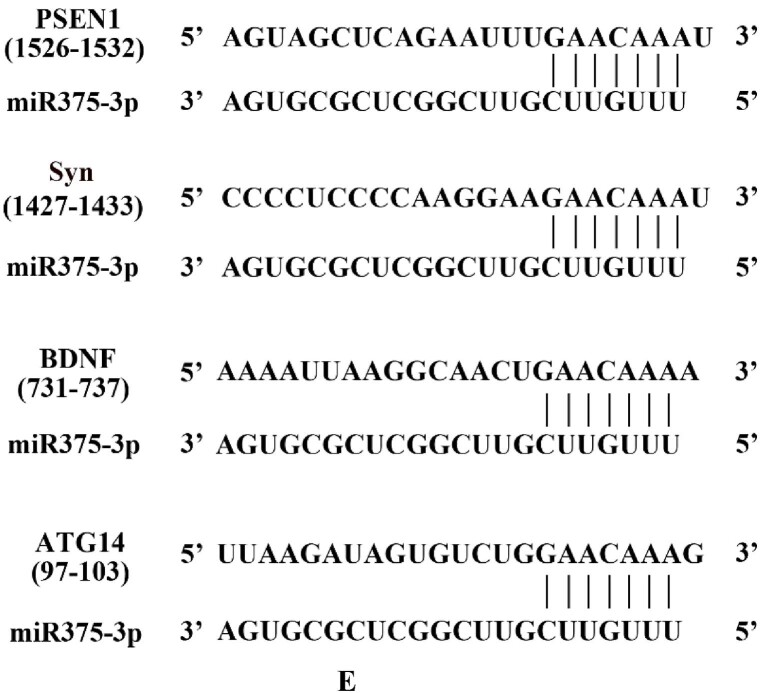
Fig. 1E Prediction of miR-375-3p interaction sites with its target proteins.
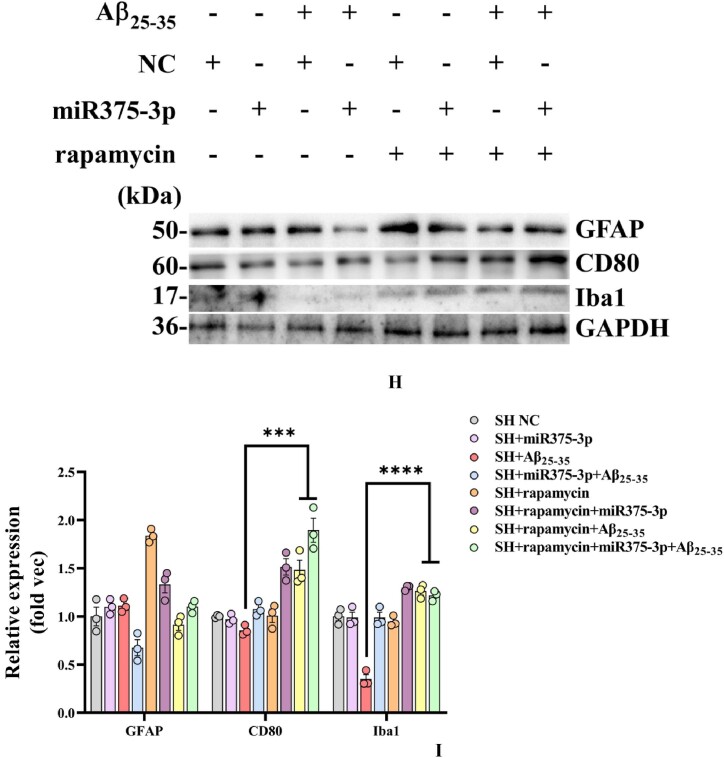
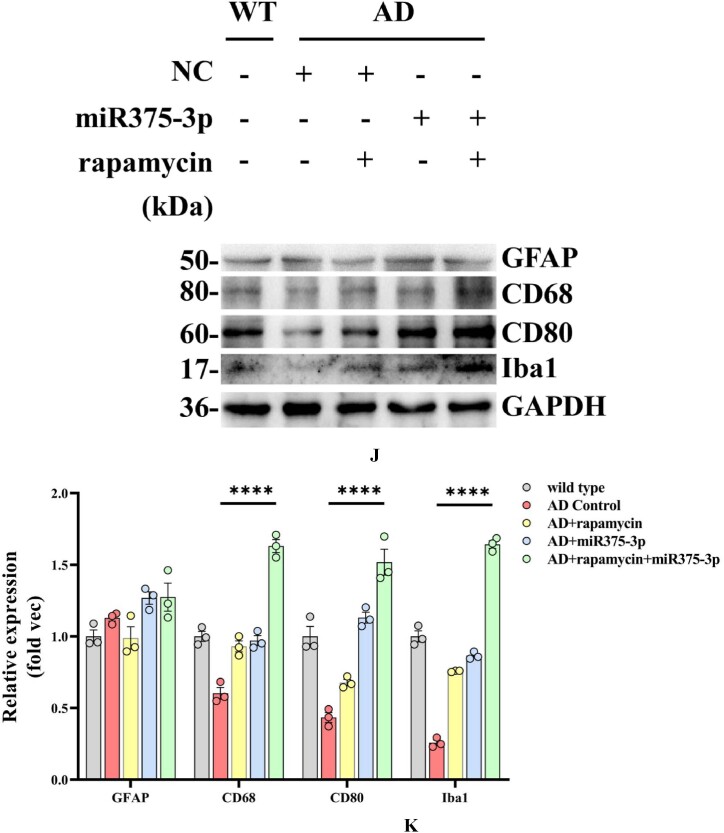
Fig. 1E Prediction of miR-375-3p interaction sites with its target proteins.CC BY · PubMed Central
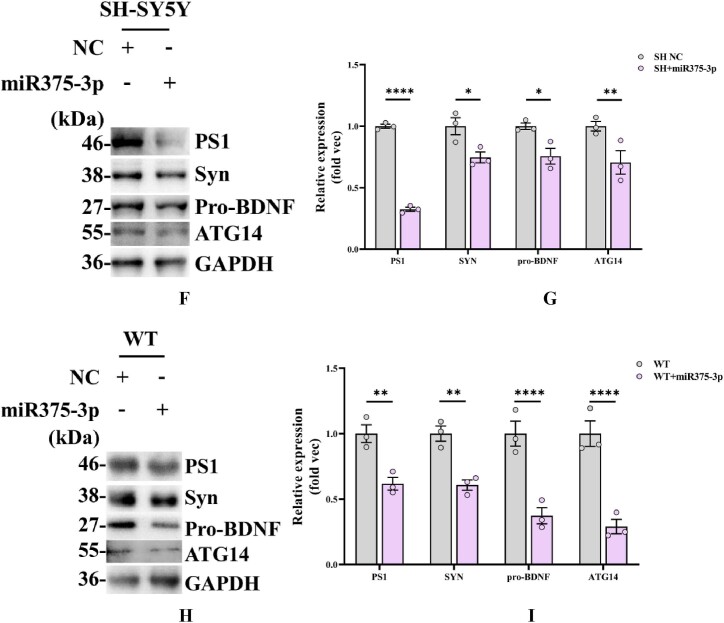
Fig. 1F_I Western blot analysis of miR375-3p interacting proteins (results of three replicates). (F) Overexpression of NC or miR375-3p in SH-SY5Y cells and assessment of PS1, Syn, ATG14, and pro-BDNF protein expression levels. (G) Quantification of cell grayscale values using GAPDH as an internal reference via ImageJ. (H) The protein expression levels of PS1, Syn, ATG14, and pro-BDNF in the frontal and temporal lobes of wild-type mice injected with single-stranded NC-agomir or miR375-3p-mimic-agomir were assessed using ImageJ with GAPDH as an internal reference. (I) GAPDH was used as a normalized internal parameter (Fold vec) to analyze the gray values of each group. All data are presented as the mean ± SEM of at least three independent experiments and were compared using one-way ANOVA with Tukey's multiple comparisons test. ∗p < 0.05, ∗∗p < 0.01, ∗∗∗p < 0.001, ∗∗∗∗p < 0.0001.
Fig. 1F_I Western blot analysis of miR375-3p interacting proteins (results of three replicates). (F) Overexpression of NC or miR375-3p in SH-SY5Y cells and assessment of PS1, Syn, ATG14, and pro-BDNF protein expression levels. (G) Quantification of cell grayscale values using GAPDH as an internal reference via ImageJ. (H) The protein expression levels of PS1, Syn, ATG14, and pro-BDNF in the frontal and temporal lobes of wild-type mice injected with single-stranded NC-agomir or miR375-3p-mimic-agomir were assessed using ImageJ with GAPDH as an internal reference. (I) GAPDH was used as a normalized internal parameter (Fold vec) to analyze the gray values of each group. All data are presented as the mean ± SEM of at least three independent experiments and were compared using one-way ANOVA with Tukey's multiple comparisons test. ∗p < 0.05, ∗∗p < 0.01, ∗∗∗p < 0.001, ∗∗∗∗p < 0.0001.CC BY · PubMed Central
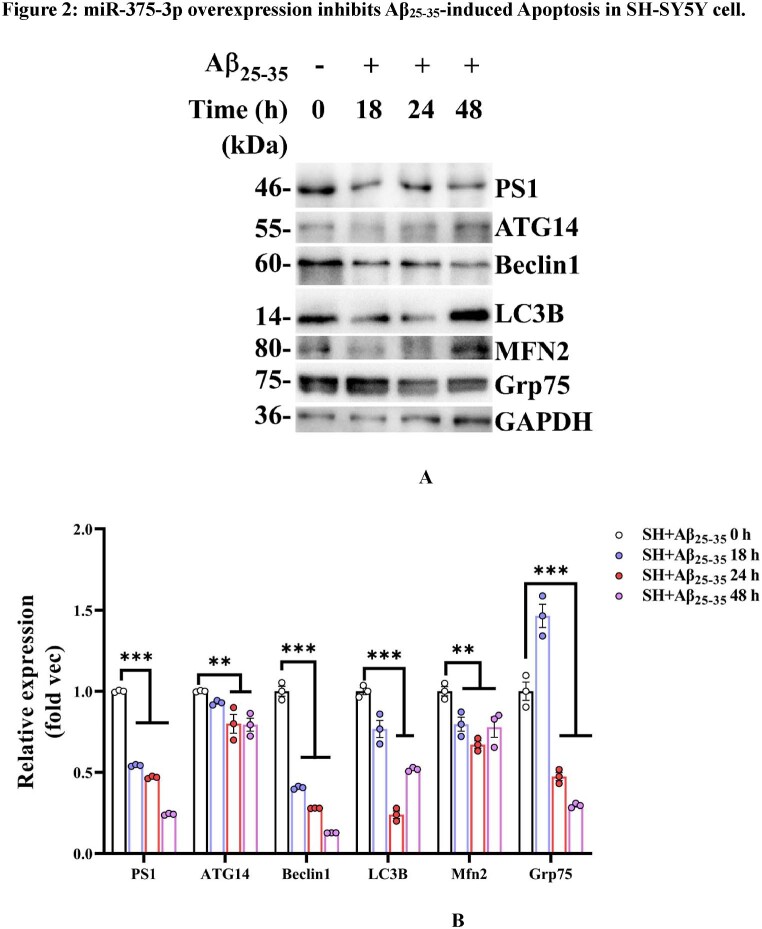
Fig. 2A and B (A) Western blot analysis of PS1, ATG14, Beclin1, LC3B, MFN2, and Grp75 protein expression levels in SH-SY5Y cells exposed to various Aβ25-35 conditions at different time points. (B) The grayscale values for each group were quantified using ImageJ analysis. GAPDH was set as the internal reference.
Fig. 2A and B (A) Western blot analysis of PS1, ATG14, Beclin1, LC3B, MFN2, and Grp75 protein expression levels in SH-SY5Y cells exposed to various Aβ25-35 conditions at different time points. (B) The grayscale values for each group were quantified using ImageJ analysis. GAPDH was set as the internal reference.CC BY · PubMed Central
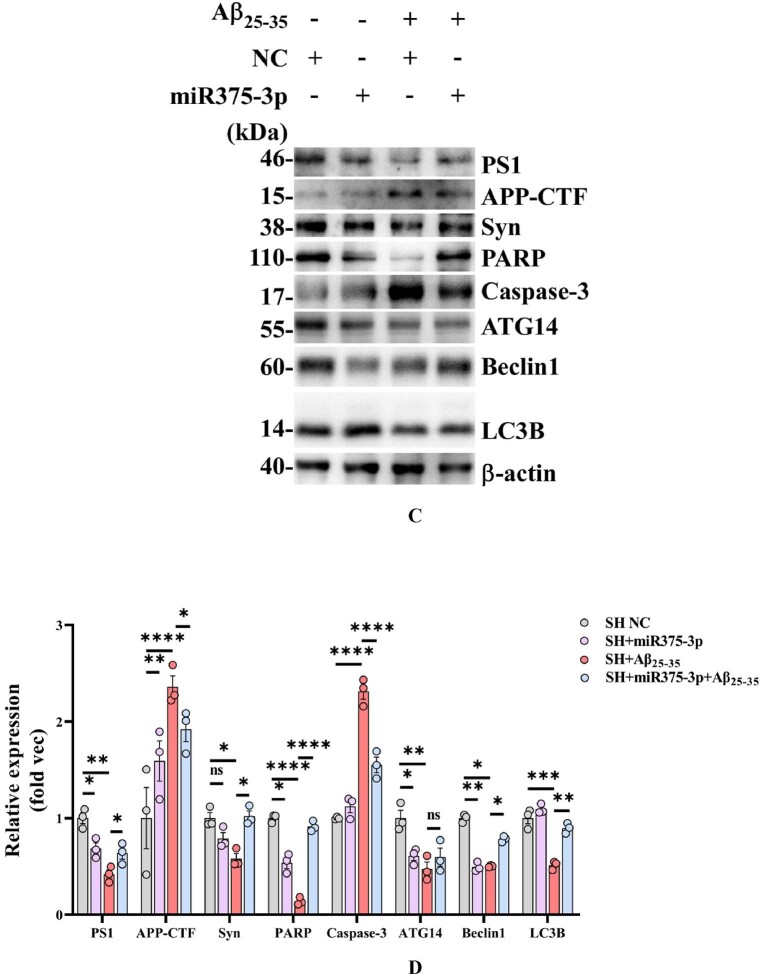
Fig. 2C and D Western blot analysis of protein expression in Aβ25-35-induced SH-SY5Y cells after miR375-3p overexpression. (C) Western blot analysis was performed to detect the expression of AD and autophagy marker proteins in each group after SH-SY5Y cells were transfected with single-stranded NC or miR375-3p-mimic and treated with 20 μM Aβ25-35 for 24 h. (D) β-actin was used as an internal reference. For grayscale value quantification and analysis, ImageJ was employed.
Fig. 2C and D Western blot analysis of protein expression in Aβ25-35-induced SH-SY5Y cells after miR375-3p overexpression. (C) Western blot analysis was performed to detect the expression of AD and autophagy marker proteins in each group after SH-SY5Y cells were transfected with single-stranded NC or miR375-3p-mimic and treated with 20 μM Aβ25-35 for 24 h. (D) β-actin was used as an internal reference. For grayscale value quantification and analysis, ImageJ was employed.CC BY · PubMed Central
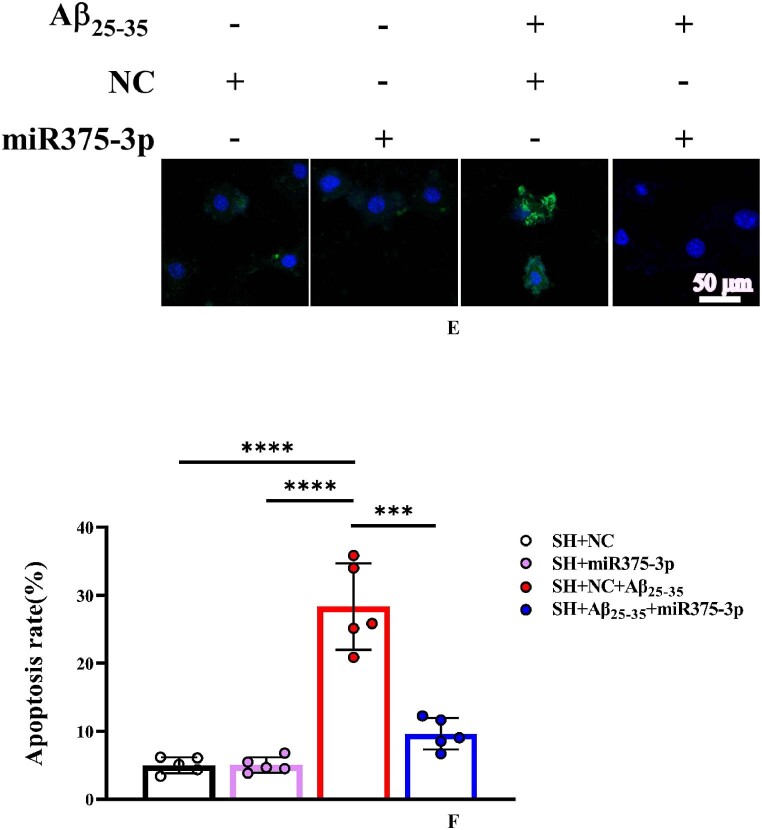
Fig. 2E and F Laser confocal microscopy images of TUNEL staining in cells (400 × magnification) with a scale bar of 50 μm (E). Cell fluorescence intensity was quantified using Image-Pro Plus 6.0 to calculate the apoptosis rate (F).
Fig. 2E and F Laser confocal microscopy images of TUNEL staining in cells (400 × magnification) with a scale bar of 50 μm (E). Cell fluorescence intensity was quantified using Image-Pro Plus 6.0 to calculate the apoptosis rate (F).CC BY · PubMed Central
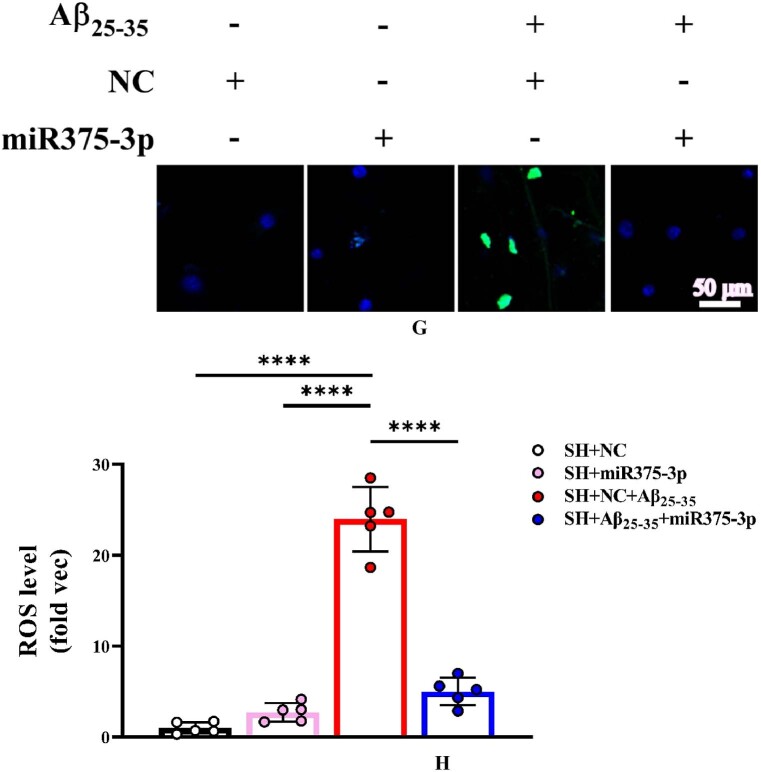
Fig. 2G and H Cellular ROS immunofluorescence staining results (400 × magnification); Scale bar = 20 μm (G). Fluorescence intensity was quantified to determine ROS levels (H). ROS: reactive oxygen species.
Fig. 2G and H Cellular ROS immunofluorescence staining results (400 × magnification); Scale bar = 20 μm (G). Fluorescence intensity was quantified to determine ROS levels (H). ROS: reactive oxygen species.CC BY · PubMed Central
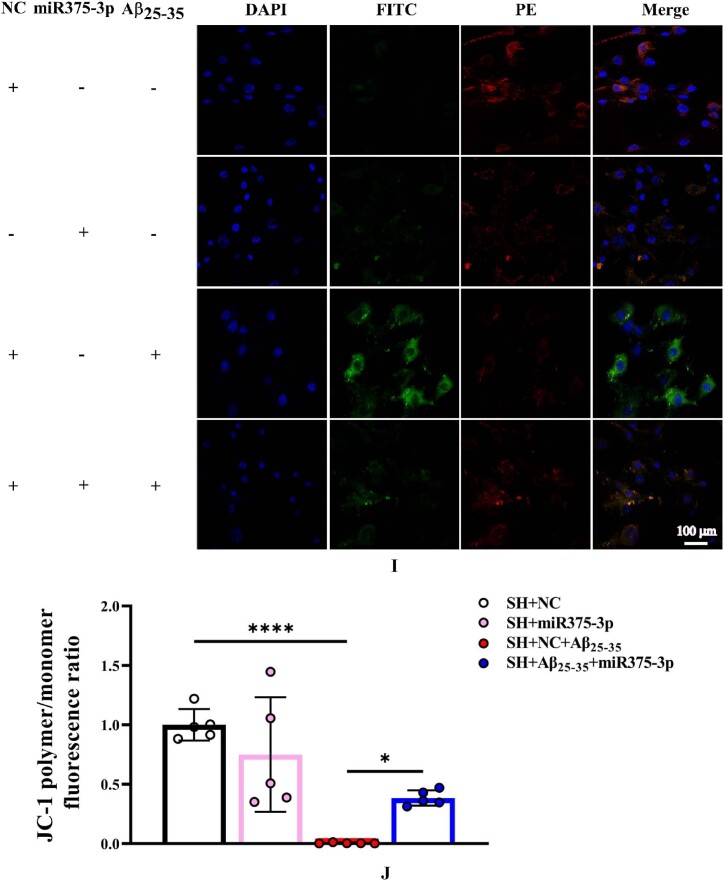
Fig. 2I and J JC-1 probe staining of cellular monomers (Alexa Fluor 488 nm) and polymers (Alexa Fluor 633) (200 × magnification): scale bar of 100 μm (I). Fluorescence intensity was quantified to assess the JC-1 polymer/monomer ratio and the results are presented relative to the SH + NC group (J).
Fig. 2I and J JC-1 probe staining of cellular monomers (Alexa Fluor 488 nm) and polymers (Alexa Fluor 633) (200 × magnification): scale bar of 100 μm (I). Fluorescence intensity was quantified to assess the JC-1 polymer/monomer ratio and the results are presented relative to the SH + NC group (J).CC BY · PubMed Central
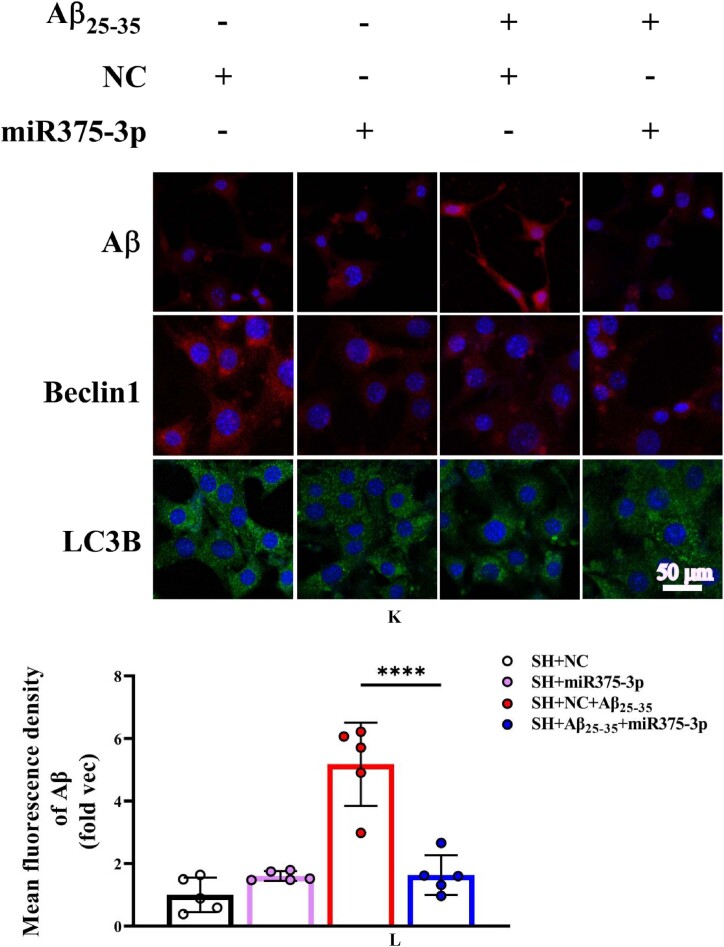
Fig. 2K–N Fluorescence staining results for Aβ, Beclin1, and LC3B. (K) The fluorescence intensity of cells stained with anti-Aβ and anti-Beclin1 was detected at 633 nm, and that of anti-LC3B stained cells was detected at 488 nm; Scale bar = 50 μm. The fluorescence intensities of Aβ (L), Beclin1 (M), and LC3B (N) were quantified and compared across groups. All data are presented as the mean ± SEM of at least three independent experiments and were compared using one-way ANOVA with Tukey's multiple comparisons test. ∗p < 0.05, ∗∗p < 0.01, ∗∗∗p < 0.001, ∗∗∗∗p < 0.0001.
Fig. 2K–N Fluorescence staining results for Aβ, Beclin1, and LC3B. (K) The fluorescence intensity of cells stained with anti-Aβ and anti-Beclin1 was detected at 633 nm, and that of anti-LC3B stained cells was detected at 488 nm; Scale bar = 50 μm. The fluorescence intensities of Aβ (L), Beclin1 (M), and LC3B (N) were quantified and compared across groups. All data are presented as the mean ± SEM of at least three independent experiments and were compared using one-way ANOVA with Tukey's multiple comparisons test. ∗p < 0.05, ∗∗p < 0.01, ∗∗∗p < 0.001, ∗∗∗∗p < 0.0001.CC BY · PubMed Central
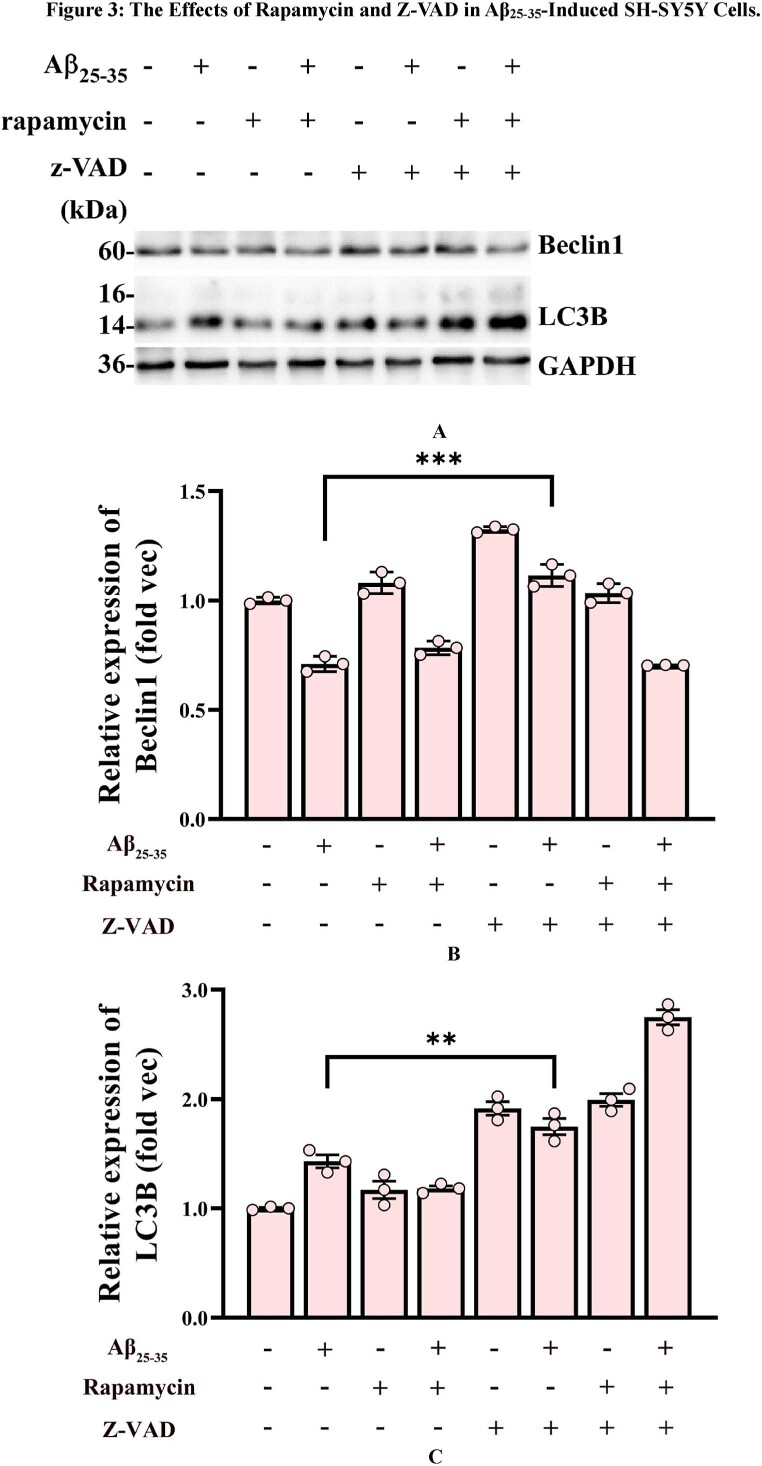
Fig. 3 A–C Western blot analysis of cellular Beclin1 and LC3B protein expression. (A) Western blot analysis of Beclin1 and LC3B levels was performed using adhered SH-SY5Y cells treated with Rapamycin and Z-VAD for 1 h, followed by Aβ25-35 induction for 24 h. (B and C) Grayscale values for Beclin1 (B) and LC3B (C) in each group were quantified using ImageJ GAPDH was used as the internal reference.
Fig. 3 A–C Western blot analysis of cellular Beclin1 and LC3B protein expression. (A) Western blot analysis of Beclin1 and LC3B levels was performed using adhered SH-SY5Y cells treated with Rapamycin and Z-VAD for 1 h, followed by Aβ25-35 induction for 24 h. (B and C) Grayscale values for Beclin1 (B) and LC3B (C) in each group were quantified using ImageJ GAPDH was used as the internal reference.CC BY · PubMed Central
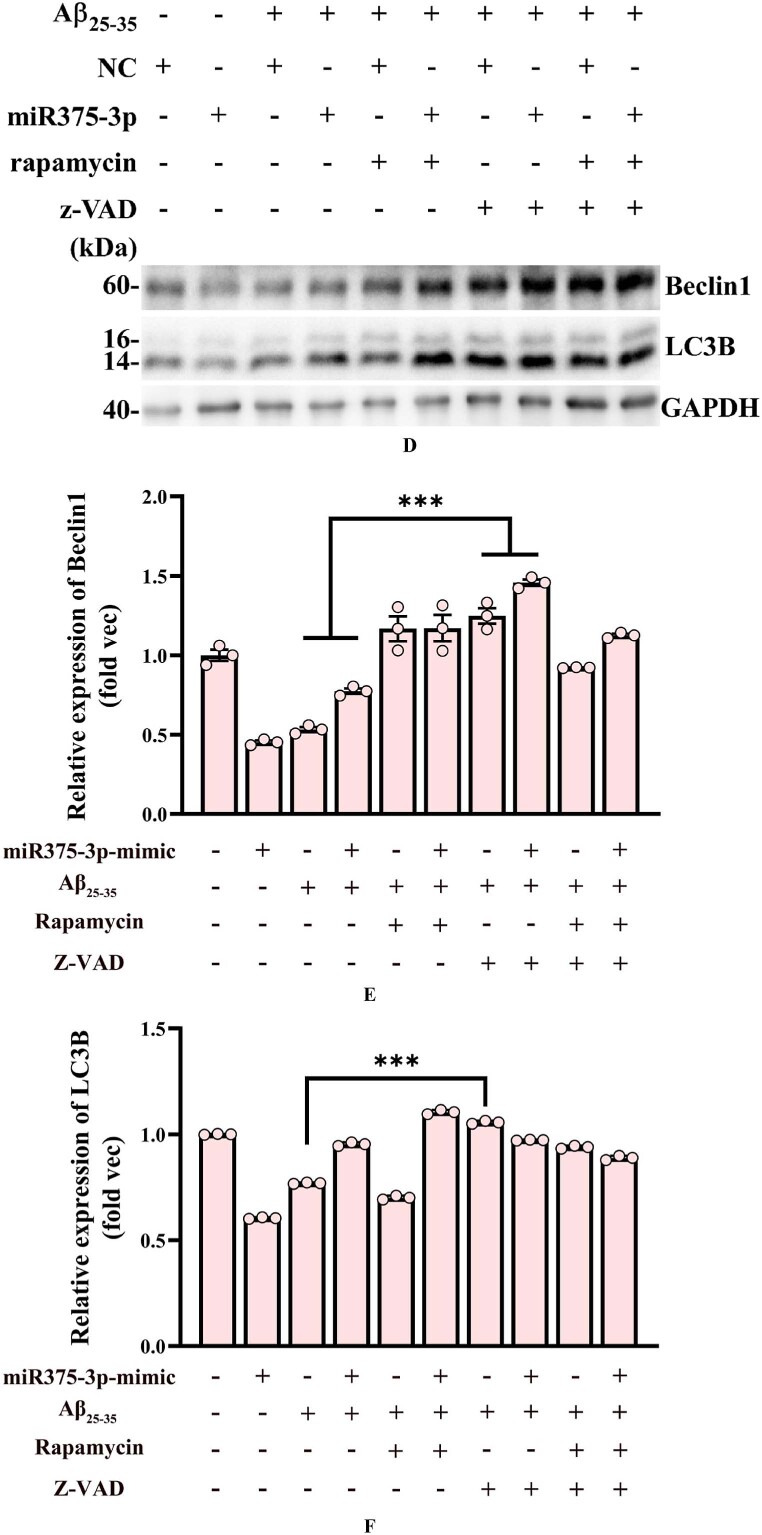
Fig. 3D–F Western blot analysis of Beclin1 and LC3B protein expression in miR-375-3p overexpressing SH-SY5Y cells. (D) Beclin1 and LC3B expression in SH-SY5Y cells was assessed after cells were transfected with either single-strand NC or miR-375-3p in the presence of Rapamycin and Z-VAD for 1 h, followed by Aβ25-35 induction for 24 h. (E and F) Grayscale values for Beclin1 (E) and LC3B (F) in each group were quantified using ImageJ. GAPDH was used as the internal reference.
Fig. 3D–F Western blot analysis of Beclin1 and LC3B protein expression in miR-375-3p overexpressing SH-SY5Y cells. (D) Beclin1 and LC3B expression in SH-SY5Y cells was assessed after cells were transfected with either single-strand NC or miR-375-3p in the presence of Rapamycin and Z-VAD for 1 h, followed by Aβ25-35 induction for 24 h. (E and F) Grayscale values for Beclin1 (E) and LC3B (F) in each group were quantified using ImageJ. GAPDH was used as the internal reference.CC BY · PubMed Central
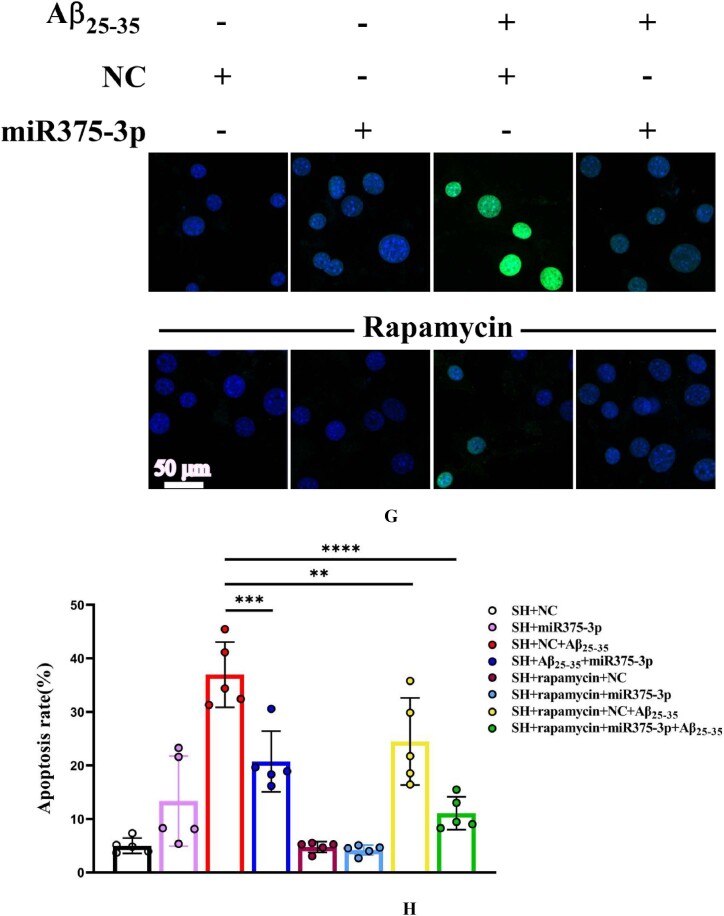
Fig. 3G and H Tunel staining analysis of SH-SY5Y cell's apoptosis levels. Cells were first treated with Rapamycin for 1 h, followed by overexpression of strand NC or miR-375-3p for 24 h, and then the addition of Aβ25-35 for 24 h. (G) A laser confocal microscope with an Alexa Fluor 488 channel was used to assess the apoptosis rate of each group's cells, which were fixed and permeabilized before Tunel probe treatment for 1 h and then stained with DAPI for 5 min. Scale bar = 50 μm. (H) The fluorescence intensity in each group was quantified using Image-Pro Plus 6.0 to calculate the apoptosis rate.
Fig. 3G and H Tunel staining analysis of SH-SY5Y cell's apoptosis levels. Cells were first treated with Rapamycin for 1 h, followed by overexpression of strand NC or miR-375-3p for 24 h, and then the addition of Aβ25-35 for 24 h. (G) A laser confocal microscope with an Alexa Fluor 488 channel was used to assess the apoptosis rate of each group's cells, which were fixed and permeabilized before Tunel probe treatment for 1 h and then stained with DAPI for 5 min. Scale bar = 50 μm. (H) The fluorescence intensity in each group was quantified using Image-Pro Plus 6.0 to calculate the apoptosis rate.CC BY · PubMed Central
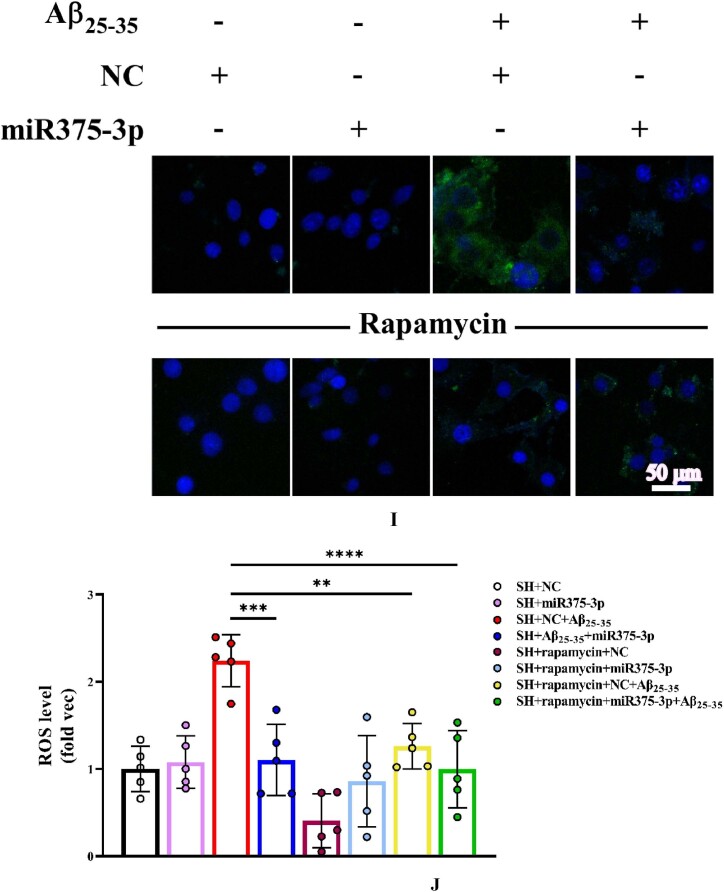
Fig. 3I and J (I) ROS probe to detect intracellular ROS levels. Briefly, cells from each group were treated with the ROS probe for 30 min, washed, and then stained with DAPI for 5 min. The excitation light intensity was measured at 488 nm; Scale bar = 50 μm. (J) The fluorescence intensity in each group was quantified to determine the levels of reactive oxygen species. ROS: Reactive oxygen species.
Fig. 3I and J (I) ROS probe to detect intracellular ROS levels. Briefly, cells from each group were treated with the ROS probe for 30 min, washed, and then stained with DAPI for 5 min. The excitation light intensity was measured at 488 nm; Scale bar = 50 μm. (J) The fluorescence intensity in each group was quantified to determine the levels of reactive oxygen species. ROS: Reactive oxygen species.CC BY · PubMed Central
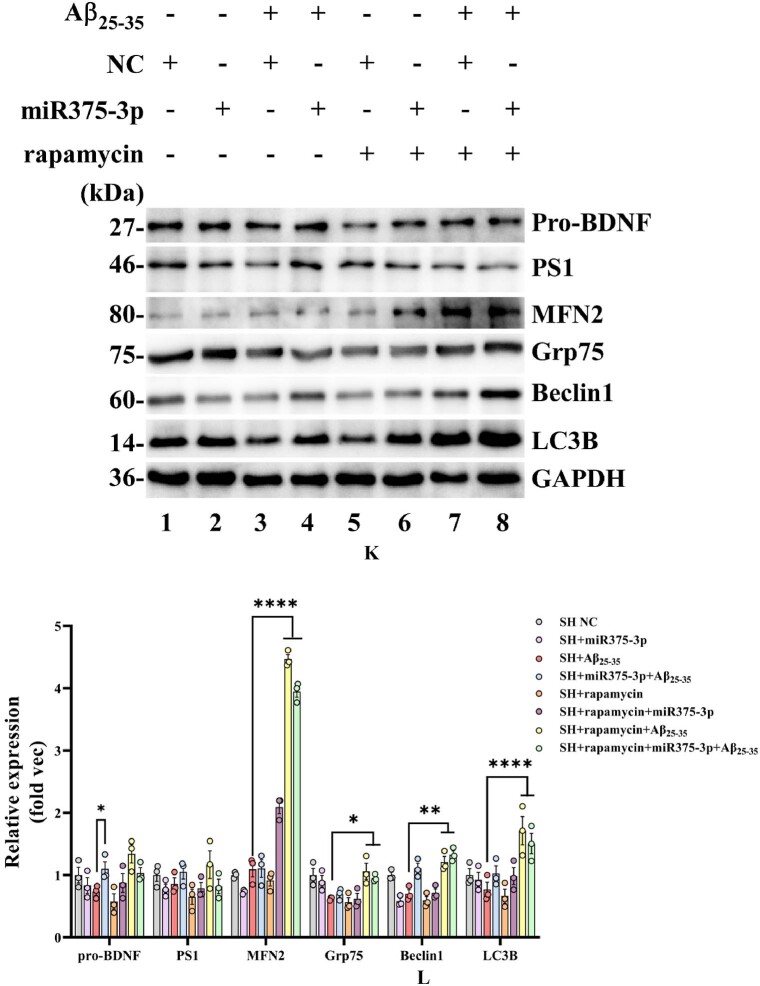
Fig. 3K and L Western blot analysis of protein expression in Aβ25-35-induced SH-SY5Y cell after miR375-3p overexpression and rapamycin treatment. (K) Protein expression levels of LC3B, PS1, pro-BDNF, MFN2, Grp75, and Beclin1 in each group of cells. (L) Grayscale values of each group were quantified and analyzed using ImageJ. GAPDH was used as an internal reference.All data are presented as the mean ± SEM of at least three independent experiments and were compared using one-way ANOVA with Tukey's multiple comparisons test. ∗p < 0.05, ∗∗p < 0.01, ∗∗∗p < 0.001, ∗∗∗∗p < 0.0001.
Fig. 3K and L Western blot analysis of protein expression in Aβ25-35-induced SH-SY5Y cell after miR375-3p overexpression and rapamycin treatment. (K) Protein expression levels of LC3B, PS1, pro-BDNF, MFN2, Grp75, and Beclin1 in each group of cells. (L) Grayscale values of each group were quantified and analyzed using ImageJ. GAPDH was used as an internal reference.All data are presented as the mean ± SEM of at least three independent experiments and were compared using one-way ANOVA with Tukey's multiple comparisons test. ∗p < 0.05, ∗∗p < 0.01, ∗∗∗p < 0.001, ∗∗∗∗p < 0.0001.CC BY · PubMed Central
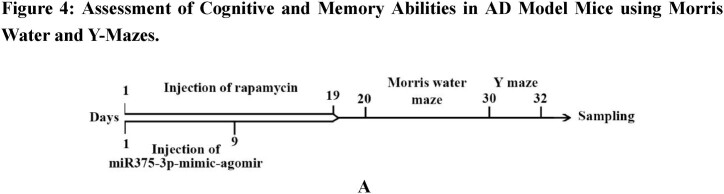
Fig. 4A Design of the injection schedule and behavioral testing procedure. The APP/PS1 transgenic mice (28 weeks old) and wild-type (26 weeks old male) mice were used for this assay.
Fig. 4A Design of the injection schedule and behavioral testing procedure. The APP/PS1 transgenic mice (28 weeks old) and wild-type (26 weeks old male) mice were used for this assay.CC BY · PubMed Central
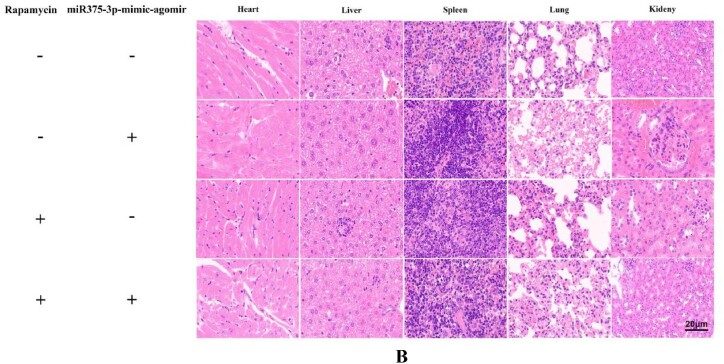
Fig. 4B Rapamycin and miR-375-3p-mimic-agomir were administered through intraperitoneal and tail vein injections in APP/PS1 Tg mice. After treatment completion, organ samples were collected, and tissue sections were prepared for H&E staining analysis; Scale bar = 20 μm.
Fig. 4B Rapamycin and miR-375-3p-mimic-agomir were administered through intraperitoneal and tail vein injections in APP/PS1 Tg mice. After treatment completion, organ samples were collected, and tissue sections were prepared for H&E staining analysis; Scale bar = 20 μm.CC BY · PubMed Central
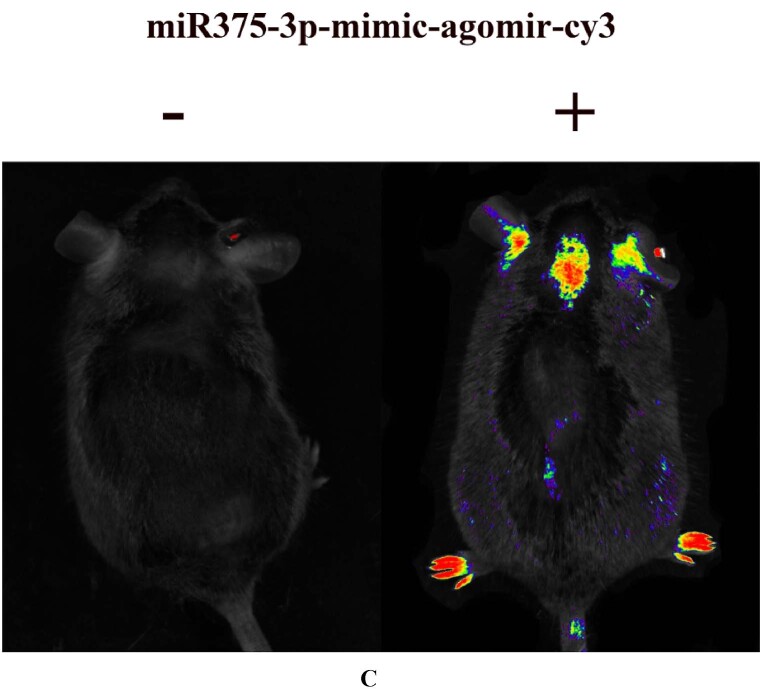
Fig. 4C APP/PS1 transgenic mice tail veins were injected with 0.8 % physiological saline and miR-375-3p-mimic-agomir-cy3. After 24 h, the mice were anesthetized, and live imaging was conducted using a 633 nm channel.
Fig. 4C APP/PS1 transgenic mice tail veins were injected with 0.8 % physiological saline and miR-375-3p-mimic-agomir-cy3. After 24 h, the mice were anesthetized, and live imaging was conducted using a 633 nm channel.CC BY · PubMed Central
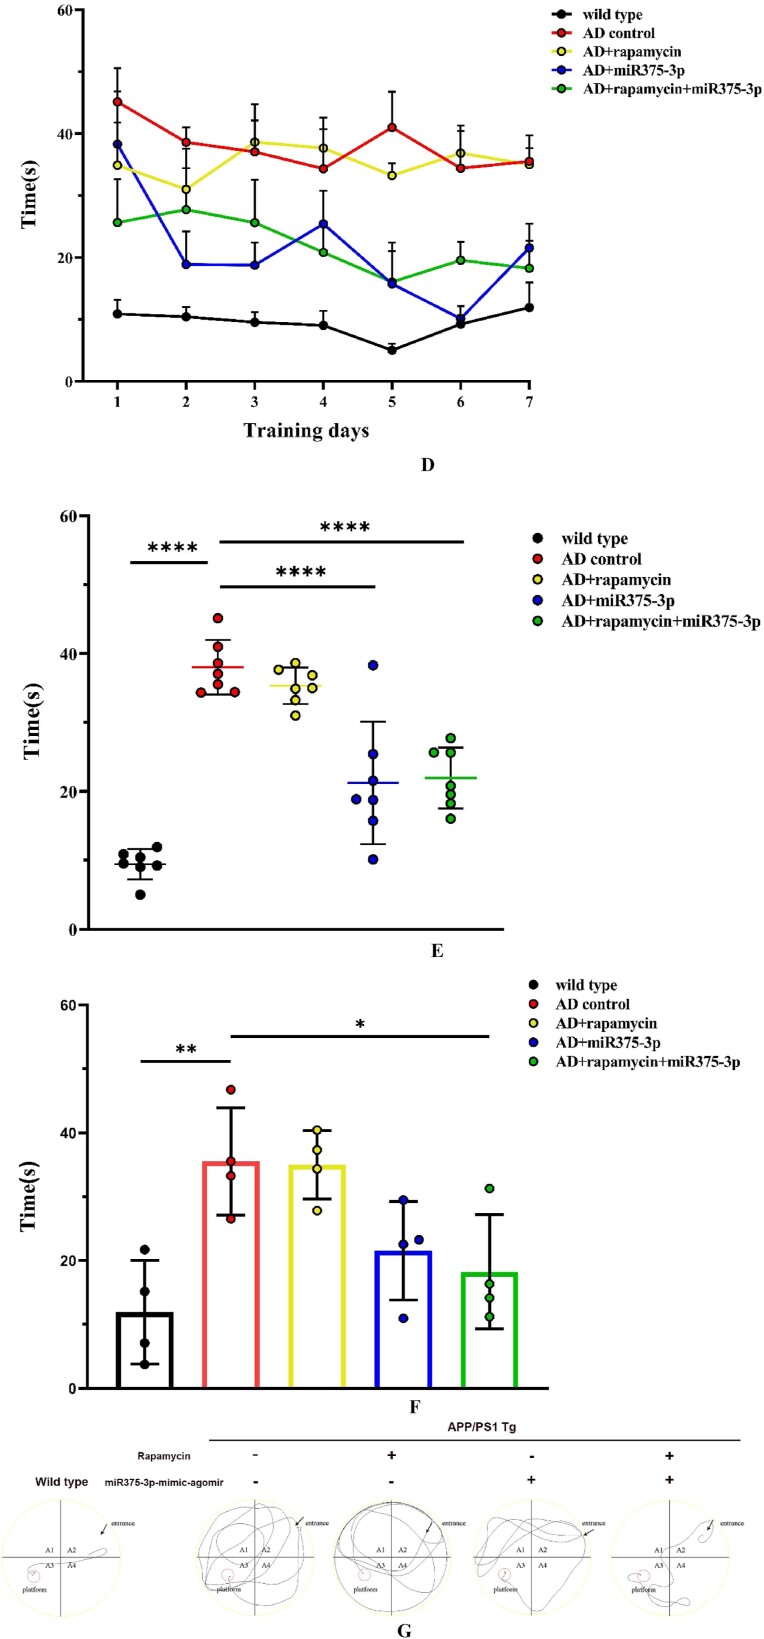
Fig. 4D–G Morris Water Maze testing of memory in APP/PS1 transgenic mice. (D) The time curve indicates the time each group of mice took to reach the hidden platform during the experimental stages. (E) Cumulative escape latency for each group during the experimental stages. (F) Escape latency for each group on the final day of the experimental stage. (G) Representative images of probe test movement trajectories. (H–J) Y-Maze analysis to test the cognitive abilities in APP/PS1 transgenic mice.
Fig. 4D–G Morris Water Maze testing of memory in APP/PS1 transgenic mice. (D) The time curve indicates the time each group of mice took to reach the hidden platform during the experimental stages. (E) Cumulative escape latency for each group during the experimental stages. (F) Escape latency for each group on the final day of the experimental stage. (G) Representative images of probe test movement trajectories. (H–J) Y-Maze analysis to test the cognitive abilities in APP/PS1 transgenic mice.CC BY · PubMed Central
Fig. 4H Percentage of correct alternations during the 10-min spontaneous alternation test.
Fig. 4H Percentage of correct alternations during the 10-min spontaneous alternation test.CC BY · PubMed Central
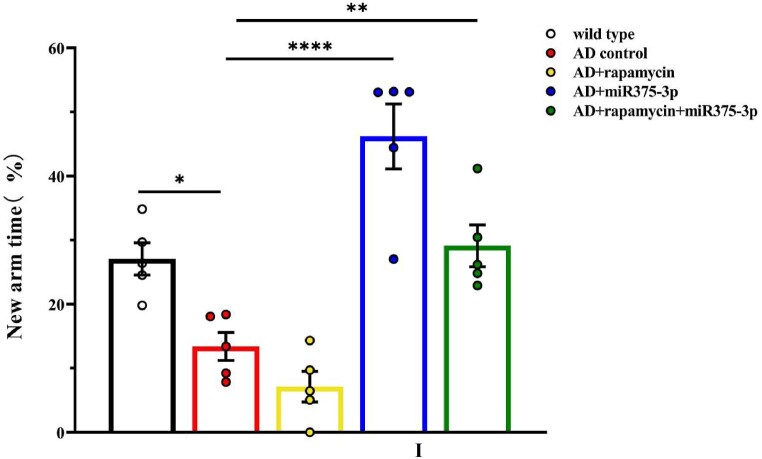
Fig. 4I Time spent in the new arm exploration for each group.
Fig. 4I Time spent in the new arm exploration for each group.CC BY · PubMed Central
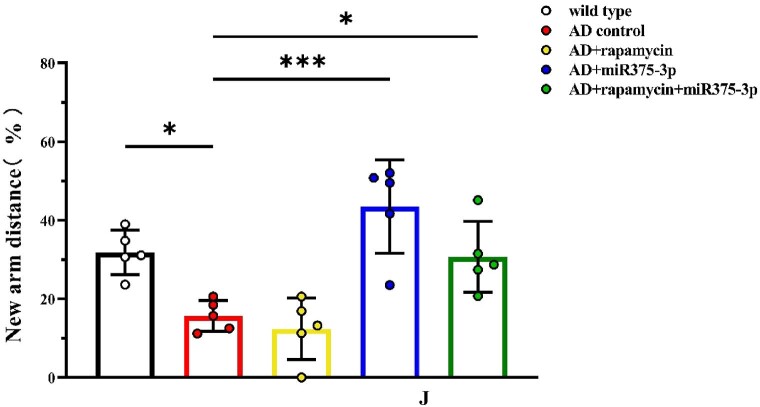
Fig. 4J Distance traveled in the new arm exploration for each group (n = 5/group). All data are presented as the mean ± SEM of at least three independent experiments and were compared using one-way ANOVA with Tukey's multiple comparisons test. ∗p < 0.05, ∗∗p < 0.01, ∗∗∗p < 0.001, ∗∗∗∗p < 0.0001.
Fig. 4J Distance traveled in the new arm exploration for each group (n = 5/group). All data are presented as the mean ± SEM of at least three independent experiments and were compared using one-way ANOVA with Tukey's multiple comparisons test. ∗p < 0.05, ∗∗p < 0.01, ∗∗∗p < 0.001, ∗∗∗∗p < 0.0001.CC BY · PubMed Central
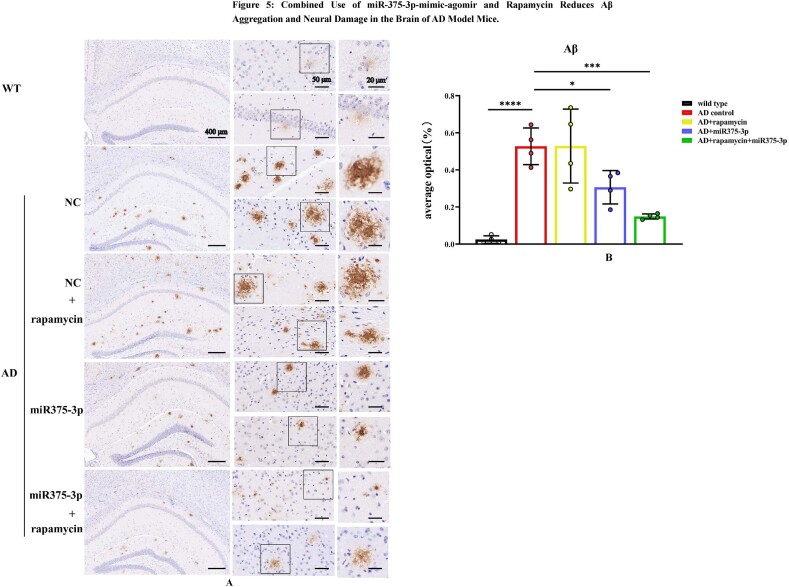
Fig. 5A and B Immunohistochemical staining images indicating Aβ aggregation in the hippocampal region of APP/PS1 Tg mice brains. (A) Immunohistochemistry analysis of Anti-Aβ stained sagittal brain tissue sections acquired from whole-brain samples from each group of mice. (B) Image-Pro Plus 6.0 was used to quantitatively process and analyze Aβ-positive expression plaques in each group.
Fig. 5A and B Immunohistochemical staining images indicating Aβ aggregation in the hippocampal region of APP/PS1 Tg mice brains. (A) Immunohistochemistry analysis of Anti-Aβ stained sagittal brain tissue sections acquired from whole-brain samples from each group of mice. (B) Image-Pro Plus 6.0 was used to quantitatively process and analyze Aβ-positive expression plaques in each group.CC BY · PubMed Central
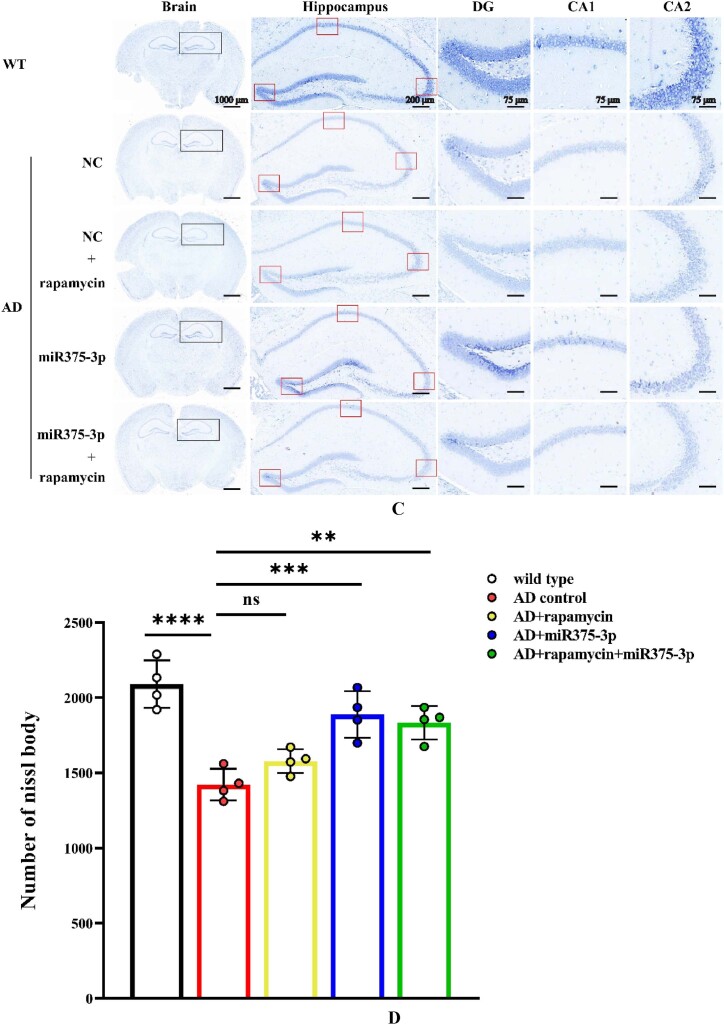
Fig. 5C and D Nissl staining to assess the number of Nissl bodies in the brains of APP/PS1 transgenic mice. (C) The total number of Nissl bodies in the hippocampus and cerebral cortex after brain sections were stained with Nissl solution. (D) Cell counting was performed to determine the number of Nissl bodies in the cerebral cortex of each sample.
Fig. 5C and D Nissl staining to assess the number of Nissl bodies in the brains of APP/PS1 transgenic mice. (C) The total number of Nissl bodies in the hippocampus and cerebral cortex after brain sections were stained with Nissl solution. (D) Cell counting was performed to determine the number of Nissl bodies in the cerebral cortex of each sample.CC BY · PubMed Central
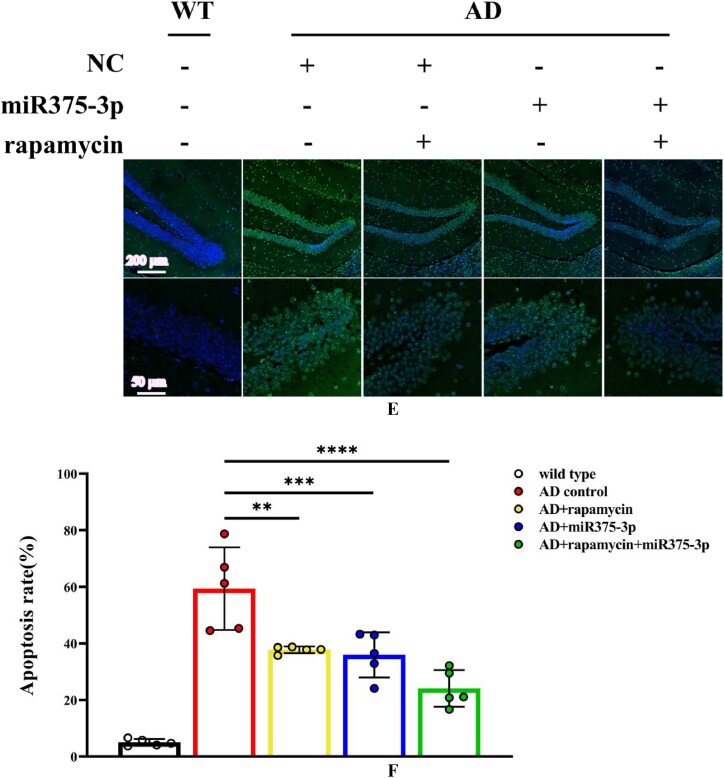
Fig. 5E and F Tunel staining was performed to detect the rate of cell apoptosis in the hippocampal region of APP/PS1 Tg mice brains. (E) Brain sections were treated with a Tunel probe for 60 min, and results were analyzed using a laser confocal microscope with an Alexa Fluor 488 channel. (F) Image-Pro Plus 6.0 was used to quantify the fluorescence intensity in brain sections from each group to calculate the apoptosis rate. All data are presented as the mean ± SEM of at least three independent experiments and were compared using one-way ANOVA with Tukey's multiple comparisons test. ∗p < 0.05, ∗∗p < 0.01, ∗∗∗p < 0.001, ∗∗∗∗p < 0.0001.
Fig. 5E and F Tunel staining was performed to detect the rate of cell apoptosis in the hippocampal region of APP/PS1 Tg mice brains. (E) Brain sections were treated with a Tunel probe for 60 min, and results were analyzed using a laser confocal microscope with an Alexa Fluor 488 channel. (F) Image-Pro Plus 6.0 was used to quantify the fluorescence intensity in brain sections from each group to calculate the apoptosis rate. All data are presented as the mean ± SEM of at least three independent experiments and were compared using one-way ANOVA with Tukey's multiple comparisons test. ∗p < 0.05, ∗∗p < 0.01, ∗∗∗p < 0.001, ∗∗∗∗p < 0.0001.CC BY · PubMed Central
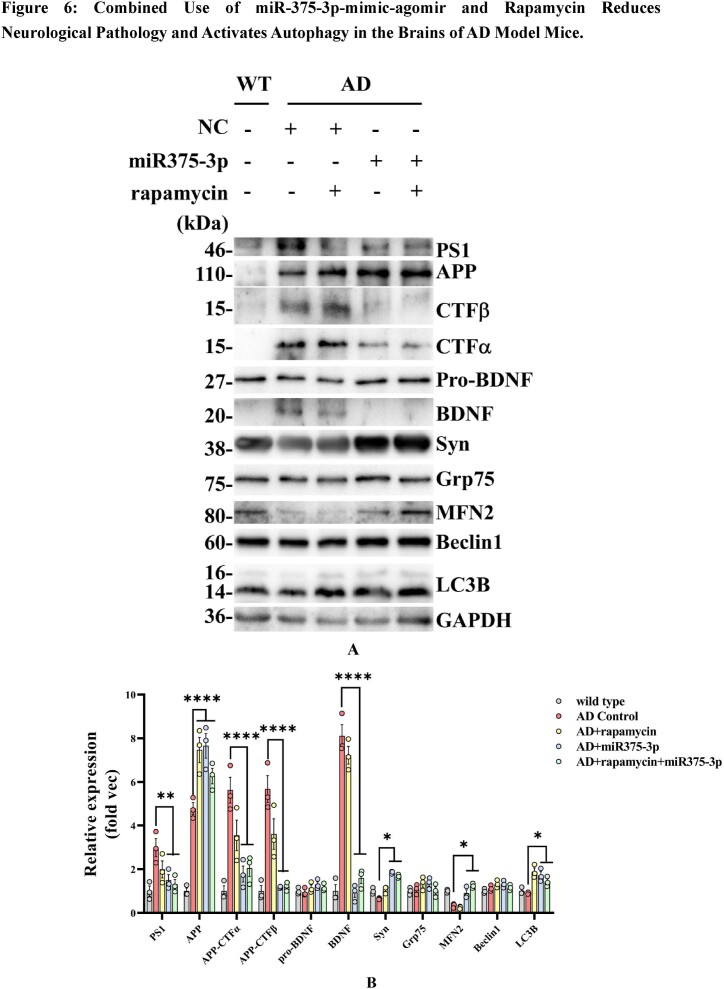
Fig. 6A and B Western blot detection of protein expression in the parietal and temporal lobes of the brains of various groups of APP/PS1 Tg mice. (A) Protein expression of AD pathological markers, such as PS1, APP, CTFα, CTFβ, BDNF, and Syn, as well as autophagy markers including Mfn2, Beclin1, Grp75, and LC3B. (B) The grayscale values of each group were quantified using ImageJ. GAPDH was employed as an internal reference.
Fig. 6A and B Western blot detection of protein expression in the parietal and temporal lobes of the brains of various groups of APP/PS1 Tg mice. (A) Protein expression of AD pathological markers, such as PS1, APP, CTFα, CTFβ, BDNF, and Syn, as well as autophagy markers including Mfn2, Beclin1, Grp75, and LC3B. (B) The grayscale values of each group were quantified using ImageJ. GAPDH was employed as an internal reference.CC BY · PubMed Central
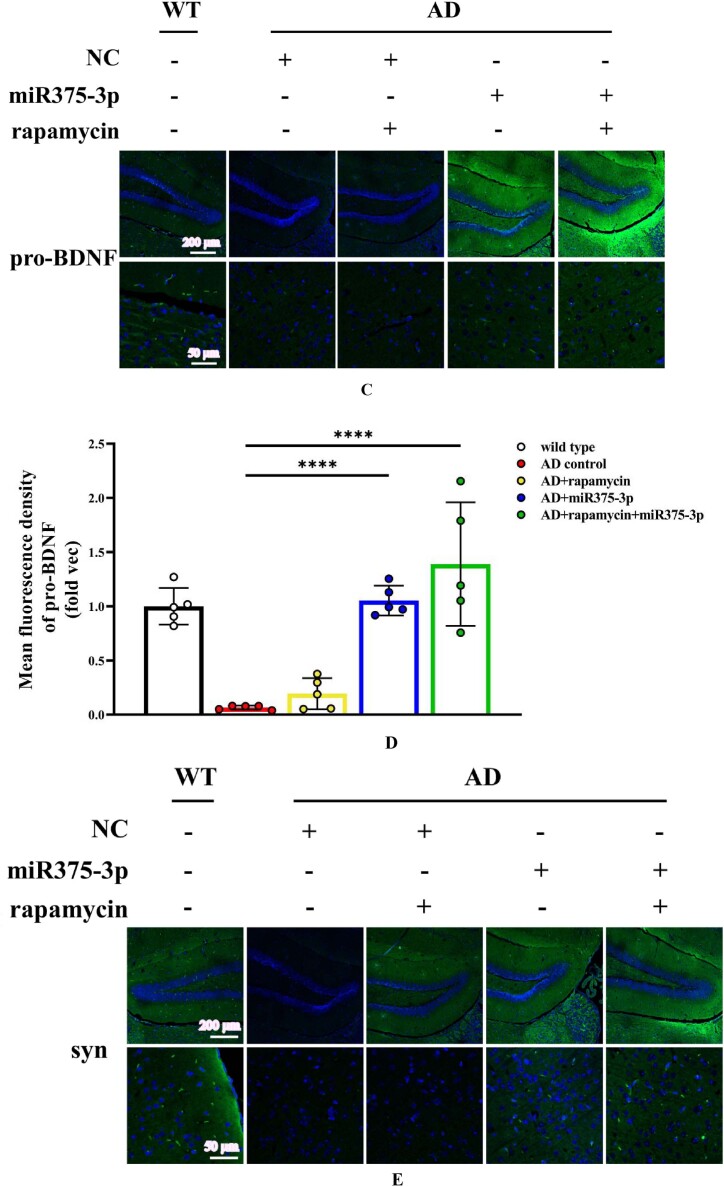
Fig. 6C–L Immunofluorescence staining was performed to detect the protein expression levels of BDNF and Syn in the hippocampal region of APP/PS1 Tg mice. (C, E, G, I, and K) Brain sections from each group were stained with Anti-BDNF (C), Anti-Syn (E), Anti-Beclin1 (G), Anti-LC3B (I), and Anti-PS1 antibodies (K) as well as FITC-conjugated secondary antibodies. (D, F, H, J, and L) The fluorescence intensity of each group was quantified and analyzed using image-pro-plus 6.0. The results were normalized relative to the expression levels of BDNF, Syn, Beclin1, LC3B, and PS1 in wild-type mice.
Fig. 6C–L Immunofluorescence staining was performed to detect the protein expression levels of BDNF and Syn in the hippocampal region of APP/PS1 Tg mice. (C, E, G, I, and K) Brain sections from each group were stained with Anti-BDNF (C), Anti-Syn (E), Anti-Beclin1 (G), Anti-LC3B (I), and Anti-PS1 antibodies (K) as well as FITC-conjugated secondary antibodies. (D, F, H, J, and L) The fluorescence intensity of each group was quantified and analyzed using image-pro-plus 6.0. The results were normalized relative to the expression levels of BDNF, Syn, Beclin1, LC3B, and PS1 in wild-type mice.CC BY · PubMed Central
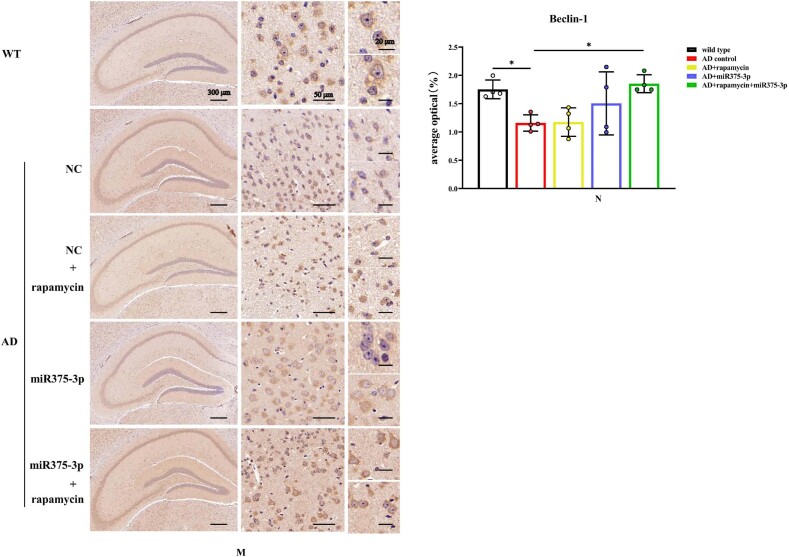
Fig. 6M and N Immunohistochemistry was performed to detect the protein expression of Beclin1 in the hippocampal region of APP/PS1 Tg mice. (M) Brain sections were stained using Anti-Beclin1 for immunohistochemistry. (N) Image-Pro Plus 6.0 was used to quantify and analyze the positivity rate of Beclin1 in each group.
Fig. 6M and N Immunohistochemistry was performed to detect the protein expression of Beclin1 in the hippocampal region of APP/PS1 Tg mice. (M) Brain sections were stained using Anti-Beclin1 for immunohistochemistry. (N) Image-Pro Plus 6.0 was used to quantify and analyze the positivity rate of Beclin1 in each group.CC BY · PubMed Central
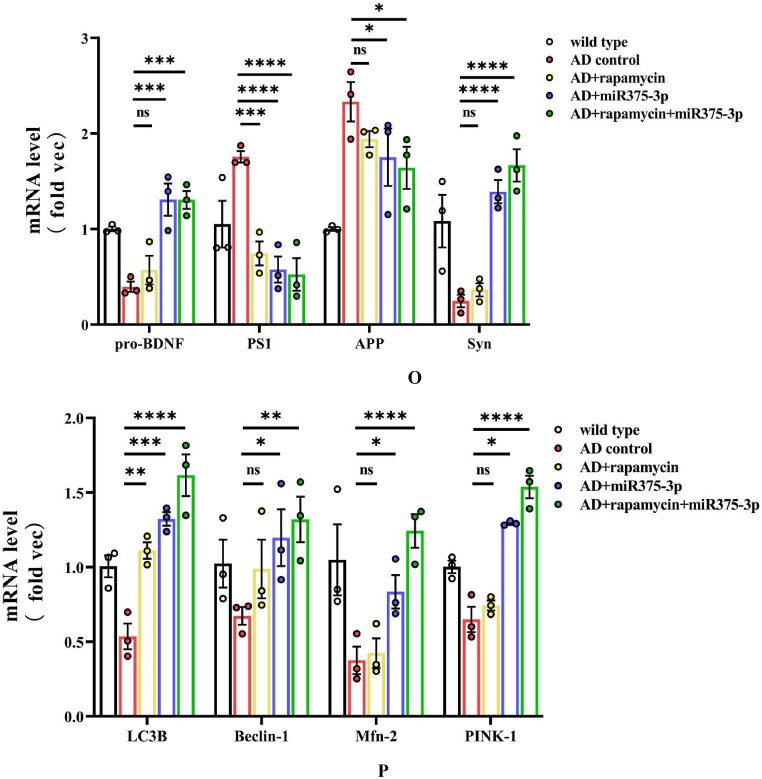
Fig. 6O and P qRT-PCR analysis of the mRNA expression levels in the mice. (O) qRT-PCR results of mRNA levels of AD markers: APP, PS1, BDNF, and Syn. Briefly, total RNA was extracted from the blood of each mouse group, reverse-transcribed, and then used as a template for qRT-PCR. (P) qRT-PCR results of mRNA levels of autophagy markers: LC3B, Beclin1, Pink1, and MFN2. All data are presented as the mean ± SEM of at least three independent experiments and were compared using one-way ANOVA with Tukey's multiple comparisons test. ∗p < 0.05, ∗∗p < 0.01, ∗∗∗p < 0.001, ∗∗∗∗p < 0.0001.
Fig. 6O and P qRT-PCR analysis of the mRNA expression levels in the mice. (O) qRT-PCR results of mRNA levels of AD markers: APP, PS1, BDNF, and Syn. Briefly, total RNA was extracted from the blood of each mouse group, reverse-transcribed, and then used as a template for qRT-PCR. (P) qRT-PCR results of mRNA levels of autophagy markers: LC3B, Beclin1, Pink1, and MFN2. All data are presented as the mean ± SEM of at least three independent experiments and were compared using one-way ANOVA with Tukey's multiple comparisons test. ∗p < 0.05, ∗∗p < 0.01, ∗∗∗p < 0.001, ∗∗∗∗p < 0.0001.CC BY · PubMed Central
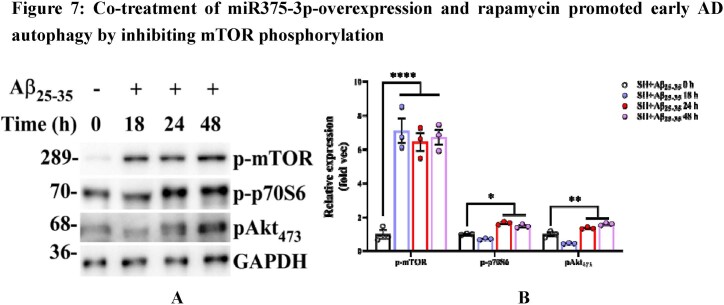
Fig. 7A and B Western blot analysis was conducted to assess the activation of mTOR pathway-related proteins under different Aβ25-35 induction time conditions. (A) Phosphorylation activation status of mTOR, p70S6, and AKT in SH-SY5Y cells. (B) Grayscale values of each group were quantified and analyzed using ImageJ. GAPDH was used as an internal reference.
Fig. 7A and B Western blot analysis was conducted to assess the activation of mTOR pathway-related proteins under different Aβ25-35 induction time conditions. (A) Phosphorylation activation status of mTOR, p70S6, and AKT in SH-SY5Y cells. (B) Grayscale values of each group were quantified and analyzed using ImageJ. GAPDH was used as an internal reference.CC BY · PubMed Central
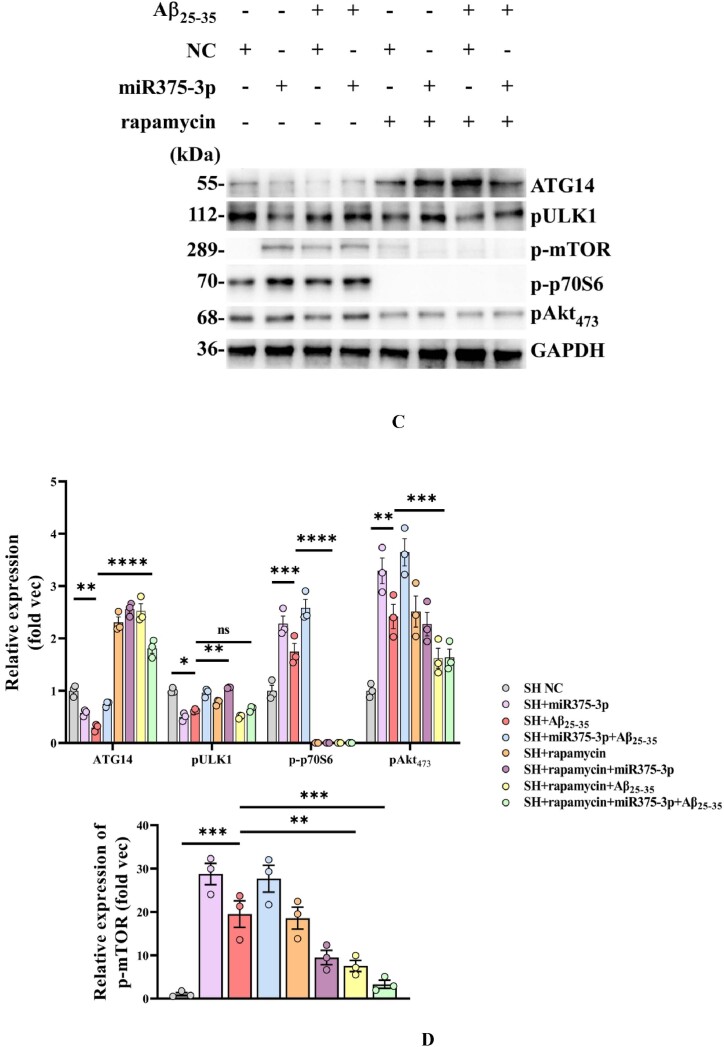
Fig. 7C and D Western blot evaluation of mTOR pathway-related protein expression in various groups of SH-SY5Y cells. (C) Protein expression of phosphorylated mTOR, ULK1, p70S6, and AKT in SH-SY5Y cells. (D) Grayscale values of each group were quantified using ImageJ with GAPDH as an internal reference.
Fig. 7C and D Western blot evaluation of mTOR pathway-related protein expression in various groups of SH-SY5Y cells. (C) Protein expression of phosphorylated mTOR, ULK1, p70S6, and AKT in SH-SY5Y cells. (D) Grayscale values of each group were quantified using ImageJ with GAPDH as an internal reference.CC BY · PubMed Central
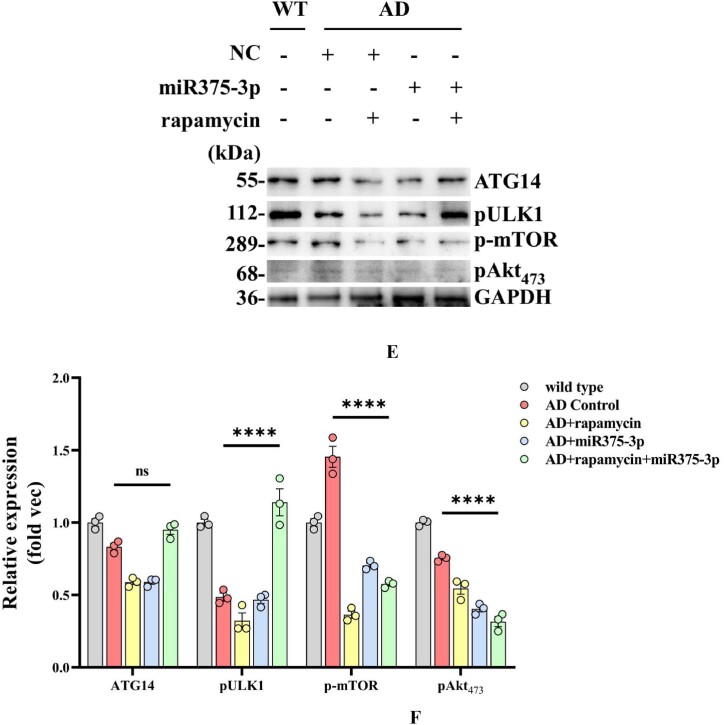
Fig. 7E and F Western blot analysis was conducted to examine the activation of mTOR pathway-related proteins in the parietal and temporal lobes of the brains of APP/PS1 Tg mice. (E) Protein expression levels of phosphorylated mTOR, ULK1, AKT, and ATG14. (F) Grayscale values of each group were quantified and analyzed using ImageJ. GAPDH was used as an internal reference.
Fig. 7E and F Western blot analysis was conducted to examine the activation of mTOR pathway-related proteins in the parietal and temporal lobes of the brains of APP/PS1 Tg mice. (E) Protein expression levels of phosphorylated mTOR, ULK1, AKT, and ATG14. (F) Grayscale values of each group were quantified and analyzed using ImageJ. GAPDH was used as an internal reference.CC BY · PubMed Central
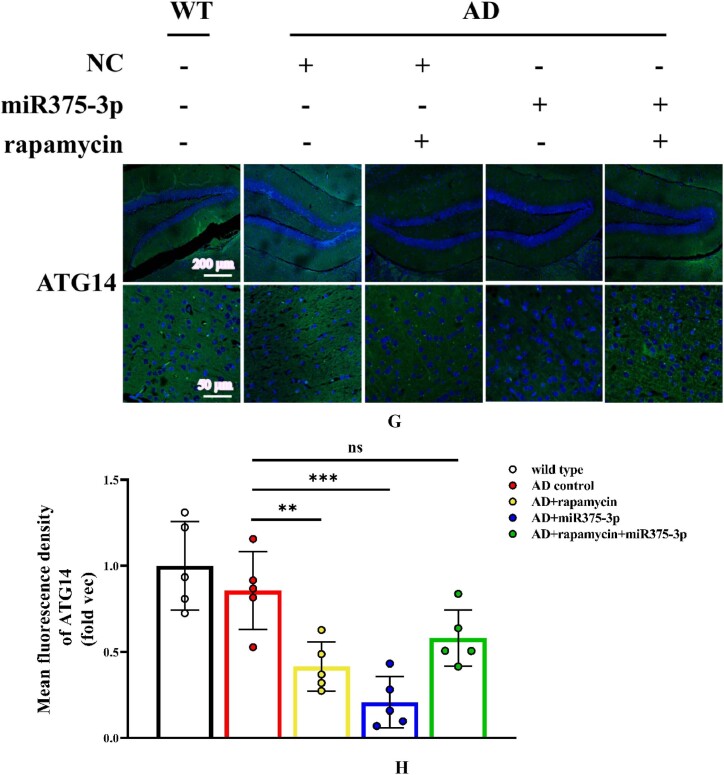
Fig. 7G and H Immunofluorescence staining images indicate the protein expression levels of ATG14 in the hippocampal region of APP/PS1 Tg mice. (G) Tissue sections were stained using Anti-ATG14 and FITC-conjugated secondary antibodies. (H) The fluorescence intensity of each group was quantified and analyzed using image-pro-plus 6.0. The results were normalized relative to the expression levels of ATG14 in wild-type mice. All data are presented as the mean ± SEM of at least three independent experiments and were compared using one-way ANOVA with Tukey's multiple comparisons test. ∗p < 0.05, ∗∗p < 0.01, ∗∗∗p < 0.001, ∗∗∗∗p < 0.0001.
Fig. 7G and H Immunofluorescence staining images indicate the protein expression levels of ATG14 in the hippocampal region of APP/PS1 Tg mice. (G) Tissue sections were stained using Anti-ATG14 and FITC-conjugated secondary antibodies. (H) The fluorescence intensity of each group was quantified and analyzed using image-pro-plus 6.0. The results were normalized relative to the expression levels of ATG14 in wild-type mice. All data are presented as the mean ± SEM of at least three independent experiments and were compared using one-way ANOVA with Tukey's multiple comparisons test. ∗p < 0.05, ∗∗p < 0.01, ∗∗∗p < 0.001, ∗∗∗∗p < 0.0001.CC BY · PubMed Central
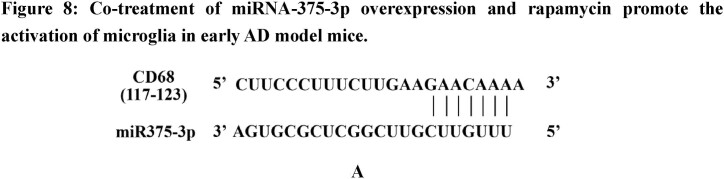
Fig. 8A Prediction of the interaction site between miR-375-3p and CD68 protein.
Fig. 8A Prediction of the interaction site between miR-375-3p and CD68 protein.CC BY · PubMed Central
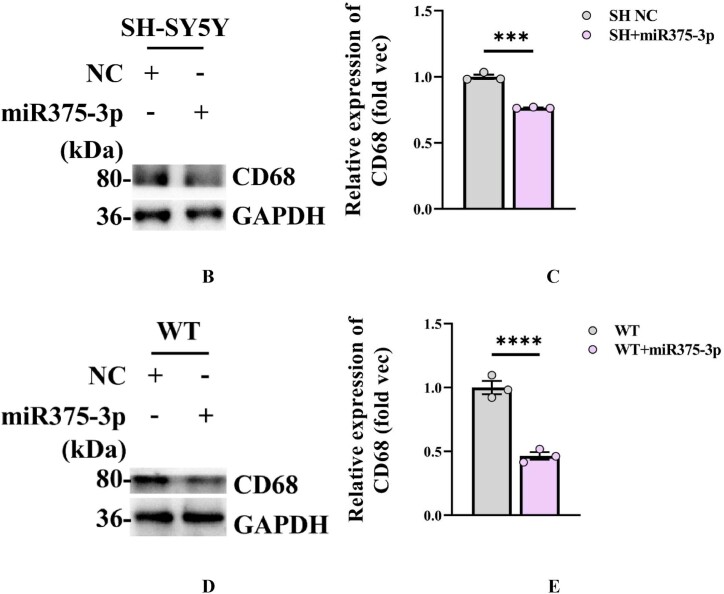
Fig. 8B–E Western blot analysis was performed to detect CD68 protein expression in SH-SY5Y cells (B) as well as in the parietal and temporal lobes of the brains of wild-type mice after (D) miR375-3p overexpression. Grayscale values of CD68 in each group were quantified using ImageJ. GAPDH levels in SH-SY5Y cells (C) and wild-type mice (E) were assessed and set as an internal reference.
Fig. 8B–E Western blot analysis was performed to detect CD68 protein expression in SH-SY5Y cells (B) as well as in the parietal and temporal lobes of the brains of wild-type mice after (D) miR375-3p overexpression. Grayscale values of CD68 in each group were quantified using ImageJ. GAPDH levels in SH-SY5Y cells (C) and wild-type mice (E) were assessed and set as an internal reference.CC BY · PubMed Central
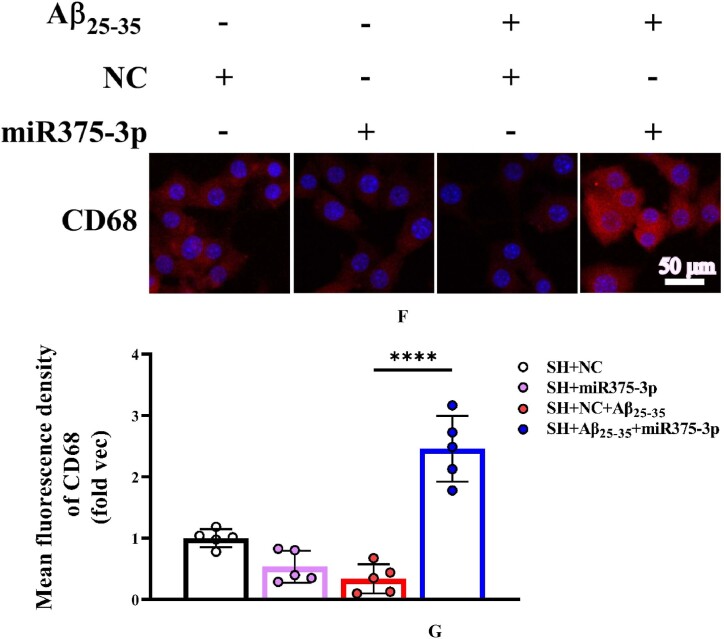
Fig. 8F and G Immunofluorescence staining was conducted to detect the protein expression levels of CD68 in various groups of SH-SY5Y cells. (F) Staining was performed using Anti-CD68 and PE-conjugated secondary antibodies (400 × ); Scale bar = 50 μm. (G) The fluorescence intensity of each group was quantified and analyzed using image-pro-plus 6.0. The results were normalized relative to the expression levels of CD68 in SH + NC as the folder.
Fig. 8F and G Immunofluorescence staining was conducted to detect the protein expression levels of CD68 in various groups of SH-SY5Y cells. (F) Staining was performed using Anti-CD68 and PE-conjugated secondary antibodies (400 × ); Scale bar = 50 μm. (G) The fluorescence intensity of each group was quantified and analyzed using image-pro-plus 6.0. The results were normalized relative to the expression levels of CD68 in SH + NC as the folder.CC BY · PubMed Central
Fig. 8H and I Western blot analysis was conducted to evaluate the expression of glial cell markers in various groups of SH-SY5Y cells. (H) Protein expression levels of CD80, Iba1, and GFAP. (I) Grayscale values of each group were quantified and analyzed using ImageJ. GAPDH was employed as an internal reference.
Fig. 8H and I Western blot analysis was conducted to evaluate the expression of glial cell markers in various groups of SH-SY5Y cells. (H) Protein expression levels of CD80, Iba1, and GFAP. (I) Grayscale values of each group were quantified and analyzed using ImageJ. GAPDH was employed as an internal reference.CC BY · PubMed Central
Fig. 8J and K Western blot analysis was performed to assess the expression of glial cell marker proteins in the parietal and temporal lobes of the brains of APP/PS1 Tg mice. (J) Protein expression levels of GFAP, CD80, CD68, and Iba1. (K) Grayscale values of each group were quantified and analyzed using ImageJ. GAPDH was employed as an internal reference.
Fig. 8J and K Western blot analysis was performed to assess the expression of glial cell marker proteins in the parietal and temporal lobes of the brains of APP/PS1 Tg mice. (J) Protein expression levels of GFAP, CD80, CD68, and Iba1. (K) Grayscale values of each group were quantified and analyzed using ImageJ. GAPDH was employed as an internal reference.CC BY · PubMed Central
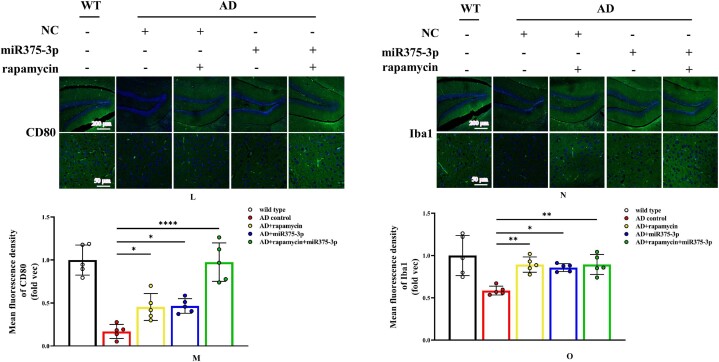
Fig. 8L–O Immunofluorescence staining was conducted to detect the protein expression levels of CD80 and Iba1 in the hippocampal region of APP/PS1 Tg mice. (L and N) Staining was performed using Anti-CD80 (L) and Anti-Iba1 (N) antibodies and FITC-conjugated secondary antibodies (100 × , 400 × ), scale bar: 200 μm, 50 μm. (L and N) The fluorescence intensity of each group was quantified using image-pro-plus 6.0 and analyzed, with results displayed relative to the expression levels of CD80 (M) and Iba1 (O) in wild-type mice as the folder.
Fig. 8L–O Immunofluorescence staining was conducted to detect the protein expression levels of CD80 and Iba1 in the hippocampal region of APP/PS1 Tg mice. (L and N) Staining was performed using Anti-CD80 (L) and Anti-Iba1 (N) antibodies and FITC-conjugated secondary antibodies (100 × , 400 × ), scale bar: 200 μm, 50 μm. (L and N) The fluorescence intensity of each group was quantified using image-pro-plus 6.0 and analyzed, with results displayed relative to the expression levels of CD80 (M) and Iba1 (O) in wild-type mice as the folder.CC BY · PubMed Central
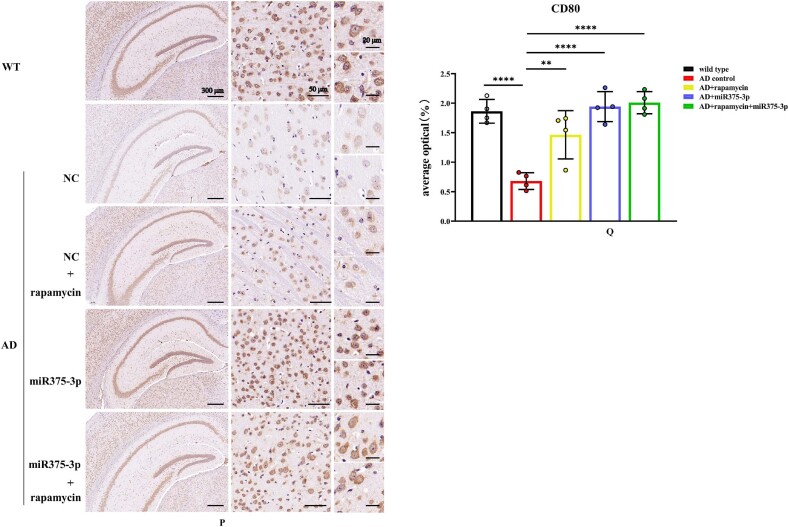
Fig. 8P–S Immunohistochemical staining images indicating the distribution and positive expression of CD80 and Iba1 in the hippocampal region of APP/PS1 Tg mice. (P and R) Brain tissue sections were stained using Anti-CD80 (P) and Anti-Iba1 (R) antibodies for immunohistochemistry. (Q and S) The positive expression patches of CD80 (Q) and Iba1 (S) in each group were quantified and analyzed using image-pro-plus 6.0.
Fig. 8P–S Immunohistochemical staining images indicating the distribution and positive expression of CD80 and Iba1 in the hippocampal region of APP/PS1 Tg mice. (P and R) Brain tissue sections were stained using Anti-CD80 (P) and Anti-Iba1 (R) antibodies for immunohistochemistry. (Q and S) The positive expression patches of CD80 (Q) and Iba1 (S) in each group were quantified and analyzed using image-pro-plus 6.0.CC BY · PubMed Central
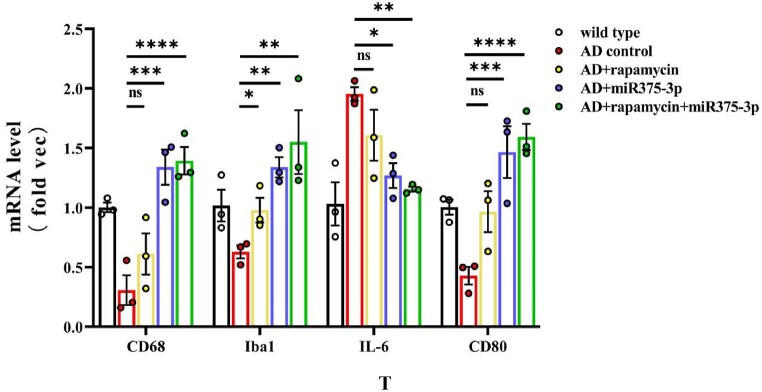
Fig. 8T qRT-PCR to measure the mRNA expression levels of CD68, CD80, Iba1, and IL-6 in the mice.
Fig. 8T qRT-PCR to measure the mRNA expression levels of CD68, CD80, Iba1, and IL-6 in the mice.CC BY · PubMed Central
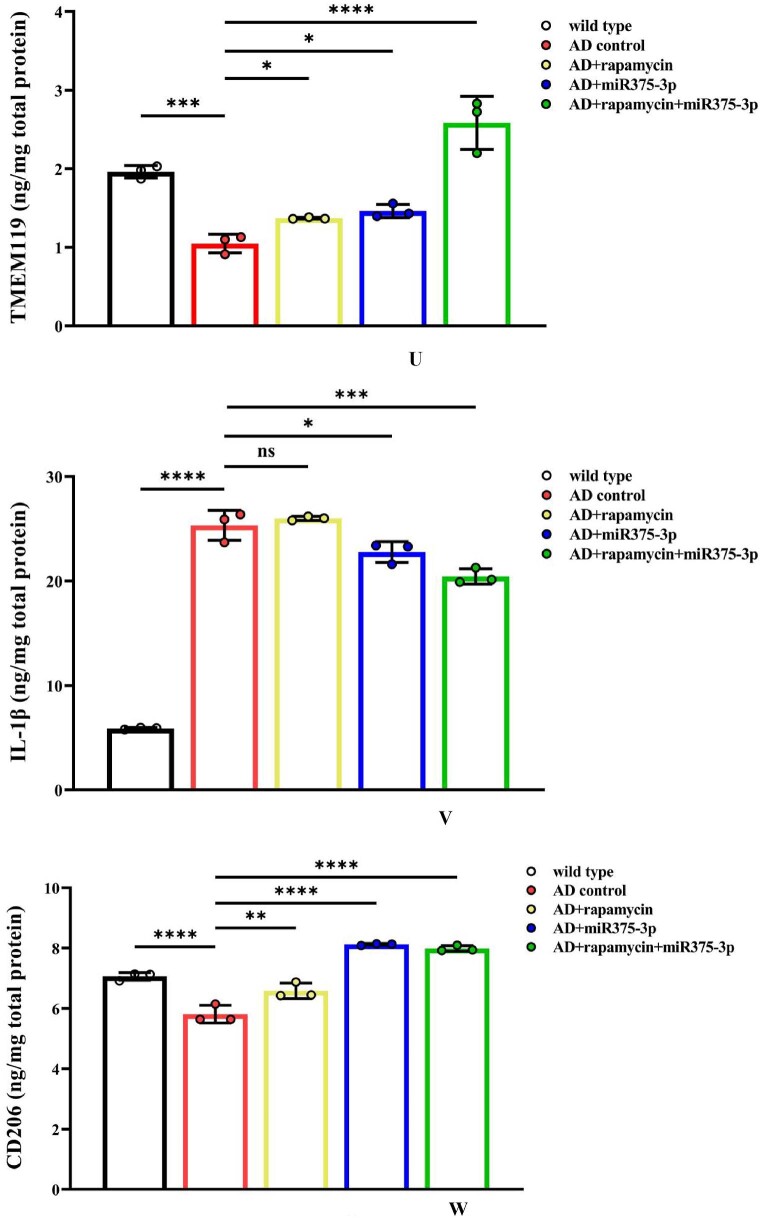
Fig. 8U–W Elisa was performed to detect the protein levels of TMEM119 (U), IL-1β (V), and CD206 (W) in the brains of each group of mice. For each group, three replicates were set. Standard curves were drawn using Origin8.0. Data were summarized and analyzed using image-pro-plus 6.0.
Fig. 8U–W Elisa was performed to detect the protein levels of TMEM119 (U), IL-1β (V), and CD206 (W) in the brains of each group of mice. For each group, three replicates were set. Standard curves were drawn using Origin8.0. Data were summarized and analyzed using image-pro-plus 6.0.CC BY · PubMed Central
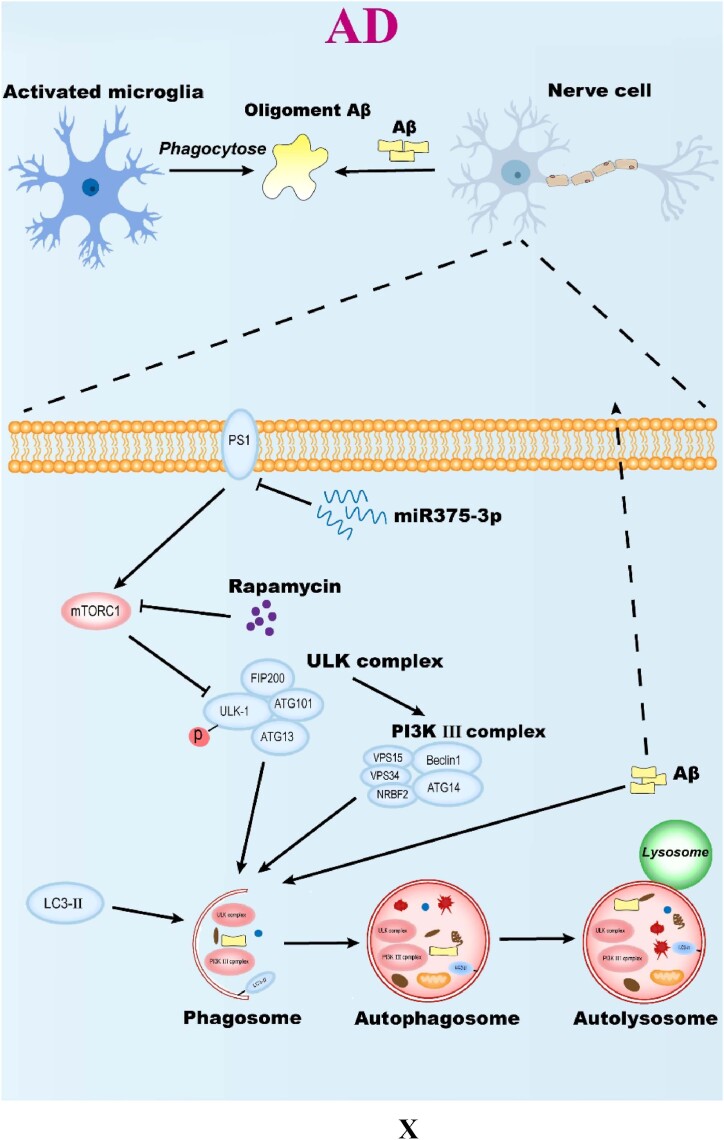
Fig. 8X Molecular mechanism of overexpression of miR375-3p combined with rapamycin to clear Aβ deposition in AD environment. All data are presented as the mean ± SEM of at least three independent experiments and were compared using one-way ANOVA with Tukey's multiple comparisons test. ∗p < 0.05, ∗∗p < 0.01, ∗∗∗p < 0.001, ∗∗∗∗p < 0.0001.
Fig. 8X Molecular mechanism of overexpression of miR375-3p combined with rapamycin to clear Aβ deposition in AD environment. All data are presented as the mean ± SEM of at least three independent experiments and were compared using one-way ANOVA with Tukey's multiple comparisons test. ∗p < 0.05, ∗∗p < 0.01, ∗∗∗p < 0.001, ∗∗∗∗p < 0.0001.CC BY · PubMed Central

Verification

Claims the paper makes

The claims and statistics of this paper haven’t been checked yet.

Run the check — free, no account needed. It reads the open-access text and checks the sources it cites.

A few free checks a day · papers already verified open instantly · results are public

Claims other papers make about this one

Each is checked against this paper’s own text: does it say what the citing paper says it does?

Self-check

Percentages, sums and reported differences re-computed from the paper’s own numbers.

The self-check needs the paper’s full text.

Citations

Cites

Research works printed but not linked: 30

  1. 2023, vol. 19, 1598
  2. Cummings, 2019, The "rights" of precision drug development for Alzheimer's disease, Alzheimer's Res. Ther., 11, 76, 10.1186/s13195-019-0529-5 · DOI
  3. Xia, 2021, "Don't Phos over Tau": recent developments in clinical biomarkers and therapies targeting tau phosphorylation in Alzheimer's disease and other tauopathies, Mol. Neurodegener., 16, 37, 10.1186/s13024-021-00460-5 · DOI
  4. Rabin, 2018, Interactive associations of Vascular risk and beta-amyloid Burden with cognitive decline in clinically normal elderly individuals: findings from the harvard aging brain study, JAMA Neurol., 75, 1124, 10.1001/jamaneurol.2018.1123 · DOI · Paper page
  5. Gu, 2019, Genetic influences on white matter and metabolism abnormal change in Alzheimer's disease: meta-analysis for neuroimaging research on presenilin 1 mutation, Clin. Neurol. Neurosurg., 177, 47, 10.1016/j.clineuro.2018.12.016 · DOI
  6. Zhang, 2022, Impairment of the autophagy-lysosomal pathway in Alzheimer's diseases: pathogenic mechanisms and therapeutic potential, Acta Pharm. Sin. B, 12, 1019, 10.1016/j.apsb.2022.01.008 · DOI
  7. Davoody, 2023, mTOR signaling and Alzheimer's disease: what we know and where we are?, CNS Neurosci. Ther.
  8. Morawe, 2022, Pharmacological mTOR-inhibition facilitates clearance of AD-related tau aggregates in the mouse brain, Eur. J. Pharmacol., 934, 10.1016/j.ejphar.2022.175301 · DOI
  9. Liu, 2021, Geniposide protection against Abeta(1-42) toxicity correlates with mTOR inhibition and enhancement of autophagy, J. Integr. Neurosci., 20, 67, 10.31083/j.jin.2021.01.242 · DOI
  10. Amin, 2023, Autophagy prevents microglial senescence, Nat. Cell Biol., 25, 923, 10.1038/s41556-023-01168-y · DOI
  11. Fujikawa, 2023, The functions and phenotypes of microglia in Alzheimer's disease, Cells-Basel, 12
  12. Chakrabarty, 2012, Hippocampal expression of murine IL-4 results in exacerbation of amyloid deposition, Mol. Neurodegener., 7, 36, 10.1186/1750-1326-7-36 · DOI · Paper page
  13. Hussen, 2021, MicroRNA: a signature for cancer progression, Biomedicine & pharmacotherapy = Biomedecine & pharmacotherapie, 138
  14. Guevremont, 2022, Plasma microRNA vary in association with the progression of Alzheimer's disease, Alzheimer's Dementia, 14
  15. Wang, 2023, The potential of targeting microRNA-23b-3p signaling in Alzheimer's disease: opinions on recent findings, Front. Pharmacol., 14
  16. Bekris, 2015, The biomarker and therapeutic potential of miRNA in Alzheimer's disease, Neurodegener. Dis. Manag., 5, 61, 10.2217/nmt.14.52 · DOI
  17. Mall, 2013, Stability of miRNA in human urine supports its biomarker potential, Biomarkers Med., 7, 623, 10.2217/bmm.13.44 · DOI
  18. Zhai, 2021, ADMSC Exo-MicroRNA-22 improve neurological function and neuroinflammation in mice with Alzheimer's disease, J. Cell Mol. Med., 25, 7513, 10.1111/jcmm.16787 · DOI
  19. Mai, 2019, Intranasal administration of miR-146a agomir rescued the pathological process and cognitive impairment in an AD mouse model, molecular therapy, Nucleic acids, 18, 681, 10.1016/j.omtn.2019.10.002 · DOI
  20. Kim, 2018, The microRNA miR-7a-5p ameliorates ischemic brain damage by repressing α-synuclein, Sci. Signal., 11, 10.1126/scisignal.aat4285 · DOI
  21. Yu, 2021, MicroRNA-99b-3p promotes angiotensin II-induced cardiac fibrosis in mice by targeting GSK-3β, Acta Pharmacol. Sin., 42, 715, 10.1038/s41401-020-0498-z · DOI
  22. Song, 2022, MicroRNA-210 controls mitochondrial metabolism and protects heart function in myocardial infarction, Circulation, 145, 1140, 10.1161/CIRCULATIONAHA.121.056929 · DOI
  23. Zhang, 2018, Metformin synergizes with rapamycin to inhibit the growth of pancreatic cancer in vitro and in vivo, Oncol. Lett., 15, 1811
  24. Othman, 2021, Morris water maze: a versatile and pertinent tool for assessing spatial learning and memory, Exp Anim Tokyo, 71, 264, 10.1538/expanim.21-0120 · DOI
  25. Li, 2014, Rapamycin: one drug, many effects, Cell Metab, 19, 373, 10.1016/j.cmet.2014.01.001 · DOI · Paper page
  26. Wei, 2022, Different phenotypes of microglia in animal models of Alzheimer disease, Immun. Ageing, 19, 10.1186/s12979-022-00300-0 · DOI
  27. Schmukler, 2020, Autophagy induction in the treatment of Alzheimer's disease, Drug Dev. Res., 81, 184, 10.1002/ddr.21605 · DOI
  28. Scheltens, 2021, Alzheimer's disease, Lancet, 397, 1577, 10.1016/S0140-6736(20)32205-4 · DOI · Paper page
  29. Marques-Ramos, 2023, Expression of mTOR in normal and pathological conditions, Mol. Cancer, 22, 10.1186/s12943-023-01820-z · DOI
  30. Tang, 2016, Differential roles of M1 and M2 microglia in neurodegenerative diseases, Mol. Neurobiol., 53, 1181, 10.1007/s12035-014-9070-5 · DOI · Paper page

Cited by

Sorted by citations

See all 5

Metadata

Authors
Wang, Y., Xiao, Z., Yin, H., Ren, Z., Ma, X., Wang, Y., Zhang, Y., Fu, X., Zhang, F., & Zeng, L.
Venue
Heliyon
Publisher
Elsevier BV
Published
2024-10
Volume
10
Issue
19
Pages
e37589
ISSN
2405-8440
Cited by
5
References
13
Language
en
Funders
  • Department of Science and Technology of Jilin Province (YDZJ202301ZYTS536)
  • National Key Research and Development Program of China (2021YFA1500400)

About these checks

Registry, retraction, Cites and statistics results are computed, not judged, with one exception: a printed reference that no index lists is read once by a model before it counts as a citation error. Claims are extracted by a model and kept only when their quote appears verbatim in the text; each cited source is then checked, with a model’s help, for whether it says what the claim relies on. Those verdicts can be wrong — read the claim’s quote and the cited source before relying on one.

Statistics and arithmetic are recomputed, not judged.

Confidence bands are shown only for fields calibrated on our annotated test set. None is calibrated yet, so no band is shown.

What counts as a claim ›How we measure confidence ›How we check this ›

Are you an author, or do you see a problem with this page? Request a review