

The DOI matches its Crossref record; 45 of the 45 references it cites were found in a registry or an index.
The Environmental Sensor AHR Protects from Inflammatory Damage by Maintaining Intestinal Stem Cell Homeostasis and Barrier Integrity
Open accessAbstract
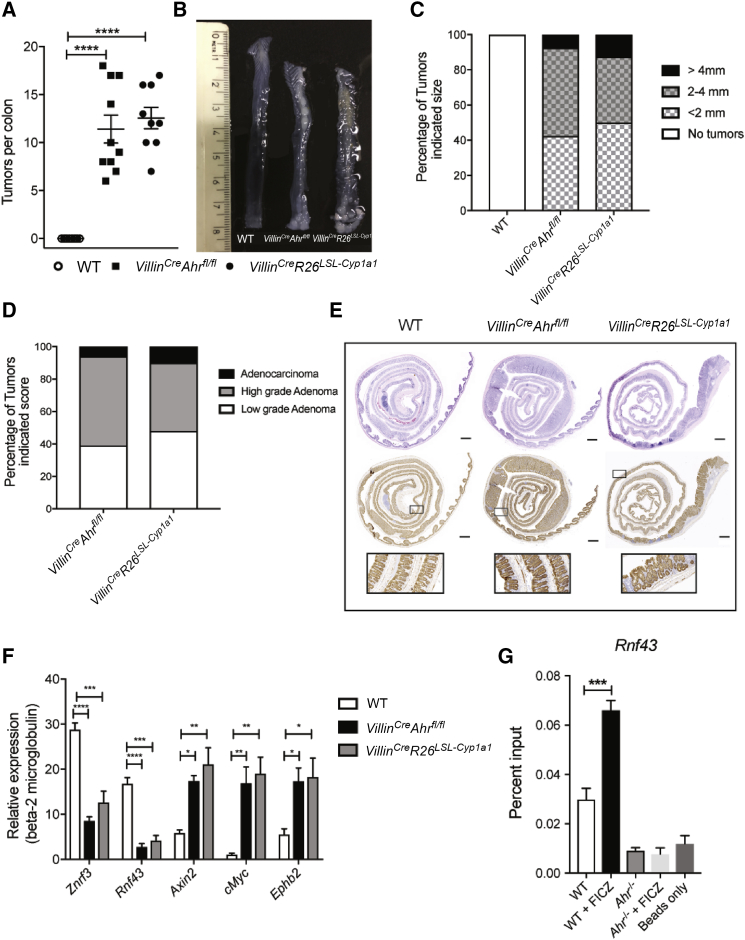
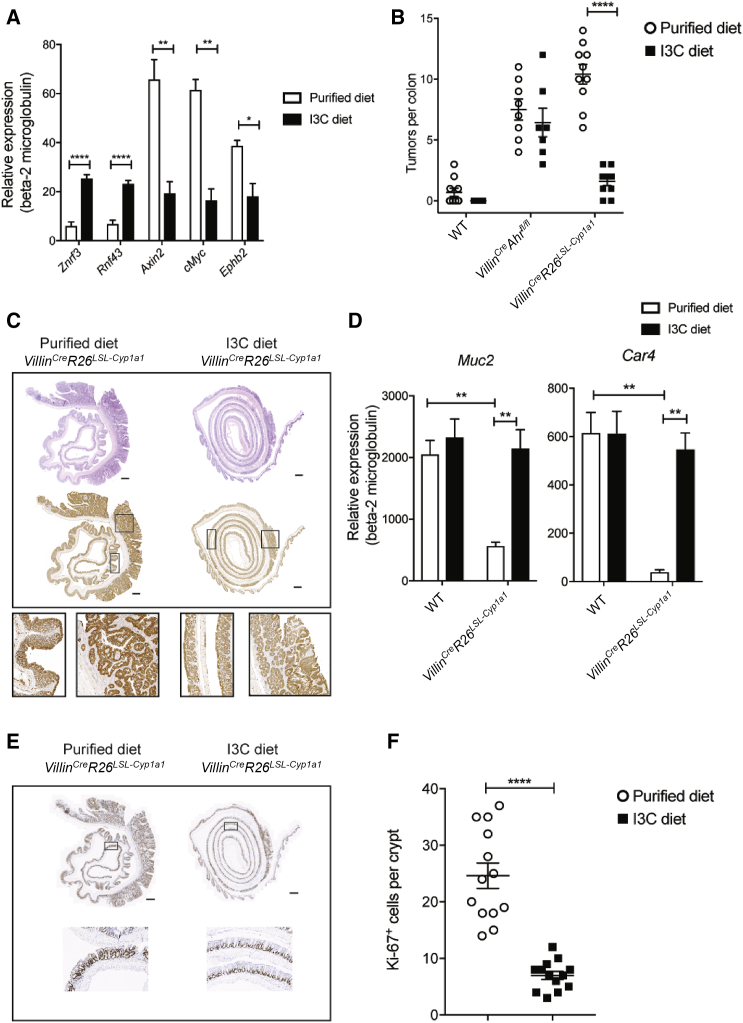
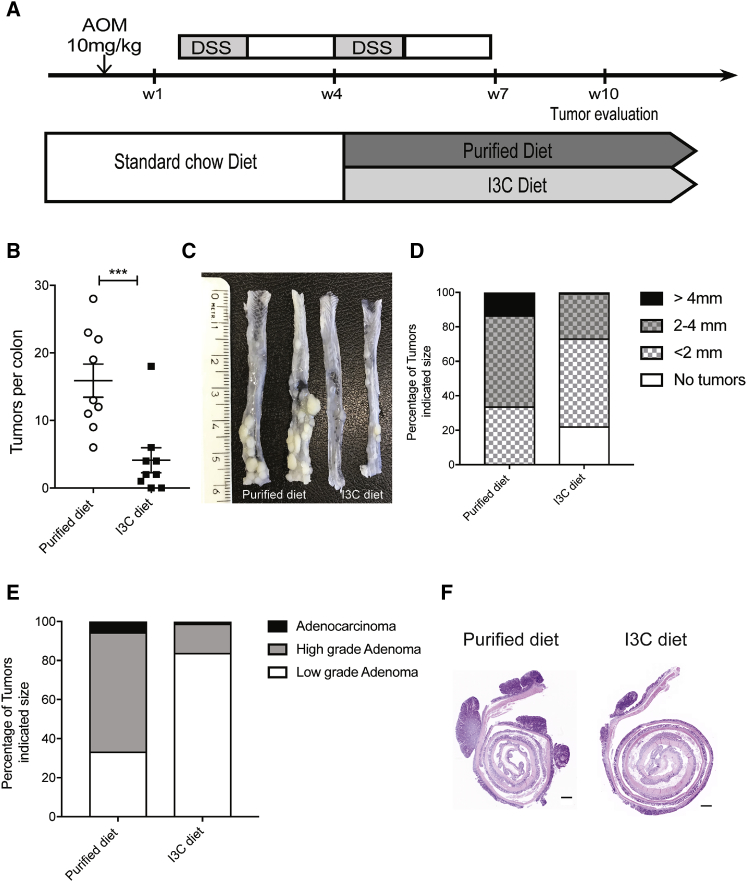
The epithelium and immune compartment in the intestine are constantly exposed to a fluctuating external environment. Defective communication between these compartments at this barrier surface underlies susceptibility to infections and chronic inflammation. Environmental factors play a significant, but mechanistically poorly understood, role in intestinal homeostasis. We found that regeneration of intestinal epithelial cells (IECs) upon injury through infection or chemical insults was profoundly influenced by the environmental sensor aryl hydrocarbon receptor (AHR). IEC-specific deletion of Ahr resulted in failure to control C. rodentium infection due to unrestricted intestinal stem cell (ISC) proliferation and impaired differentiation, culminating in malignant transformation. AHR activation by dietary ligands restored barrier homeostasis, protected the stem cell niche, and prevented tumorigenesis via transcriptional regulation of of Rnf43 and Znrf3, E3 ubiquitin ligases that inhibit Wnt-β-catenin signaling and restrict ISC proliferation. Thus, activation of the AHR pathway in IECs guards the stem cell niche to maintain intestinal barrier integrity.
Overview
The claims and statistics of this paper haven’t been checked yet.
Run the check — free, no account needed. It reads the open-access text and checks the sources it cites.
Integrity signals
Registry
Cites
Statistics
Figures
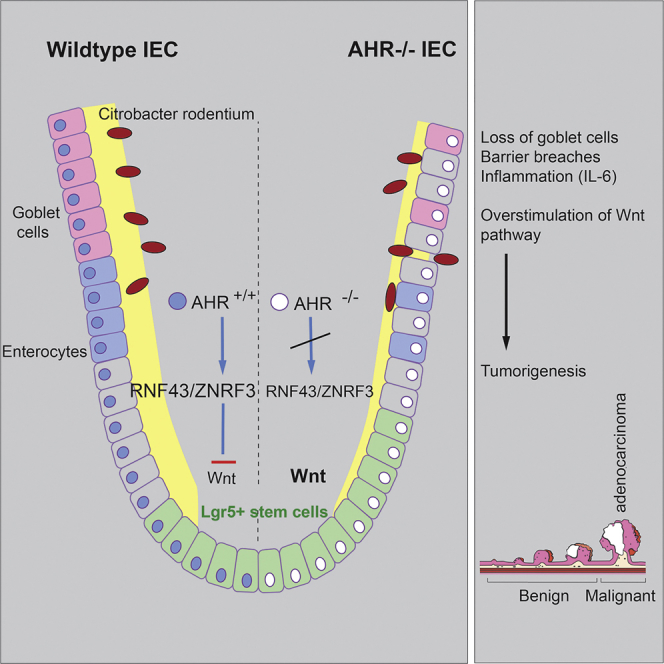
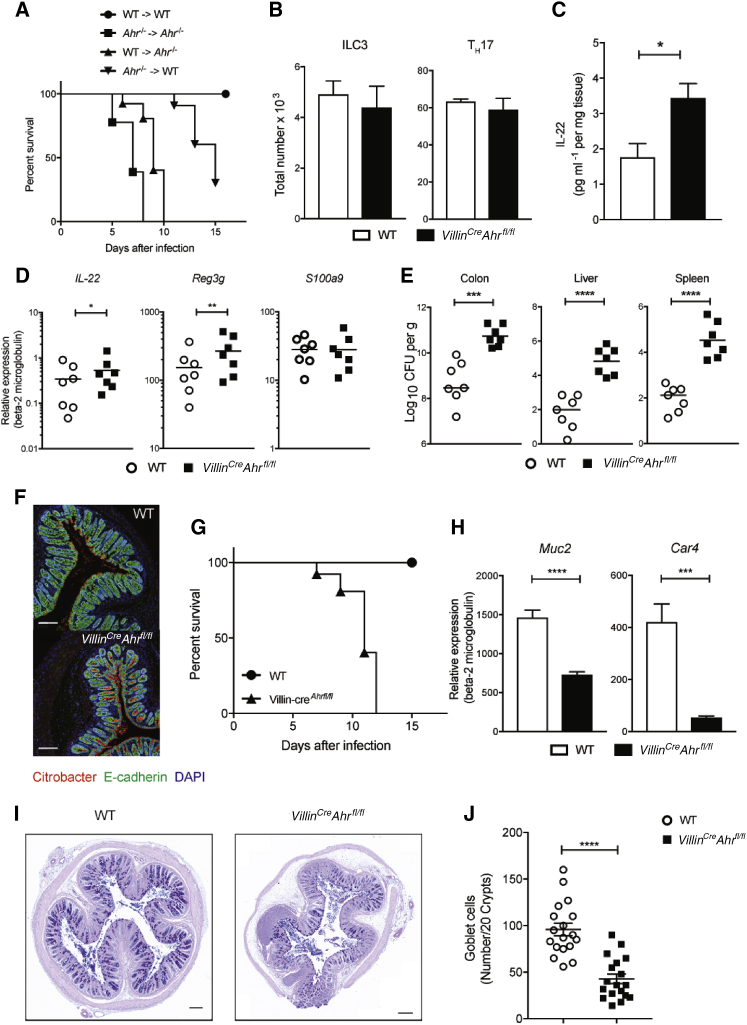
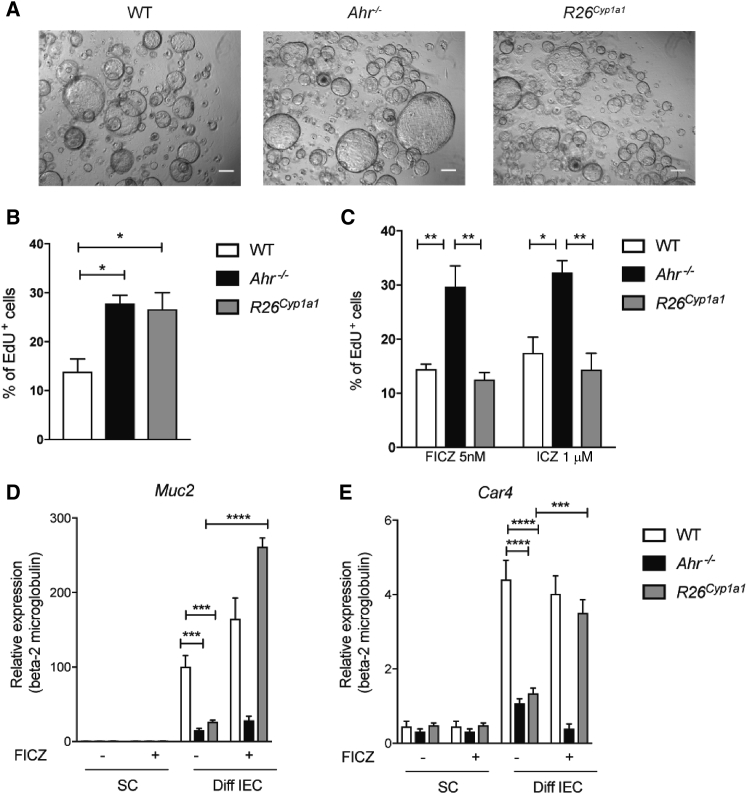
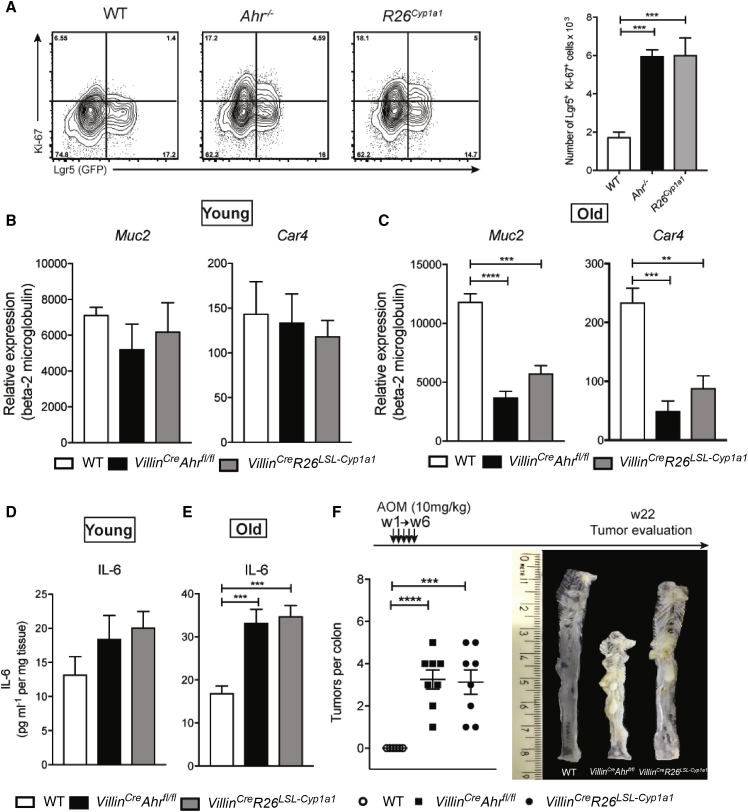
Verification
Claims the paper makes
The claims and statistics of this paper haven’t been checked yet.
Run the check — free, no account needed. It reads the open-access text and checks the sources it cites.
Claims other papers make about this one
Each is checked against this paper’s own text: does it say what the citing paper says it does?
In the citing paper
“Dietary supplementation with indole-3-carbinol activates the AHR in intestinal epithelial cells to restore intestinal barrier integrity in mice infected with Citrobacter rodentium.”
From Microbiota–gut–brain axis and its therapeutic applications in neurodegenerative diseases (2024) · cites this paper as [653]
Self-check
Percentages, sums and reported differences re-computed from the paper’s own numbers.
The self-check needs the paper’s full text.
Citations
Cites
Single Lgr5 stem cells build crypt-villus structures in vitro without a mesenchymal niche
Sato, T., Vries, R. G., Snippert, H. J., van de Wetering, M., Barker, N., Stange, D. E., van Es, J. H., Abo, A., Kujala, P., Peters, P. J., et al. (2009) · Nature · doi:10.1038/nature07935 · Cited by 7,204 · cited 1×
“Wnt-b-Catenin Signaling The intestinal epithelium continuously renews itself from crypt stem cells that differentiate into short-lived specialized epithelial subtypes (Sato et al., 2009).”
BackgroundIdentification of stem cells in small intestine and colon by marker gene Lgr5
Barker, N., van Es, J. H., Kuipers, J., Kujala, P., van den Born, M., Cozijnsen, M., Haegebarth, A., Korving, J., Begthel, H., Peters, P. J., et al. (2007) · Nature · doi:10.1038/nature06196 · Cited by 5,687 · cited 6×
“Since we were not able to maintain Ahr-deficient Lgr5Egfp-Ires-creErt2 reporter mice viable for long enough, we used mice heterozygous for Ahr deletion, which were partially affected.”
BackgroundMethodInfluentialZelante, T., Iannitti, R. G., Cunha, C., De Luca, A., Giovannini, G., Pieraccini, G., Zecchi, R., D’Angelo, C., Massi-Benedetti, C., Fallarino, F., et al. (2013) · Immunity · doi:10.1016/j.immuni.2013.08.003 · Cited by 2,614 · cited 2×
“Although the AHR was originally described as a receptor for dioxin and other xenobiotics, it is now clear that physiological AHR ligands such as dietary components and tryptophan metabolites (Denison and Nagy, 2003; Hubbard et al., 2015; Lamas et al., 2016;McMillan and Bradfield, 2007; Moura-Alves et al., 2014; Zelant…”
BackgroundLiu, J. Z., van Sommeren, S., Huang, H., Ng, S. C., Alberts, R., Takahashi, A., Ripke, S., Lee, J. C., Jostins, L., Shah, T., et al. (2015) · Nature Genetics · doi:10.1038/ng.3359 · Cited by 2,603
Denison, M. S., & Nagy, S. R. (2003) · Annual Review of Pharmacology and Toxicology · doi:10.1146/annurev.pharmtox.43.100901.135828 · Cited by 1,895 · cited 2×
“Although the AHR was originally described as a receptor for dioxin and other xenobiotics, it is now clear that physiological AHR ligands such as dietary components and tryptophan metabolites (Denison and Nagy, 2003; Hubbard et al., 2015; Lamas et al., 2016;McMillan and Bradfield, 2007; Moura-Alves et al., 2014; Zelant…”
BackgroundLamas, B., Richard, M. L., Leducq, V., Pham, H.-P., Michel, M.-L., Da Costa, G., Bridonneau, C., Jegou, S., Hoffmann, T. W., Natividad, J. M., et al. (2016) · Nature Medicine · doi:10.1038/nm.4102 · Cited by 1,482 · cited 2×
“Although the AHR was originally described as a receptor for dioxin and other xenobiotics, it is now clear that physiological AHR ligands such as dietary components and tryptophan metabolites (Denison and Nagy, 2003; Hubbard et al., 2015; Lamas et al., 2016;McMillan and Bradfield, 2007; Moura-Alves et al., 2014; Zelant…”
BackgroundGrowing Self-Organizing Mini-Guts from a Single Intestinal Stem Cell: Mechanism and Applications
Sato, T., & Clevers, H. (2013) · Science · doi:10.1126/science.1234852 · Cited by 1,170 · cited 1×
“In order to directly investigate the role of AHR in the process of crypt stem cell proliferation and differentiation, we generated colon organoids (Sato and Clevers, 2013).”
BackgroundTumour suppressor RNF43 is a stem-cell E3 ligase that induces endocytosis of Wnt receptors
Koo, B.-K., Spit, M., Jordens, I., Low, T. Y., Stange, D. E., van de Wetering, M., van Es, J. H., Mohammed, S., Heck, A. J. R., Maurice, M. M., et al. (2012) · Nature · doi:10.1038/nature11308 · Cited by 980 · cited 3×
“Our results provide evidence that Wnt-b-catenin pathway dysregulation in Ahrdeficient IECs occurred upstream of b-catenin degradation, affecting the response to WNT signals themselves through the expression of the two related E3 ubiquitin ligases (ZNRF3 and RNF43) that degrade the Wnt frizzled receptors (Koo et al., 2…”
BackgroundCancer as an overhealing wound: an old hypothesis revisited
Schäfer, M., & Werner, S. (2008) · Nature Reviews Molecular Cell Biology · doi:10.1038/nrm2455 · Cited by 974
ZNRF3 promotes Wnt receptor turnover in an R-spondin-sensitive manner
Hao, H.-X., Xie, Y., Zhang, Y., Charlat, O., Oster, E., Avello, M., Lei, H., Mickanin, C., Liu, D., Ruffner, H., et al. (2012) · Nature · doi:10.1038/nature11019 · Cited by 962 · cited 2×
“We focused on the tumor suppressors RNF43 and ZNRF3, which are transmembrane E3 ubiquitin ligases expressed in LGR5 stem cells that regulate WNT signals by targeting WNT receptors for degradation in an R-spondin-sensitive manner (Hao et al., 2012; Koo et al., 2012; Tsukiyama et al., 2015).”
Background
Cited by
Sorted by citations
Items 101–200 of 403
Chen, G., Cao, Z., Shi, Z., Lei, H., Chen, C., Yuan, P., Wu, F., Liu, C., Dong, M., Song, Y., et al. (2021) · Biomedicine & Pharmacotherapy · doi:10.1016/j.biopha.2021.111542 · Cited by 55
Vân, N. T. T., Zhang, K., Wigmore, R. M., Kennedy, A., DaSilva, C. R., Huang, J., Ambelil, M., Vilagomez, J. H., O’Connor, G. J., Longman, R., et al. (2023) · Nature Communications · doi:10.1038/s41467-023-43211-4 · Cited by 57
Metabolism at the centre of the host–microbe relationship
Maslowski, K. M. (2019) · Clinical & Experimental Immunology · doi:10.1111/cei.13329 · Cited by 60
Microbial Metabolites and Intestinal Stem Cells Tune Intestinal Homeostasis
Xing, P. Y., Pettersson, S., & Kundu, P. (2020) · PROTEOMICS · doi:10.1002/pmic.201800419 · Cited by 55
Gut Microbial-Derived Metabolomics of Asthma
Lee‐Sarwar, K. A., Lasky-Su, J. A., Kelly, R. S., Litonjua, A. A., & Weiss, S. T. (2020) · Metabolites · doi:10.3390/metabo10030097 · Cited by 58
Microbiota-Associated Metabolites and Related Immunoregulation in Colorectal Cancer
Chen, Y., & Chen, Y. (2021) · Cancers · doi:10.3390/cancers13164054 · Cited by 54
Luo, H., Li, M., Wang, F., Yang, Y., Wang, Q. L., Zhao, Y., Du, F., Chen, Y., Shen, J., Zhao, Q., et al. (2022) · International Journal of Biological Sciences · doi:10.7150/ijbs.72600 · Cited by 58
Immunotoxicity of Xenobiotics in Fish: A Role for the Aryl Hydrocarbon Receptor (AhR)?
Segner, H. E., Bailey, C., Tafalla, C., & Bo, J. (2021) · International Journal of Molecular Sciences · doi:10.3390/ijms22179460 · Cited by 58
“Activation of the AhR by environmental signals, such as dietary AhR ligands, has critical physiological functions in orchestrating immune homeostasis in the intestine, maintaining IEL and ILC populations, preventing inflammatory damage, and conserving barrier integrity [89].”
BackgroundIFNγ-Stat1 axis drives aging-associated loss of intestinal tissue homeostasis and regeneration
Omrani, O., Křepelová, A., Rasa, S. M. M., Širvinskas, D., Lu, J. N., Annunziata, F., Garside, G. B., Bajwa, S., Reinhardt, S., Adam, L., et al. (2023) · Nature Communications · doi:10.1038/s41467-023-41683-y · Cited by 54
Li, Y., Liu, N., Ge, Y., Yang, Y., Ren, F., & Wu, Z. (2022) · European Journal of Immunology · doi:10.1002/eji.202149401 · Cited by 53
Self-citationGanapathy, A. S., Saha, K., Wang, A., Priya, A., Viszwapriya, D., Yochum, G. S., Koltun, W. A., Nighot, M., Perdew, G. H., Thompson, T. A., et al. (2023) · Cell Reports · doi:10.1016/j.celrep.2023.112705 · Cited by 53
Urbauer, E., Rath, E., & Haller, D. (2021) · Frontiers in Cell and Developmental Biology · doi:10.3389/fcell.2020.602814 · Cited by 55
How Ah Receptor Ligand Specificity Became Important in Understanding Its Physiological Function
Murray, I. A., & Perdew, G. H. (2020) · International Journal of Molecular Sciences · doi:10.3390/ijms21249614 · Cited by 57
Peng, C., Wu, C., Xu, X., Pan, L., Lou, Z., Zhao, Y., Jiang, H., He, Z., & Ruan, B. (2021) · Experimental Cell Research · doi:10.1016/j.yexcr.2021.112638 · Cited by 51
The Gut Microbiota: A Novel Player in Autoimmune Hepatitis
Cheng, Z., Yang, L., & Chu, H. (2022) · Frontiers in Cellular and Infection Microbiology · doi:10.3389/fcimb.2022.947382 · Cited by 51
Epithelial regulation of microbiota-immune cell dynamics
Didriksen, B. J., Eshleman, E. M., & Alenghat, T. (2024) · Mucosal Immunology · doi:10.1016/j.mucimm.2024.02.008 · Cited by 54
Gut Biofactory—Neurocompetent Metabolites within the Gastrointestinal Tract. A Scoping Review
Skonieczna‐Żydecka, K., Jakubczyk, K., Maciejewska, D., Janda, K., Kaźmierczak-Siedlecka, K., Kaczmarczyk, M., Łoniewski, I., & Marlicz, W. M. (2020) · Nutrients · doi:10.3390/nu12113369 · Cited by 52
Gao, Y., Liu, K.-Y., Xiao, W., Xie, X., Liang, Q., Tu, Z., Yang, L., Yu, H., Guo, H., Huang, S., et al. (2024) · Theranostics · doi:10.7150/thno.95749 · Cited by 51
“…environmental, dietary, microbial, and immunological cues regulate intestinal inflammation in mouse models by targeting AhR in epithelial cells [7, 8], innate lymphoid cells (ILCs) [9, 10], intraepithelial lymphocytes [11], and T cells [12-14]; however, little is known about the exact role of…”
BackgroundNichols, R. G., Zhang, J., Cai, J., Murray, I. A., Koo, I., Smith, P. B. W., Perdew, G. H., & Patterson, A. D. (2019) · Metabolites · doi:10.3390/metabo10010001 · Cited by 47
“roles in both adaptive and innate immunity (pro-inflammatory and anti-inflammatory responses) and in gut barrier function [13,14].”
BackgroundEpigenetic Regulation of Cancer Stem Cells by the Aryl Hydrocarbon Receptor Pathway
Akhtar, S., Hourani, S., Therachiyil, L., Al‐Dhfyan, A., Agouni, A., Zeidan, A., Shahab Uddin, M. S., & Korashy, H. M. (2020) · Seminars in Cancer Biology · doi:10.1016/j.semcancer.2020.08.014 · Cited by 49
Microbial sensing in the intestine
Wan, T., Wang, Y., He, K., & Zhu, S. (2023) · Protein & Cell · doi:10.1093/procel/pwad028 · Cited by 50
Puccetti, M., Pariano, M., Borghi, M., Barola, C., Moretti, S., Galarini, R., Mosci, P., Ricci, M., Costantini, C., & Giovagnoli, S. (2021) · International Journal of Pharmaceutics · doi:10.1016/j.ijpharm.2021.120610 · Cited by 47
Innate immune sensing by epithelial barriers
Constant, D. A., Nice, T. J., & Rauch, I. (2021) · Current Opinion in Immunology · doi:10.1016/j.coi.2021.07.014 · Cited by 46
Gut microbiota in systemic lupus erythematosus: A fuse and a solution
Chen, Y., Lin, J., Xiao, L., Zhang, X., Zhao, L., Wang, M., & Li, L. (2022) · Journal of Autoimmunity · doi:10.1016/j.jaut.2022.102867 · Cited by 48
Ethanol-induced changes to the gut microbiome compromise the intestinal homeostasis: a review
Sosnowski, K., & Przybyłkowski, A. M. (2024) · Gut Microbes · doi:10.1080/19490976.2024.2393272 · Cited by 52
“125 Park et al. showed that indole-3-carbinol, an AHR-dependent tryptophan metabolite, promotes goblet cell differentiation by regulating key transcription factors, underscoring its role in intestinal health and regeneration.”
BackgroundDogra, S. K., Martin, F., Donnicola, D., Julita, M., Berger, B. W., & Sprenger, N. (2021) · Microorganisms · doi:10.3390/microorganisms9091939 · Cited by 50
Gut microbiota determines the fate of dietary fiber-targeted interventions in host health
Wang, W., Fan, Z., Yan, Q., Pan, T., Luo, J., Wei, Y., Li, B., Fang, Z., & Lu, W. (2024) · Gut Microbes · doi:10.1080/19490976.2024.2416915 · Cited by 47
“123 The intestinal microorganism also affects the IDO pathway for the production of Kyn, and the micro-organism involved in this process include Ileibacterium valens , Parabacteroides distasonis , Shigella sonnei , Bacteroides acidifaciens , Bacteroides vulgatus (taxonomic name change: Phocaeicola…”
BackgroundHan, H., Davidson, L. A., Fan, Y., Goldsby, J. S., Yoon, G., Jin, U., Wright, G. A., Landrock, K. K., Weeks, B. R., Wright, R. C., et al. (2020) · The EMBO Journal · doi:10.15252/embj.2019104319 · Cited by 44
“Interestingly, in a recent study using an intestinal AhR deletion mouse model, a hyperproliferating stem cell phenotype was linked to dysregulated Wnt/ b -catenin signaling (Metidji et al , 2018).”
Potential Roles of Enterochromaffin Cells in Early Life Stress-Induced Irritable Bowel Syndrome
Tao, E., Zhu, Z., Hu, C., Long, G., Chen, B., Guo, R. C., Fang, M., & Jiang, M. (2022) · Frontiers in Cellular Neuroscience · doi:10.3389/fncel.2022.837166 · Cited by 47
Großkopf, H., Walter, K., Karkossa, I., von Bergen�, M., & Schubert, K. A. (2021) · Frontiers in Immunology · doi:10.3389/fimmu.2021.620270 · Cited by 46
“At the origin of these ligands, AhR is essential for intestinal immunity and barrier function (94, 95).”
BackgroundLoss of Aryl Hydrocarbon Receptor Promotes Colon Tumorigenesis in ApcS580/+; KrasG12D/+ Mice
Han, H., Davidson, L. A., Hensel, M. E., Yoon, G., Landrock, K. K., Allred, C. D., Jayaraman, A., Ivanov, I. V., Safe, S. H., & Chapkin, R. S. (2021) · Molecular Cancer Research · doi:10.1158/1541-7786.mcr-20-0789 · Cited by 46
Update of Indoles: Promising molecules for ameliorating metabolic diseases
Hu, W., Yan, G., Ding, Q., Cai, J., Zhang, Z., Zhao, Z., Lei, H., & Zhu, Y. Z. (2022) · Biomedicine & Pharmacotherapy · doi:10.1016/j.biopha.2022.112957 · Cited by 42
Lima, C., Falcão, M. A. P., da Rosa, J. G. S., Disner, G. R., & Lopes‐Ferreira, M. (2022) · International Journal of Molecular Sciences · doi:10.3390/ijms232012402 · Cited by 42
Hou, J., Ma, A.-H., & Qin, Y. (2023) · Frontiers in Cellular and Infection Microbiology · doi:10.3389/fcimb.2023.1279172 · Cited by 43
Yan, B., Mao, X., Hu, S., Wang, S., Liu, X., & Sun, J. (2023) · International Immunopharmacology · doi:10.1016/j.intimp.2023.110166 · Cited by 45
The influence of AHR on immune and tissue biology
Stockinger, B., Diaz, O. E., & Wincent, E. (2024) · EMBO Molecular Medicine · doi:10.1038/s44321-024-00135-w · Cited by 43
“The combined effect of stem cell over-proliferation with chronic in fl ammation caused by a defective barrier makes AHR-de fi cient mice susceptible to malignant transformation (Metidji et al, 2018).”
Self-citationSingh, N. P., Nagarkatti, M., & Nagarkatti, P. S. (2020) · International Journal of Molecular Sciences · doi:10.3390/ijms21217849 · Cited by 44
“Indolo[3,2-b]carbazole (ICZ) Dietary Attenuates inflammation [85,86]”
Landsiedel, R., Hahn, D., Ossig, R., Ritz, S., Sauer, L., Buesen, R., Rehm, S. R., Wohlleben, W., Groeters, S., Strauss, V., et al. (2022) · Particle and Fibre Toxicology · doi:10.1186/s12989-022-00459-w · Cited by 42
“Lamas et al. hypothesized that a NP-induced depletion of AhR ligand producing bacterial strains observed in rodents after long-term treatment with TiO2 NP represents the missing link for colon cancer development [2].”
BackgroundInfluentialThe intestine: A highly dynamic microenvironment for IgA plasma cells
Pracht, K., Wittner, J., Kagerer, F., Jäck, H., & Schuh, W. (2023) · Frontiers in Immunology · doi:10.3389/fimmu.2023.1114348 · Cited by 44
Unlocking the Mystery of the Therapeutic Effects of Chinese Medicine on Cancer
Liu, S.-H., Chen, P., Huang, C.-C., Hung, Y.-T., Lee, M.-Y., Lin, W.-H., Lin, Y.-C., & Lee, A. (2021) · Frontiers in Pharmacology · doi:10.3389/fphar.2020.601785 · Cited by 36
Griffith, B. D., & Frankel, T. L. (2024) · Cancers · doi:10.3390/cancers16030472 · Cited by 45
“In a preclinical model utilizing Villin cre AhR fl/fl mice, azoxymethane alone led to the development of CRC, an effect not seen in wild-type mice [101].”
MethodCao, J., Bao, Q., & Hao, H. (2024) · Antioxidants · doi:10.3390/antiox13091107 · Cited by 39
“As an important component of the immune barrier, the AhR can promote epithelial cell recovery and maintain intestinal barrier integrity [16,17].”
BackgroundEffects of high-fat diet and intestinal aryl hydrocarbon receptor deletion on colon carcinogenesis
Garcia-Vilarato, E., DeLuca, J. A. A., Callaway, E. S., Allred, K. F., Davidson, L. A., Hensel, M. E., Menon, R., Ivanov, I. V., Safe, S. H., Jayaraman, A., et al. (2020) · American Journal of Physiology-Gastrointestinal and Liver Physiology · doi:10.1152/ajpgi.00268.2019 · Cited by 37
Saldana-Morales, F. B., Kim, D. V., Tsai, M.-T., & Diehl, G. E. (2021) · Gut Microbes · doi:10.1080/19490976.2021.1916376 · Cited by 39
“In isolated colon segments, butyrate can increase and propionate can decrease fecal propulsion velocity.(77) Therefore, a balance of SCFAs in the lumen is necessary to achieve healthy gut motility.”
BackgroundElson, D. J., & Kolluri, S. K. (2023) · Biology · doi:10.3390/biology12040526 · Cited by 38
“downregulation of the inflammatory responses [10,118,119,121,124,125] inhibiting stem cell proliferation via the repression of factors such as FOXM1 and Wnt/β-catenin [84,115,126], and, by virtue of controlling these processes, promoting proper differentiation during regeneration after colonic injury [115,122,126].”
BackgroundInfluentialAryl Hydrocarbon Receptor Signalling in the Control of Gut Inflammation
Marafini, I., Monteleone, I., Laudisi, F., & Monteleone, G. (2024) · International Journal of Molecular Sciences · doi:10.3390/ijms25084527 · Cited by 41
“In this model, the administration of AHR agonists suppresses tumor progression [43].”
MethodHuang, Z., Schoones, T., Wells, J. M., Fogliano, V., & Capuano, E. (2021) · Molecular Nutrition & Food Research · doi:10.1002/mnfr.202100092 · Cited by 36
The Aryl Hydrocarbon Receptor in Chronic Kidney Disease: Friend or Foe?
Mo, Y., Lu, Z., Wang, L., Ji, C., Zou, C., & Liu, X. (2020) · Frontiers in Cell and Developmental Biology · doi:10.3389/fcell.2020.589752 · Cited by 36
“Aryl hydrocarbon receptor signaling regulates many fundamental cellular processes, such as cell cycle progression, apoptosis and cell proliferation by regulating P53, FasR, Bcl-2 and cell cycle kinases (Zaher et al., 1998; Mohammadi et al., 2017).”
BackgroundContribution of Circulating Host and Microbial Tryptophan Metabolites Toward Ah Receptor Activation
Morgan, E. W., Dong, F., Annalora, A. J., Murray, I. A., Wolfe, T. M., Erickson, R., Gowda, K., Amin, S., Petersen, K. S., Kris‐Etherton, P. M., et al. (2023) · International Journal of Tryptophan Research · doi:10.1177/11786469231182510 · Cited by 35
Gut Microbiota Metabolites: Unveiling Their Role in Inflammatory Bowel Diseases and Fibrosis
Bernardi, F., D’Amico, F., Bencardino, S., Faggiani, I., Fanizza, J., Zilli, A., Parigi, T. L., Allocca, M., Danese, S., & Furfaro, F. (2024) · Pharmaceuticals · doi:10.3390/ph17030347 · Cited by 39
“Specifically, AhR regulates negative transcriptional regulators of the Wnt-β -catenin pathway, such as Rnf43 and Znrf3, which are E3 ubiquitin ligases, restricting intestinal steam cells proliferation and serving as a protective mechanism against tumorigenesis [86].”
BackgroundNolan, L. S., Mihi, B., Agrawal, P. M., Gong, Q., Rimer, J. M., Bidani, S. S., Gale, S. E., Goree, M., Hu, E. Z., Lanik, W. E., et al. (2021) · ImmunoHorizons · doi:10.4049/immunohorizons.2100018 · Cited by 36
“Prior investigations have provided evidence for the ability of the dietary metabolites to activate the AhR signaling pathway and influence the composition of the microbiome in the small intestine (60).”
Influentialvan den Bogaard, E. H. J., Esser, C., & Perdew, G. H. (2021) · Experimental Dermatology · doi:10.1111/exd.14409 · Cited by 35
AhR and Wnt/β-Catenin Signaling Pathways and Their Interplay
Grishanova, A. Y., Klyushova, L. S., & Perepechaeva, M. L. (2023) · Current Issues in Molecular Biology · doi:10.3390/cimb45050248 · Cited by 35
“…these defects can be reversed via the activation of AhR by means of nutritional ligands, which was found to restore the regulation of the Wnt/ β -catenin pathway and barrier homeostasis and to prevent tumorigenesis through the transcriptional regulation of ubiquitin ligases RNF43 and ZNRF3 [115].”
BackgroundInfluentialGut microbiome-metabolites axis: A friend or foe to colorectal cancer progression
Wu, H., Ma, W., Wang, Y., Wang, Y., Sun, X., & Zheng, Q. (2024) · Biomedicine & Pharmacotherapy · doi:10.1016/j.biopha.2024.116410 · Cited by 34
Holtan, S. G., Shabaneh, A., Betts, B. C., Rashidi, A., MacMillan, M. L., Ustun, C., Amin, K., Vaughn, B. P., Howard, J. R., Khoruts, A., et al. (2019) · JCI Insight · doi:10.1172/jci.insight.129762 · Cited by 31
Indirubin-pregnane X receptor-JNK axis accelerates skin wound healing
Tanaka, Y., Uchi, H., Ito, T., & Furue, M. (2019) · Scientific Reports · doi:10.1038/s41598-019-54754-2 · Cited by 34
Gut Microbiota Regulation of AHR Signaling in Liver Disease
Wang, B., Zhou, Z., & Li, L. (2022) · Biomolecules · doi:10.3390/biom12091244 · Cited by 35
“To our knowledge, AHR signaling is essential for intestinal stem cell homeostasis and IL-22 production, thus maintaining intestinal barrier integrity [10,13].”
BackgroundYi, Y., Song, L., Pang, W., Zhang, S., Yu, J., Liang, P.-T., Li, T., Sun, Y., Wang, Y., Yan, J., et al. (2023) · British Journal of Pharmacology · doi:10.1111/bph.16229 · Cited by 33
“The aryl hydrocarbon receptor (AhR) is a transcription factor vital in maintaining intestinal immune homeostasis and inflammation processes in barriers (Dong et al., 2020; Metidji et al., 2018).”
BackgroundZhang, S., Peng, L., Goswami, S., Li, Y., Dang, H., Xing, S., Feng, P., Nigro, G., Liu, Y., Ma, Y., et al. (2025) · Nature Microbiology · doi:10.1038/s41564-025-01937-5 · Cited by 35
Self-citationCell-intrinsic view of the aryl hydrocarbon receptor in tumor immunity
Dean, J. W., & Zhou, L. (2022) · Trends in Immunology · doi:10.1016/j.it.2022.01.008 · Cited by 32
Kaur, H., Ali, S. A., & Yan, F. (2022) · Frontiers in Immunology · doi:10.3389/fimmu.2022.1006081 · Cited by 39
Shiizaki, K., Kido, K., & Mizuta, Y. (2019) · PLoS ONE · doi:10.1371/journal.pone.0224613 · Cited by 31
“Prevented intestinal tumorigenesis was also shown by dietary administration of AhR ligand indole-3-carbinol wherein E3 ubiquitin ligases inhibited Wnt-β-catenin signaling [17].”
BackgroundAryl Hydrocarbon Receptor Activation Coordinates Mouse Small Intestinal Epithelial Cell Programming
Zhou, X., Chakraborty, D., Murray, I. A., Coslo, D. M., Kehs, Z., Vijay, A., Ton, C., Desai, D. H., Amin, S., Patterson, A. D., et al. (2023) · Laboratory Investigation · doi:10.1016/j.labinv.2022.100012 · Cited by 33
Impact of Western Diet and Ultra-Processed Food on the Intestinal Mucus Barrier
Stolfi, C., Pacifico, T., Monteleone, G., & Laudisi, F. (2023) · Biomedicines · doi:10.3390/biomedicines11072015 · Cited by 34
The effector program of human CD8 T cells supports tissue remodeling
Delacher, M., Schmidleithner, L., Simon, M., Stüve, P., Sanderink, L., Hotz‐Wagenblatt, A., Wuttke, M., Schambeck, K., Ruhland, B., Hofmann, V., et al. (2023) · The Journal of Experimental Medicine · doi:10.1084/jem.20230488 · Cited by 30
Jansen, S. A., Nieuwenhuis, E. E. S., Hanash, A. M., & Lindemans, C. A. (2022) · Mucosal Immunology · doi:10.1038/s41385-022-00527-6 · Cited by 30
Exploration of the link between gut microbiota and purinergic signalling
Li, M., Liu, B., Li, R., Yang, P. C., Leng, P., & Huang, Y. (2022) · Purinergic Signalling · doi:10.1007/s11302-022-09891-1 · Cited by 32
Aryl hydrocarbon receptor maintains hepatic mitochondrial homeostasis in mice
Heo, M. J., Suh, J. H., Lee, S. H., Poulsen, K. L., An, Y., Moorthy, B., Hartig, S. M., Moore, D. D., & Kim, K. H. (2023) · Molecular Metabolism · doi:10.1016/j.molmet.2023.101717 · Cited by 32
Intestinal Barrier, Immunity and Microbiome: Partners in the Depression Crime
Medina-Rodriguez, E. M., Martínez-Raga, J., & Sanz, Y. (2024) · Pharmacological Reviews · doi:10.1124/pharmrev.124.001202 · Cited by 33
Aryl hydrocarbon receptor (AhR) activation contributes to high‐fat diet‐induced vascular dysfunction
da Silva, J. F., Bolsoni, J., da Costa, R. M., Alves, J. V., Bressan, A. F., Silva, L. E. V., Costa, T. J. D., Oliveira, A. E. R., Manzato, C. P., Aguiar, C. A., et al. (2022) · British Journal of Pharmacology · doi:10.1111/bph.15789 · Cited by 29
“Number: C8124, Mohammadi-Bardbori et al., 2019, 500 nM).”
Molecular regulation after mucosal injury and regeneration in ulcerative colitis
Zheng, L., Duan, S.-L., Wen, X., & Dai, Y.-C. (2022) · Frontiers in Molecular Biosciences · doi:10.3389/fmolb.2022.996057 · Cited by 28
“Taken together, these studies suggest that the coregulation of signaling pathways is important for the maintenance of the positive functions of colonic stem cells and the balanced differentiation of IECs (Metidji et al., 2018).”
BackgroundMicrobiota-Mediated Immune Regulation in Atherosclerosis
Eshghjoo, S., Jayaraman, A., Sun, Y., & Alaniz, R. C. (2021) · Molecules · doi:10.3390/molecules26010179 · Cited by 29
He, J., Li, H., Jia, J., Liu, Y., Zhang, N., Wang, R., Qu, W., Liu, Y., & Jia, L. (2023) · Molecular Biomedicine · doi:10.1186/s43556-023-00157-9 · Cited by 31
“Studies have shown that indole and its derivatives are major ligands for aryl hydrocarbon receptor (AhR) that induce AhR activation, thereby maintaining intestinal homeostasis, inhibiting pathogen infection, and improving colitis symptoms [54, 55].”
BackgroundIyer, K., Erkert, L., & Becker, C. (2023) · Frontiers in Cell and Developmental Biology · doi:10.3389/fcell.2023.1228283 · Cited by 31
“, 2014) and the aryl hydrocarbon receptor (AhR) (Zelante et al., 2013; Metidji et al., 2018) are involved in the sensing of tryptophan catabolites produced by microbes in the lumen.”
BackgroundChen, R., Qian, J., Wang, Q., Li, Y., Xu, Z., Zhang, M., Wang, M., Nie, H., Yang, W. R., Tong, X., et al. (2025) · EBioMedicine · doi:10.1016/j.ebiom.2025.106037 · Cited by 27
“47 Conversely, IPA intervention significantly enhances the secretory function of goblet cells and mucin activity.”
Self-citationHan, H., Davidson, L. A., Fan, Y., Landrock, K. K., Jayaraman, A., Safe, S. H., & Chapkin, R. S. (2021) · American Journal of Physiology-Gastrointestinal and Liver Physiology · doi:10.1152/ajpgi.00074.2021 · Cited by 26
Liu, S., Kang, W., Mao, X., Du, H., Ge, L., Hou, L., Yuan, X. H., Wang, M., Chen, X., Liu, Y., et al. (2022) · The Science of The Total Environment · doi:10.1016/j.scitotenv.2022.155027 · Cited by 26
Zablon, H. A., Ko, C., & Puga, A. (2021) · Toxicological Sciences · doi:10.1093/toxsci/kfab050 · Cited by 26
“This is consistent with findings that Ahr ablation favors proliferation of several types of stem cells and leads to malignant transformation of intestinal stem cells (Han et al., 2020; Metidji et al., 2018) and to loss of barrier and inefficient repair”
BackgroundResultInfluentialWang, Z., Yang, Y., Hu, S., He, J., Wu, Z., Qi, Z., Huang, M., Liu, R., Lin, Y., Tan, C., et al. (2020) · Cell Biology and Toxicology · doi:10.1007/s10565-020-09525-5 · Cited by 25
Vázquez-Gómez, G., Petráš, J., Dvořák, Z., & Vondráček, J. (2023) · Biochemical Pharmacology · doi:10.1016/j.bcp.2023.115797 · Cited by 26
Regulation of Intestinal Stem Cell Stemness by the Aryl Hydrocarbon Receptor and Its Ligands
Wisniewski, P. J., Nagarkatti, M., & Nagarkatti, P. S. (2021) · Frontiers in Immunology · doi:10.3389/fimmu.2021.638725 · Cited by 27
“In contrast, a putative mechanism by which AhR activation regulates the Wnt/β-catenin pathway has recently been determined to be through the activity of E3 ubiquitin ligases RNF43 and ZNRF3 which target Wnt frizzled receptors for degradation in ISCs, thereby inhibiting Wnt signaling (42).”
BackgroundInfluentialWhere the Aryl Hydrocarbon Receptor Meets the microRNAs: Literature Review of the Last 10 Years
Disner, G. R., Lopes‐Ferreira, M., & Lima, C. (2021) · Frontiers in Molecular Biosciences · doi:10.3389/fmolb.2021.725044 · Cited by 25
“…a pivotal effector in many pathological processes (Bock, 2020), such as cancer (Hanieh et al., 2016), intestinal inflammation (Lamas et al., 2016; Metidji et al., 2018), hepatic steatosis (Lee et al., 2010), chronic rhinosinusitis (Liu et al., 2018), and atopic dermatitis (van den Bogaard et…”
BackgroundHuang, F., & Huang, S. (2023) · Nutrients · doi:10.3390/nu15020305 · Cited by 25
“rodentium infection [8] and inflammatory damage; therefore, the importance of epithelial AhR expression in intestinal homeostasis and protection cannot be overemphasized.”
BackgroundAh receptor ligands and their impacts on gut resilience: structure–activity effects
Safe, S. H., Jayaraman, A., & Chapkin, R. S. (2020) · Critical Reviews in Toxicology · doi:10.1080/10408444.2020.1773759 · Cited by 26
“Using a similar approach in which the AhR was deleted only in the intestinal epithelium, there was also an increased tumor burden in these mice compared to wild-type mice demonstrating the critical role of intestinal epithelial AhR as an inhibitor of intestinal tumor formation (Metidji et al. 2018).”
BackgroundMalijauskaite, S., Connolly, S. A., Newport, D. T., & McGourty, K. (2021) · Cytokine & Growth Factor Reviews · doi:10.1016/j.cytogfr.2021.03.002 · Cited by 24
Piwarski, S. A., & Salisbury, T. B. (2023) · Biochemical Pharmacology · doi:10.1016/j.bcp.2023.115771 · Cited by 25
Dietary environmental factors shape the immune defense against Cryptosporidium infection
Maradana, M. R., Marzook, N. B., Diaz, O. E., Mkandawire, T. T., Diny, N. L., Li, Y., Liebert, A., Shah, K., Tolaini, M., Kváč, M., et al. (2023) · Cell Host & Microbe · doi:10.1016/j.chom.2023.11.008 · Cited by 24
“31 Cryptosporidium infects and replicates inside small intestinal epithelial cells, causing villus blunting and crypt hyperplasia and thereby significant gut damage.”
Self-citationTargeting aryl hydrocarbon receptor to prevent cancer in barrier organs
Congues, F., Wang, P., Lee, J., Lin, D., Shahid, A., Xie, J., & Huang, Y. S. (2024) · Biochemical Pharmacology · doi:10.1016/j.bcp.2024.116156 · Cited by 29
Wang, X., Yuan, X., Su, Y.-T., Hu, J., Ji, Q., Fu, S., Li, R., Hu, L.-P., & Dai, C. (2021) · Frontiers in Immunology · doi:10.3389/fimmu.2021.696766 · Cited by 23
Aryl hydrocarbon receptor as a DNA methylation reader in the stress response pathway
Habano, W., Miura, T., Terashima, J., & Ozawa, S. (2022) · Toxicology · doi:10.1016/j.tox.2022.153154 · Cited by 24
Tan, B., Zhang, J., An, K., Zhang, L., Fang, D., Wu, H., Han, T., Qiu, R., Li, H., & Sun, D. (2025) · Phytomedicine · doi:10.1016/j.phymed.2025.157054 · Cited by 22
Deng, F., Hu, J., Xiao, Y., Wang, Y., Lin, Z., Sun, Q., & Liu, K. (2020) · Biochemical and Biophysical Research Communications · doi:10.1016/j.bbrc.2020.10.014 · Cited by 22
Ghosh, S., Erickson, D., Chua, M. J., Collins, J., & Jala, V. R. (2024) · mSystems · doi:10.1128/msystems.01255-23 · Cited by 21
“Recent studies have highlighted that AHR activation in the intestine leads to stem cell activation, leading to the proliferation of intestinal epithelial cells (53, 54).”
BackgroundSuntornsaratoon, P., Antonio, J. M., Flores, J., Upadhyay, R., Veltri, J., Bandyopadhyay, S., Dadala, R., Kim, M., Liu, Y., Balasubramanian, I., et al. (2024) · Cellular and Molecular Gastroenterology and Hepatology · doi:10.1016/j.jcmgh.2024.04.003 · Cited by 23
“46,47 MNA also rescued DSS-induced reduction in Dll4 and Notch1 in vivo.”
BackgroundHow aging influences the gut-bone marrow axis and alters hematopoietic stem cell regulation
Wells, C., Robertson, T., Sheth, P. M., & Abraham, S. A. (2024) · Heliyon · doi:10.1016/j.heliyon.2024.e32831 · Cited by 22
Qiao, Z., Wang, X., Wang, C., Jin, H., Qi, W., Zhang, H., Liu, Z., & You, C. (2022) · Frontiers in Nutrition · doi:10.3389/fnut.2022.799053 · Cited by 22
Multi-Omics Strategies for Investigating the Microbiome in Toxicology Research
Morgan, E. W., Perdew, G. H., & Patterson, A. D. (2022) · Toxicological Sciences · doi:10.1093/toxsci/kfac029 · Cited by 23
Wu, P., Yao, S., Wang, X., Wang, X., Yang, L., Dai, W., Zhang, H., He, B., Wang, X., Wang, S., et al. (2023) · International Journal of Pharmaceutics · doi:10.1016/j.ijpharm.2023.122813 · Cited by 21
Taddese, R., Roelofs, R., Draper, D., Wu, X., Wu, S., Swinkels, D. W., Tjalsma, H., & Boleij, A. (2021) · Frontiers in Cellular and Infection Microbiology · doi:10.3389/fcimb.2021.740704 · Cited by 19
Alessandrini, F., de Jong, R., Wimmer, M., Maier, A.-M., Fernandez, I. E., Hils, M., Buters, J., Biedermann, T., Zissler, U. M., Hoffmann, C., et al. (2022) · Frontiers in Immunology · doi:10.3389/fimmu.2022.901194 · Cited by 20
Metadata
- Authors
- Metidji, A., Omenetti, S., Crotta, S., Li, Y., Nye, E., Ross, E., Li, V., Maradana, M. R., Schiering, C., & Stockinger, B.
- Affiliations
- The Francis Crick Institute (GB)
- University of London (GB)
- Corresponding author
- Schiering, Chris
- Stockinger, Brigitta
- ORCID
- Venue
- Immunity
- Publisher
- Elsevier BV
- Published
- 2018-08
- Volume
- 49
- Issue
- 2
- Pages
- 353-362.e5
- ISSN
- 1074-7613 (ISSN-L)
- PMC
- PMC6104739
- OpenAlex
- W2887221348
- Cited by
- 402
- References
- 45
- Citations by year
- 2026: 37 · 2025: 50 · 2024: 56 · 2023: 63 · 2022: 55 · 2021: 60 · 2020: 50 · 2019: 30
- FWCI
- 12.45
- Type
- journal article
- Language
- en
- Update notices
- erratum (2019-06-18)
- Open access
- hybrid
- doi.org
- Licence
- Locations
- Immunity (publishedVersion, cc-by)
- Europe PMC (PubMed Central) (publishedVersion, cc-by)
- PubMed Central (publishedVersion, cc-by)
- PubMed (publishedVersion)
- Figshare (submittedVersion, cc-by)
- Funders
- Cancer Research UK (FC001105, FC001159, 103156/B/13/Z, 19691)
- Fondation Acteria
- Medical Research Council
- Wellcome Trust (100910/Z/13/Z)
- Topics
- Life Sciences › Biochemistry, Genetics and Molecular Biology › Molecular Biology › Wnt/β-catenin signaling in development and cancer
- Health Sciences › Medicine › Gastroenterology › Inflammatory Bowel Disease
- Life Sciences › Immunology and Microbiology › Immunology › IL-33, ST2, and ILC Pathways
- Keywords
- aryl hydrocarbon receptor, intestinal stem cells, intestinal barrier integrity, intestinal homeostasis, intestinal inflammation, RNF43, ZNRF3, Wnt/β-catenin signaling, E3 ubiquitin ligase, stem cell niche, intestinal tumorigenesis
- MeSH terms
- Animals, Cell Differentiation, Cell Line, Enterobacteriaceae Infections, Epithelial Cells, Humans, Intestinal Mucosa, Mice, Inbred C57BL, Stem Cells, Receptors, Aryl Hydrocarbon, Mice, Knockout, Tight Junctions, Citrobacter rodentium, Ubiquitin-Protein Ligases, Cell Proliferation, Mice, Basic Helix-Loop-Helix Proteins, Basic Helix-Loop-Helix Transcription Factors, HEK293 Cells, Wnt Signaling Pathway, Carcinogenesis
About these checks
Registry, retraction, Cites and statistics results are computed, not judged, with one exception: a printed reference that no index lists is read once by a model before it counts as a citation error. Claims are extracted by a model and kept only when their quote appears verbatim in the text; each cited source is then checked, with a model’s help, for whether it says what the claim relies on. Those verdicts can be wrong — read the claim’s quote and the cited source before relying on one.
Statistics and arithmetic are recomputed, not judged.
Confidence bands are shown only for fields calibrated on our annotated test set. None is calibrated yet, so no band is shown.
What counts as a claim ›How we measure confidence ›How we check this ›
Are you an author, or do you see a problem with this page? Request a review
