Cited by 117Neuroinflammation and Neurodegeneration MechanismsAlzheimer's disease research and treatmentsMultiple Sclerosis Research Studies

The DOI matches its Crossref record; 76 of the 76 references it cites were found in a registry or an index.

CD4 T Cells Induce A Subset of MHCII-Expressing Microglia that Attenuates Alzheimer Pathology

Open access

Abstract

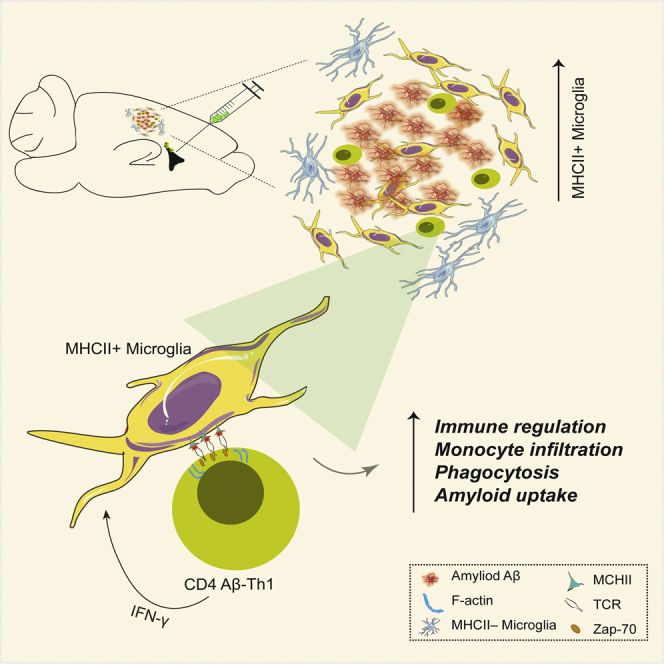
Microglia play a key role in innate immunity in Alzheimer disease (AD), but their role as antigen-presenting cells is as yet unclear. Here we found that amyloid β peptide (Aβ)-specific T helper 1 (Aβ-Th1 cells) T cells polarized to secrete interferon-γ and intracerebroventricularly (ICV) injected to the 5XFAD mouse model of AD induced the differentiation of major histocompatibility complex class II (MHCII)+ microglia with distinct morphology and enhanced plaque clearance capacity than MHCII- microglia. Notably, 5XFAD mice lacking MHCII exhibited an enhanced amyloid pathology in the brain along with exacerbated innate inflammation and reduced phagocytic capacity. Using a bone marrow chimera mouse model, we showed that infiltrating macrophages did not differentiate to MHCII+ cells following ICV injection of Aβ-Th1 cells and did not support T cell-mediated amyloid clearance. Overall, we demonstrate that CD4 T cells induce a P2ry12+ MHCII+ subset of microglia, which play a key role in T cell-mediated effector functions that abrogate AD-like pathology.

Overview

The claims and statistics of this paper haven’t been checked yet.

Run the check — free, no account needed. It reads the open-access text and checks the sources it cites.

A few free checks a day · papers already verified open instantly · results are public

Integrity signals

Registry

Crossref · 10.1016/j.isci.2019.05.039

Cites

76 of 76 references verified0 citation errors · 0 not checkable

Statistics

Figures

Graphical abstract
Graphical abstract CC BY-NC-ND · PubMed Central
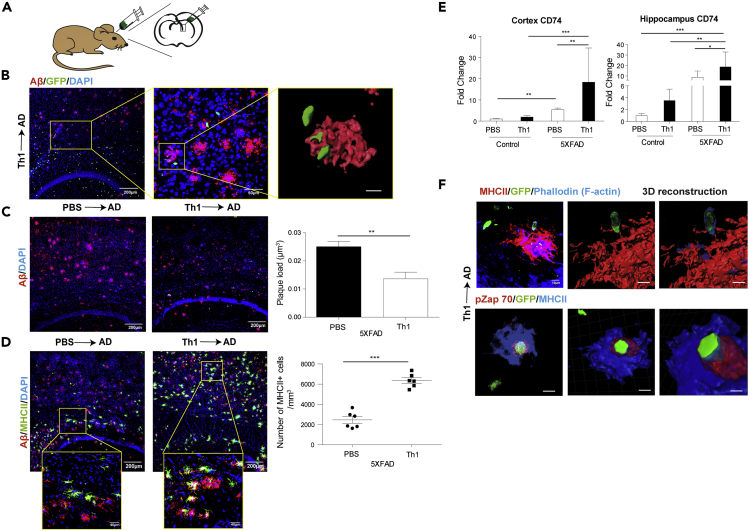
Figure 1 ICV Injection of Aβ-Th1 Cells to 5XFAD Mice Decreases Aβ Plaques in the Brain Associated with Increased Expression of MHCII by Parenchymal APCs Aβ-Th1 T cells were generated following the Aβ1–42 immunization of 2-month-old mice (Transparent Methods and Figure S1A). 5XFAD mice were ICV-injected with either Aβ-Th1 T cells or PBS, killed at 11 or 21 days post-injection (dpi), and their brains collected and analyzed by IHC or qPCR. (A) Illustration of a representative coronal view of the adult mouse brain and the injection site in the lateral ventricle. (B) A representative IHC image (left) of Aβ plaques co-localized with GFP+ T cells (green) in brain sections derived from 5XFAD mice 11 dpi of activated Aβ-Th1 cells. Sections were immunolabeled with anti-Aβ (red) and a DAPI nucleus counterstain (blue). The middle image is a higher magnification of the framed area, showing the interaction between Aβ and Aβ-Th1 T cells. The right image is a 3D reconstruction of z-sections (9.75 μm overall, 0.75 μm/slice) of the framed area. Scale bars, 200 μm (left), 50 μm (middle), and 5 μm (right). (C) Representative IHC images showing Aβ plaque load in brain sections derived from 5XFAD mice ICV-injected with either PBS (PBS→AD, left) or Aβ-Th1 T cells (Th1→AD, right). Sections were taken at 21 dpi (n = 4–5 mice per group) and immunolabeled with anti-Aβ plaques (red) and a DAPI nucleus counterstain (blue). Scale bars, 200 μm. The quantitative analysis of the Aβ plaque load in the cortex (right graph) was performed with IMARIS and shows the mean ± SEM results of one experiment out of four performed. (D) Representative IHC images showing the upregulation of MHCII+ cells in brain sections derived from either PBS→AD (left) or Th1→AD (right) mice at 21 dpi (n = 6 mice per group), immunolabeled with anti-MHCII (green), anti-Aβ (red), and a DAPI nucleus counterstain (blue). The higher magnifications of the framed areas reveal MHCII+ cells accumulating near the Aβ plaques. Scale bars, 200 μm in the low-magnification images and 50 μm in the high-magnification images. The quantitative analysis of the number of MHCII+ cells per volume of cortical section (right graph) was performed with IMARIS. Each symbol represents an individual mouse, whereas the horizontal lines indicate the mean ± SEM of one experiment out of four performed. (E) qPCR analysis of CD74 expression in the cortex (left) and hippocampus (right) of Th1→AD and PBS→AD mice at 21 dpi (n = 6–7 mice per group). Bars represent means ± SEM. (F) Representative IHC images demonstrating an immunological synapse between MHCII+ cells and GFP+ T cells in brain sections derived from Th1→AD mice at 11 dpi (n = 5 mice) and immunolabeled with anti-phalloidin (cytoskeletal marker, blue), anti-MHCII (red), and GFP T cells (top images), or with anti-Zap70 (phospho Tyr 319) (red), anti-MHCII (blue), GFP T cells, and a DAPI nucleus counterstain (gray) (bottom images). In the top images, the middle and right panels are 3D reconstructions of z-sections (11.25 μm overall, 0.75 μm/slice). Scale bars, 10 μm. In the bottom images, the middle and right images are a 3D reconstruction of z-sections (7 μm overall, 0.5 μm/slice), which was then sliced in the xy axis. The front orientation of the xy-sliced 3D reconstruction shows an immunological synapse via Zap70 (phospho Tyr 319) (right). Scale bars, 10 μm (left) and 5 μm (middle and right images). *p < 0.05, **p < 0.01, ***p < 0.001 ((C and D) Student's t test and (E) one-way ANOVA).
Figure 1 ICV Injection of Aβ-Th1 Cells to 5XFAD Mice Decreases Aβ Plaques in the Brain Associated with Increased Expression of MHCII by Parenchymal APCs Aβ-Th1 T cells were generated following the Aβ1–42 immunization of 2-month-old mice (Transparent Methods and Figure S1A). 5XFAD mice were ICV-injected with either Aβ-Th1 T cells or PBS, killed at 11 or 21 days post-injection (dpi), and their brains collected and analyzed by IHC or qPCR. (A) Illustration of a representative coronal view of the adult mouse brain and the injection site in the lateral ventricle. (B) A representative IHC image (left) of Aβ plaques co-localized with GFP+ T cells (green) in brain sections derived from 5XFAD mice 11 dpi of activated Aβ-Th1 cells. Sections were immunolabeled with anti-Aβ (red) and a DAPI nucleus counterstain (blue). The middle image is a higher magnification of the framed area, showing the interaction between Aβ and Aβ-Th1 T cells. The right image is a 3D reconstruction of z-sections (9.75 μm overall, 0.75 μm/slice) of the framed area. Scale bars, 200 μm (left), 50 μm (middle), and 5 μm (right). (C) Representative IHC images showing Aβ plaque load in brain sections derived from 5XFAD mice ICV-injected with either PBS (PBS→AD, left) or Aβ-Th1 T cells (Th1→AD, right). Sections were taken at 21 dpi (n = 4–5 mice per group) and immunolabeled with anti-Aβ plaques (red) and a DAPI nucleus counterstain (blue). Scale bars, 200 μm. The quantitative analysis of the Aβ plaque load in the cortex (right graph) was performed with IMARIS and shows the mean ± SEM results of one experiment out of four performed. (D) Representative IHC images showing the upregulation of MHCII+ cells in brain sections derived from either PBS→AD (left) or Th1→AD (right) mice at 21 dpi (n = 6 mice per group), immunolabeled with anti-MHCII (green), anti-Aβ (red), and a DAPI nucleus counterstain (blue). The higher magnifications of the framed areas reveal MHCII+ cells accumulating near the Aβ plaques. Scale bars, 200 μm in the low-magnification images and 50 μm in the high-magnification images. The quantitative analysis of the number of MHCII+ cells per volume of cortical section (right graph) was performed with IMARIS. Each symbol represents an individual mouse, whereas the horizontal lines indicate the mean ± SEM of one experiment out of four performed. (E) qPCR analysis of CD74 expression in the cortex (left) and hippocampus (right) of Th1→AD and PBS→AD mice at 21 dpi (n = 6–7 mice per group). Bars represent means ± SEM. (F) Representative IHC images demonstrating an immunological synapse between MHCII+ cells and GFP+ T cells in brain sections derived from Th1→AD mice at 11 dpi (n = 5 mice) and immunolabeled with anti-phalloidin (cytoskeletal marker, blue), anti-MHCII (red), and GFP T cells (top images), or with anti-Zap70 (phospho Tyr 319) (red), anti-MHCII (blue), GFP T cells, and a DAPI nucleus counterstain (gray) (bottom images). In the top images, the middle and right panels are 3D reconstructions of z-sections (11.25 μm overall, 0.75 μm/slice). Scale bars, 10 μm. In the bottom images, the middle and right images are a 3D reconstruction of z-sections (7 μm overall, 0.5 μm/slice), which was then sliced in the xy axis. The front orientation of the xy-sliced 3D reconstruction shows an immunological synapse via Zap70 (phospho Tyr 319) (right). Scale bars, 10 μm (left) and 5 μm (middle and right images). *p < 0.05, **p < 0.01, ***p < 0.001 ((C and D) Student's t test and (E) one-way ANOVA).CC BY-NC-ND · PubMed Central
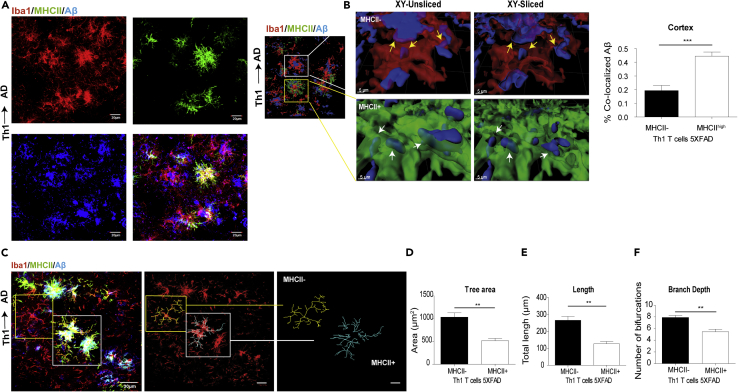
Figure 2 MHCII+ Cells Are More Phagocytic and Less Ramified than MHCII− Cells in 5XFAD Mice ICV-Injected with Aβ-Th1 Cells 5XFAD mice were ICV-injected with either Aβ-Th1 T cells or PBS, killed at 21 dpi, and their brains collected and analyzed by IHC. (A) Representative IHC images showing the accumulation of Iba1+ and MHCII + cells at the vicinity of plaque in brain sections derived from Th1→AD mice at 21 dpi and immunolabeled with anti-Iba1 (red), anti-MHCII (green), and anti-Aβ (blue). The rightmost lower panel shows the merged image. (B) The left image is a 3D reconstruction of z-sections (17.25 μm overall, 0.75 μm/slice), demonstrating the co-localization of Aβ with MHCII− and MHCII+ cells. The images in the middle are higher magnifications of the framed areas, showing MHCII− (top) and MHCII+ (bottom) cells. The images on the right are xy plane slices of the 3D reconstructions. Scale bars, 30 μm (left image) and 5 μm (middle and right images). The yellow and white arrows indicate the co-localization of Aβ with MHCII− and MHCII+ cells, respectively. A quantitative analysis (right graph) of the percentage of Aβ that was co-localized with MHCII− or MHCII + cells in the cortex was conducted with IMARIS. Bars represent means ± SEM. (C) Representative IHC images showing the backbone of single cells (yellow and white frames indicate MHCII− and MHCII + cells, respectively), traced manually with the IMARIS Filament Tracer plug-in (middle and right images). (D–F) Quantitative morphometric analyses of randomly selected MHCII+ and MHCII− cortical microglia (layer 2 or 3), performed with IMARIS and statistically analyzed with GraphPad. Bars represent the means ± SEM of the total tree area (D), total branch length (E), and branch depth (F) in one experiment out of four performed (n = 5 mice per group). **p < 0.01, ***p < 0.001 (Student's t test).
Figure 2 MHCII+ Cells Are More Phagocytic and Less Ramified than MHCII− Cells in 5XFAD Mice ICV-Injected with Aβ-Th1 Cells 5XFAD mice were ICV-injected with either Aβ-Th1 T cells or PBS, killed at 21 dpi, and their brains collected and analyzed by IHC. (A) Representative IHC images showing the accumulation of Iba1+ and MHCII + cells at the vicinity of plaque in brain sections derived from Th1→AD mice at 21 dpi and immunolabeled with anti-Iba1 (red), anti-MHCII (green), and anti-Aβ (blue). The rightmost lower panel shows the merged image. (B) The left image is a 3D reconstruction of z-sections (17.25 μm overall, 0.75 μm/slice), demonstrating the co-localization of Aβ with MHCII− and MHCII+ cells. The images in the middle are higher magnifications of the framed areas, showing MHCII− (top) and MHCII+ (bottom) cells. The images on the right are xy plane slices of the 3D reconstructions. Scale bars, 30 μm (left image) and 5 μm (middle and right images). The yellow and white arrows indicate the co-localization of Aβ with MHCII− and MHCII+ cells, respectively. A quantitative analysis (right graph) of the percentage of Aβ that was co-localized with MHCII− or MHCII + cells in the cortex was conducted with IMARIS. Bars represent means ± SEM. (C) Representative IHC images showing the backbone of single cells (yellow and white frames indicate MHCII− and MHCII + cells, respectively), traced manually with the IMARIS Filament Tracer plug-in (middle and right images). (D–F) Quantitative morphometric analyses of randomly selected MHCII+ and MHCII− cortical microglia (layer 2 or 3), performed with IMARIS and statistically analyzed with GraphPad. Bars represent the means ± SEM of the total tree area (D), total branch length (E), and branch depth (F) in one experiment out of four performed (n = 5 mice per group). **p < 0.01, ***p < 0.001 (Student's t test).CC BY-NC-ND · PubMed Central
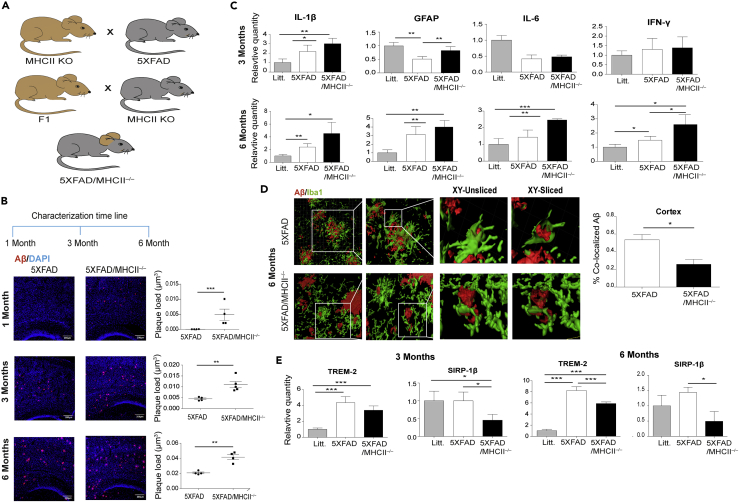
Figure 3 MHCII-Knockout 5XFAD Mice Exhibit An Exacerbated Amyloid Pathology Immune-deficient 5XFAD mice lacking MHCII (5XFAD/MHCII−/−) were generated, and their plaque pathology, neuroinflammation, and phagocytic clearance were characterized. 5XFAD/MHCII−/− and age-matched 5XFAD mice (n = 4–5 mice per group) were killed at 1, 3, or 6 months of age, and their brain samples were analyzed by IHC or qPCR. (A) A breeding diagram of the strategy used to generate 5XFAD/MHCII−/− mice. (B) Representative IHC images showing Aβ plaque pathology at 1, 3, and 6 months of age in brain sections derived from 5XFAD and 5XFAD/MHCII−/− mice and immunolabeled for anti-Aβ (red) and a DAPI nucleus counterstain (blue). Quantitative analyses of the Aβ plaque load per volume of cortical section (right graphs) were performed with IMARIS. Each symbol represents one mouse, and the bars represent means ± SEM. (C) A qPCR analysis of the pro-inflammatory cytokines IL-1β, IL-6, and IFN-γ and the astrogliosis marker GFAP in the brains of 3- (top panels) and 6-month-old (bottom panels) 5XFAD mice, 5XFAD/MHCII−/− mice, and littermate control mice. Bars represent means ± SEM. (D) The 3D reconstructions (left images) of z-sections (21 μm overall, 0.75 μm/slice) in cortical sections. The images to the right are higher magnifications of the framed areas, showing the co-localization of Aβ with Iba1+ cells (unsliced and sliced) in brain sections of 5XFAD (top panels) and 5XFAD/MHCII−/− (bottom panels) mice. Scale bars, 30 μm (left images) and 5 μm (all other images). The quantitative analysis (right graph) of the percentage of Aβ co-localized with Iba1+ microglia in the cortex was performed with IMARIS. Bars represent means ± SEM. (E) A qPCR analysis of the phagocytic markers TREM2 and SIRP-1β in the cortex of 3- and 6-month-old mice. Bars represent means ± SEM. *p < 0.05, **p < 0.01, ***p < 0.001 ((B and D) Student's t test, (C and E) one-way ANOVA).
Figure 3 MHCII-Knockout 5XFAD Mice Exhibit An Exacerbated Amyloid Pathology Immune-deficient 5XFAD mice lacking MHCII (5XFAD/MHCII−/−) were generated, and their plaque pathology, neuroinflammation, and phagocytic clearance were characterized. 5XFAD/MHCII−/− and age-matched 5XFAD mice (n = 4–5 mice per group) were killed at 1, 3, or 6 months of age, and their brain samples were analyzed by IHC or qPCR. (A) A breeding diagram of the strategy used to generate 5XFAD/MHCII−/− mice. (B) Representative IHC images showing Aβ plaque pathology at 1, 3, and 6 months of age in brain sections derived from 5XFAD and 5XFAD/MHCII−/− mice and immunolabeled for anti-Aβ (red) and a DAPI nucleus counterstain (blue). Quantitative analyses of the Aβ plaque load per volume of cortical section (right graphs) were performed with IMARIS. Each symbol represents one mouse, and the bars represent means ± SEM. (C) A qPCR analysis of the pro-inflammatory cytokines IL-1β, IL-6, and IFN-γ and the astrogliosis marker GFAP in the brains of 3- (top panels) and 6-month-old (bottom panels) 5XFAD mice, 5XFAD/MHCII−/− mice, and littermate control mice. Bars represent means ± SEM. (D) The 3D reconstructions (left images) of z-sections (21 μm overall, 0.75 μm/slice) in cortical sections. The images to the right are higher magnifications of the framed areas, showing the co-localization of Aβ with Iba1+ cells (unsliced and sliced) in brain sections of 5XFAD (top panels) and 5XFAD/MHCII−/− (bottom panels) mice. Scale bars, 30 μm (left images) and 5 μm (all other images). The quantitative analysis (right graph) of the percentage of Aβ co-localized with Iba1+ microglia in the cortex was performed with IMARIS. Bars represent means ± SEM. (E) A qPCR analysis of the phagocytic markers TREM2 and SIRP-1β in the cortex of 3- and 6-month-old mice. Bars represent means ± SEM. *p < 0.05, **p < 0.01, ***p < 0.001 ((B and D) Student's t test, (C and E) one-way ANOVA).CC BY-NC-ND · PubMed Central
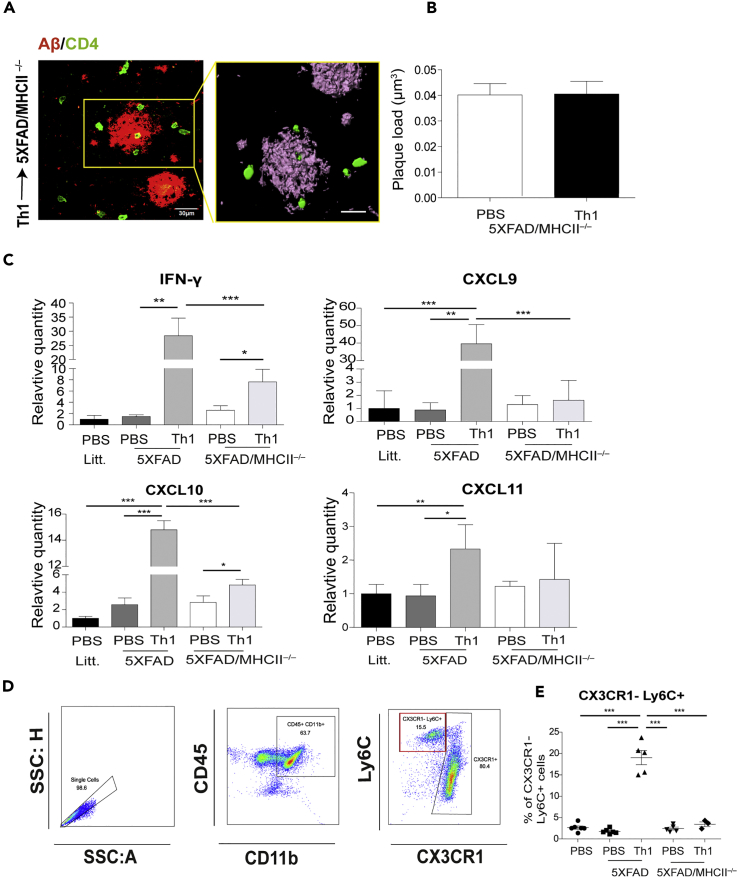
Figure 4 ICV-Injected Aβ-Th1 Cells Exhibit Reduced Effector Functions in 5XFAD/MHCII−/− Mice 5XFAD and 5XFAD/MHCII−/− mice were ICV-injected with either Aβ-Th1 T cells or PBS (n = 4–5 mice per group), killed at 21 dpi, and their brains collected and analyzed with IHC, qPCR, or flow cytometry. (A) Representative IHC images showing Aβ plaques co-localized with GFP+ T cells in brain sections derived from 5XFAD/MHCII−/− mice at 21 dpi and immunolabeled with anti-Aβ (red) and anti-CD4 (green). The right image is a 3D reconstruction of z-sections (22.5 μm overall, 0.75 μm/slice) of the framed area. Scale bars, 30 μm (left) and 10 μm (right). (B) The quantitative analysis (right graph) of Aβ plaque load per volume of the cortical section in 5XFAD/MHCII−/− mice ICV-injected with either PBS or Th1 T cells (right) was performed with IMARIS. Bars represent means ± SEM. (C) qPCR analysis of IFN-γ and the chemokines CXCL9, CXCL10, and CXCL11 in the different groups of mice. Bars represent means ± SEM. (D) Flow cytometry plots demonstrating the gating strategy for myeloid cells (CD45+ CD11b+; middle) and presumed infiltrated macrophages (Ly6C+ CX3CR1−; right). (E) The frequency of CX3CR1−Ly6C+ cells in all groups. Bars represent means ± SEM of one experiment out of two performed. Each symbol represents an individual mouse. *p < 0.05, **p < 0.01, ***p < 0.001 (one-way ANOVA).
Figure 4 ICV-Injected Aβ-Th1 Cells Exhibit Reduced Effector Functions in 5XFAD/MHCII−/− Mice 5XFAD and 5XFAD/MHCII−/− mice were ICV-injected with either Aβ-Th1 T cells or PBS (n = 4–5 mice per group), killed at 21 dpi, and their brains collected and analyzed with IHC, qPCR, or flow cytometry. (A) Representative IHC images showing Aβ plaques co-localized with GFP+ T cells in brain sections derived from 5XFAD/MHCII−/− mice at 21 dpi and immunolabeled with anti-Aβ (red) and anti-CD4 (green). The right image is a 3D reconstruction of z-sections (22.5 μm overall, 0.75 μm/slice) of the framed area. Scale bars, 30 μm (left) and 10 μm (right). (B) The quantitative analysis (right graph) of Aβ plaque load per volume of the cortical section in 5XFAD/MHCII−/− mice ICV-injected with either PBS or Th1 T cells (right) was performed with IMARIS. Bars represent means ± SEM. (C) qPCR analysis of IFN-γ and the chemokines CXCL9, CXCL10, and CXCL11 in the different groups of mice. Bars represent means ± SEM. (D) Flow cytometry plots demonstrating the gating strategy for myeloid cells (CD45+ CD11b+; middle) and presumed infiltrated macrophages (Ly6C+ CX3CR1−; right). (E) The frequency of CX3CR1−Ly6C+ cells in all groups. Bars represent means ± SEM of one experiment out of two performed. Each symbol represents an individual mouse. *p < 0.05, **p < 0.01, ***p < 0.001 (one-way ANOVA).CC BY-NC-ND · PubMed Central
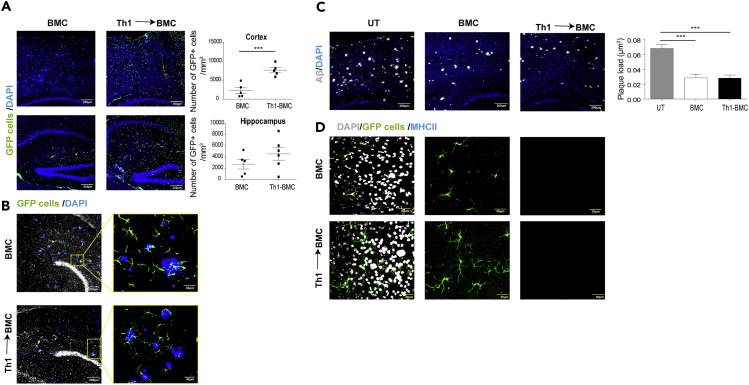
Figure 5 Microglial Expression of MHCII Is Required to Stimulate the Effector Functions of ICV-Injected Aβ-Th1 Cells within the Brain Parenchyma Bone marrow chimera (BMC) mice (n = 12) were generated, and after 8 weeks, six of them were ICV-injected with Aβ-Th1 T cells, whereas the other six were left untreated. The mice were perfused at 28 dpi, and their brains were excised and analyzed by IHC and flow cytometry. (A) Representative IHC images of cortical (top images) and hippocampal (bottom images) brain sections from untreated BMC mice (left) and from BMC mice that were ICV-injected with Aβ-Th1 T cells (Th1→BMC, right) (n = 5 mice per group) and immunolabeled with DAPI nucleus counterstain (blue). Green cells are infiltrating macrophages. A quantitative analysis (right graphs) of the number of GFP+ cells per volume of cortical or hippocampal section was performed with IMARIS. Scale bars, 200 μm. Bars represent means ± SEM, and each symbol represents an individual mouse. (B) Representative IHC image showing Aβ plaques co-localized with infiltrated GFP+ BM cells in brain sections derived from either BMC or Aβ-Th1→BMC mice and immunolabeled with the DAPI nucleus counterstain (blue) (n = 5 mice per group). Scale bars, 200 μm (left images) and 30 μm (right images). (C) Representative IHC image showing Aβ plaque load in brain sections derived from untreated (UT), BMC, or Aβ-Th1→BMC mice and immunolabeled with anti-Aβ (gray) and a DAPI nucleus counterstain (blue). The quantitative analysis (right graph) of the plaque load per volume of cortical section was performed with IMARIS. Scale bars, 200 μm. Bars represent means ± SEM. (D) Representative IHC images of brain sections derived from untreated BMC mice (top images) or from Aβ-Th1→BMC mice (bottom images) and immunolabeled with anti-MHCII (blue) and a DAPI nucleus counterstain (gray). Green cells represent infiltrating BM cells. Scale bars, 30 μm. ***p < 0.001 [(A) Student's t-test, (C) one-way ANOVA].
Figure 5 Microglial Expression of MHCII Is Required to Stimulate the Effector Functions of ICV-Injected Aβ-Th1 Cells within the Brain Parenchyma Bone marrow chimera (BMC) mice (n = 12) were generated, and after 8 weeks, six of them were ICV-injected with Aβ-Th1 T cells, whereas the other six were left untreated. The mice were perfused at 28 dpi, and their brains were excised and analyzed by IHC and flow cytometry. (A) Representative IHC images of cortical (top images) and hippocampal (bottom images) brain sections from untreated BMC mice (left) and from BMC mice that were ICV-injected with Aβ-Th1 T cells (Th1→BMC, right) (n = 5 mice per group) and immunolabeled with DAPI nucleus counterstain (blue). Green cells are infiltrating macrophages. A quantitative analysis (right graphs) of the number of GFP+ cells per volume of cortical or hippocampal section was performed with IMARIS. Scale bars, 200 μm. Bars represent means ± SEM, and each symbol represents an individual mouse. (B) Representative IHC image showing Aβ plaques co-localized with infiltrated GFP+ BM cells in brain sections derived from either BMC or Aβ-Th1→BMC mice and immunolabeled with the DAPI nucleus counterstain (blue) (n = 5 mice per group). Scale bars, 200 μm (left images) and 30 μm (right images). (C) Representative IHC image showing Aβ plaque load in brain sections derived from untreated (UT), BMC, or Aβ-Th1→BMC mice and immunolabeled with anti-Aβ (gray) and a DAPI nucleus counterstain (blue). The quantitative analysis (right graph) of the plaque load per volume of cortical section was performed with IMARIS. Scale bars, 200 μm. Bars represent means ± SEM. (D) Representative IHC images of brain sections derived from untreated BMC mice (top images) or from Aβ-Th1→BMC mice (bottom images) and immunolabeled with anti-MHCII (blue) and a DAPI nucleus counterstain (gray). Green cells represent infiltrating BM cells. Scale bars, 30 μm. ***p < 0.001 [(A) Student's t-test, (C) one-way ANOVA].CC BY-NC-ND · PubMed Central
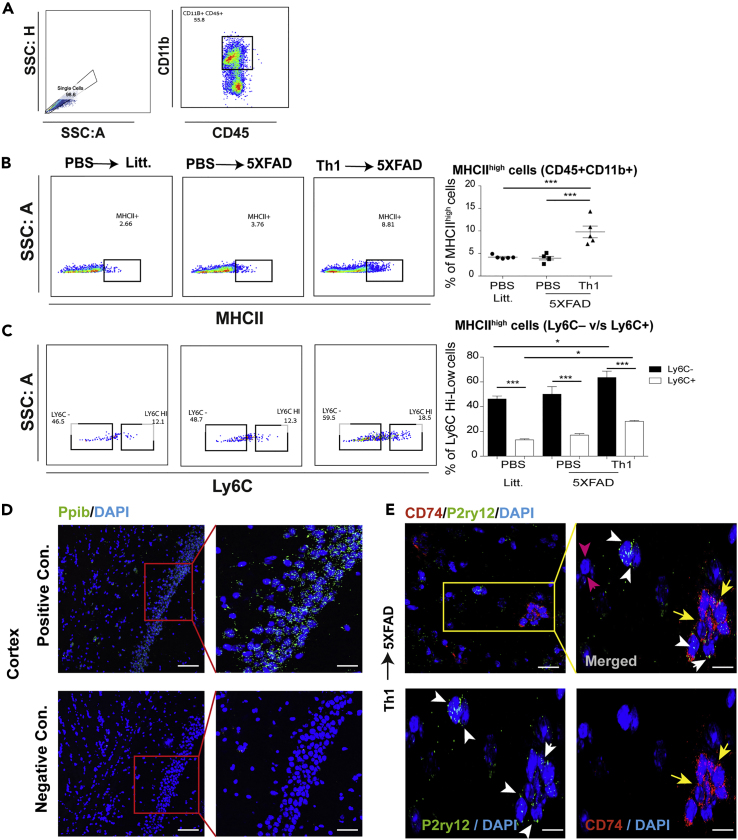
Figure 6 Aβ-Th1 T Cells Upregulate MHCII Expression in Brain Endogenous Microglia of 5XFAD Mice 5XFAD and littermate (litt.) control mice were ICV-injected with either Aβ-Th1 T cells or PBS, killed at 14 or 21 dpi, and their brains excised and analyzed by using RNAscope (14 dpi) or flow cytometry (21 dpi). (A) Flow cytometry plots demonstrating the gating strategy from single cells (left) to myeloid cells (CD45+ CD11b+; right). (B) Flow cytometry plots demonstrating MHCII+ cells (out of CD11b+ CD45+ cells) in PBS→litt mice (left), PBS→5XFAD mice (middle), and Th1→5XFAD mice (right). The frequency of MHCII+ cells was quantified for all groups (right graph). Each symbol represents an individual mouse (n = 5 mice per group), and the bars represent means ± SEM of one experiment out of four performed. (C) Flow cytometry plots demonstrating Ly6C+ cells (out of MHCII+ CD11b+ CD45+ cells) in the above-mentioned groups. The frequency of Ly6C+ cells was quantified for all groups (right graph). Each symbol represents an individual mouse (n = 5 per group), and the bars represent means ± SEM. (D) Representative RNAscope fluorescence in situ hybridization images showing the co-expression of CD74 (red), P2ry12 (green) mRNA, and a DAPI nucleus counterstain (blue) in brain sections derived from Aβ-Th1→5XFAD mice (n = 5). Representative images of positive Ppib (green) and negative controls. Each puncta indicates a single mRNA molecule. The rectangular box demonstrates higher magnification of the framed area. (E) A representative image showing P2ry12- (green) and CD74- (red) expressing cells. A higher magnification merge image of the framed area (top right panel) and the single-channel images (lower panels) show P2ry12+ (white arrows), P2ry12− (pink arrows), and CD74+ (yellow arrows) cells. Scale bars, 50 and 10 μm. *p < 0.05, ***p < 0.001 (one-way ANOVA).
Figure 6 Aβ-Th1 T Cells Upregulate MHCII Expression in Brain Endogenous Microglia of 5XFAD Mice 5XFAD and littermate (litt.) control mice were ICV-injected with either Aβ-Th1 T cells or PBS, killed at 14 or 21 dpi, and their brains excised and analyzed by using RNAscope (14 dpi) or flow cytometry (21 dpi). (A) Flow cytometry plots demonstrating the gating strategy from single cells (left) to myeloid cells (CD45+ CD11b+; right). (B) Flow cytometry plots demonstrating MHCII+ cells (out of CD11b+ CD45+ cells) in PBS→litt mice (left), PBS→5XFAD mice (middle), and Th1→5XFAD mice (right). The frequency of MHCII+ cells was quantified for all groups (right graph). Each symbol represents an individual mouse (n = 5 mice per group), and the bars represent means ± SEM of one experiment out of four performed. (C) Flow cytometry plots demonstrating Ly6C+ cells (out of MHCII+ CD11b+ CD45+ cells) in the above-mentioned groups. The frequency of Ly6C+ cells was quantified for all groups (right graph). Each symbol represents an individual mouse (n = 5 per group), and the bars represent means ± SEM. (D) Representative RNAscope fluorescence in situ hybridization images showing the co-expression of CD74 (red), P2ry12 (green) mRNA, and a DAPI nucleus counterstain (blue) in brain sections derived from Aβ-Th1→5XFAD mice (n = 5). Representative images of positive Ppib (green) and negative controls. Each puncta indicates a single mRNA molecule. The rectangular box demonstrates higher magnification of the framed area. (E) A representative image showing P2ry12- (green) and CD74- (red) expressing cells. A higher magnification merge image of the framed area (top right panel) and the single-channel images (lower panels) show P2ry12+ (white arrows), P2ry12− (pink arrows), and CD74+ (yellow arrows) cells. Scale bars, 50 and 10 μm. *p < 0.05, ***p < 0.001 (one-way ANOVA).CC BY-NC-ND · PubMed Central

Verification

Claims the paper makes

The claims and statistics of this paper haven’t been checked yet.

Run the check — free, no account needed. It reads the open-access text and checks the sources it cites.

A few free checks a day · papers already verified open instantly · results are public

Claims other papers make about this one

Each is checked against this paper’s own text: does it say what the citing paper says it does?

Self-check

Percentages, sums and reported differences re-computed from the paper’s own numbers.

The self-check needs the paper’s full text.

Citations

Cites

Show all 76 references

Cited by

Sorted by citations

See all 117

Metadata

Authors
Mittal, K., Eremenko, E., Berner, O., Elyahu, Y., Strominger, I., Apelblat, D., Nemirovsky, A., Spiegel, I., & Monsonego, A.
Affiliations
  • Ben-Gurion University of the Negev (IL)
  • Weizmann Institute of Science (IL)
Corresponding author
Monsonego, Alon
Venue
iScience
Publisher
Elsevier BV
Published
2019-06
Volume
16
Pages
298-311
ISSN
2589-0042 (ISSN-L)
OpenAlex
W2947933080
Cited by
114
References
76
Citations by year
2026: 13 · 2025: 17 · 2024: 28 · 2023: 17 · 2022: 16 · 2021: 10 · 2020: 13
FWCI
4.29
Type
journal article
Language
en
Open access
Locations
  • iScience (publishedVersion, cc-by-nc-nd)
  • PubMed Central (publishedVersion, cc-by-nc-nd)
  • PubMed (publishedVersion)
  • DOAJ (DOAJ: Directory of Open Access Journals) (submittedVersion, cc-by-sa)
Funders
  • Israel Science Foundation (684/14)
  • Litwin and Gural Foundations
Topics
  • Life Sciences › Neuroscience › Neurology › Neuroinflammation and Neurodegeneration Mechanisms
  • Life Sciences › Neuroscience › Cellular and Molecular Neuroscience › Alzheimer's disease research and treatments
  • Health Sciences › Medicine › Clinical Neurology › Multiple Sclerosis Research Studies
Keywords
Alzheimer's disease, microglia, CD4+ T cells, MHC class II, amyloid-beta, Th1 cells, interferon-gamma, amyloid plaque clearance, P2Y12 receptor, 5xFAD mice, innate immunity, phagocytosis, bone marrow chimeras, infiltrating macrophages

About these checks

Registry, retraction, Cites and statistics results are computed, not judged, with one exception: a printed reference that no index lists is read once by a model before it counts as a citation error. Claims are extracted by a model and kept only when their quote appears verbatim in the text; each cited source is then checked, with a model’s help, for whether it says what the claim relies on. Those verdicts can be wrong — read the claim’s quote and the cited source before relying on one.

Statistics and arithmetic are recomputed, not judged.

Confidence bands are shown only for fields calibrated on our annotated test set. None is calibrated yet, so no band is shown.

What counts as a claim ›How we measure confidence ›How we check this ›

Are you an author, or do you see a problem with this page? Request a review