

The DOI matches its Crossref record; 10 of the 10 references it cites were found in a registry or an index.
Generation of a human induced pluripotent stem cell–based model for tauopathies combining three microtubule‐associated protein TAU mutations which displays several phenotypes linked to neurodegeneration
Abstract
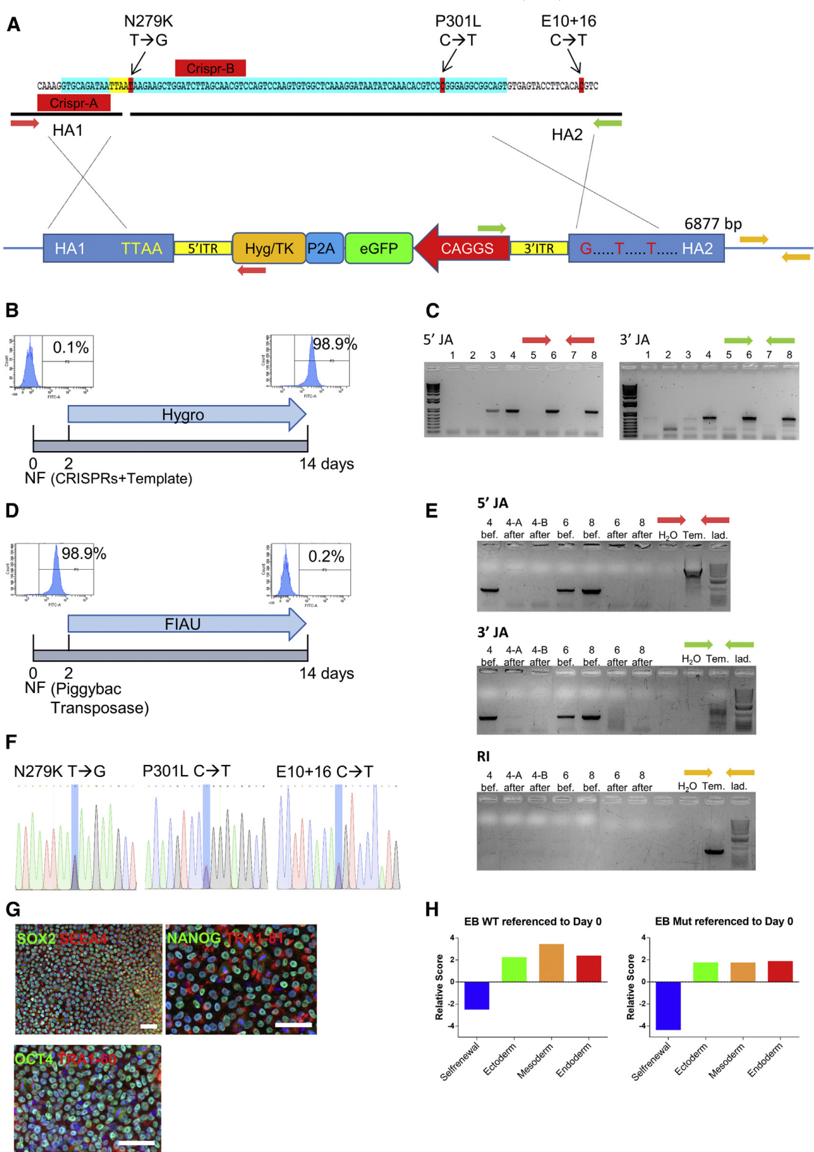
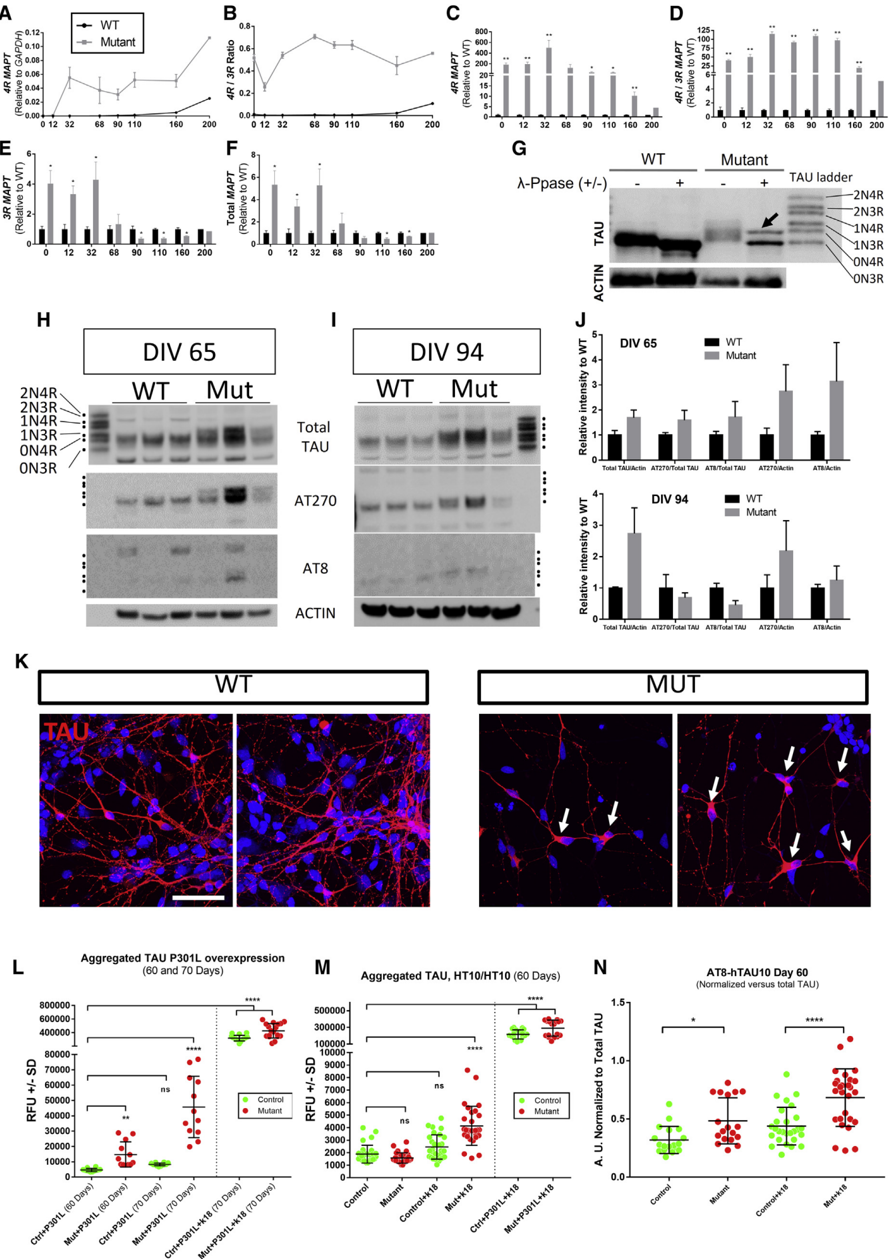
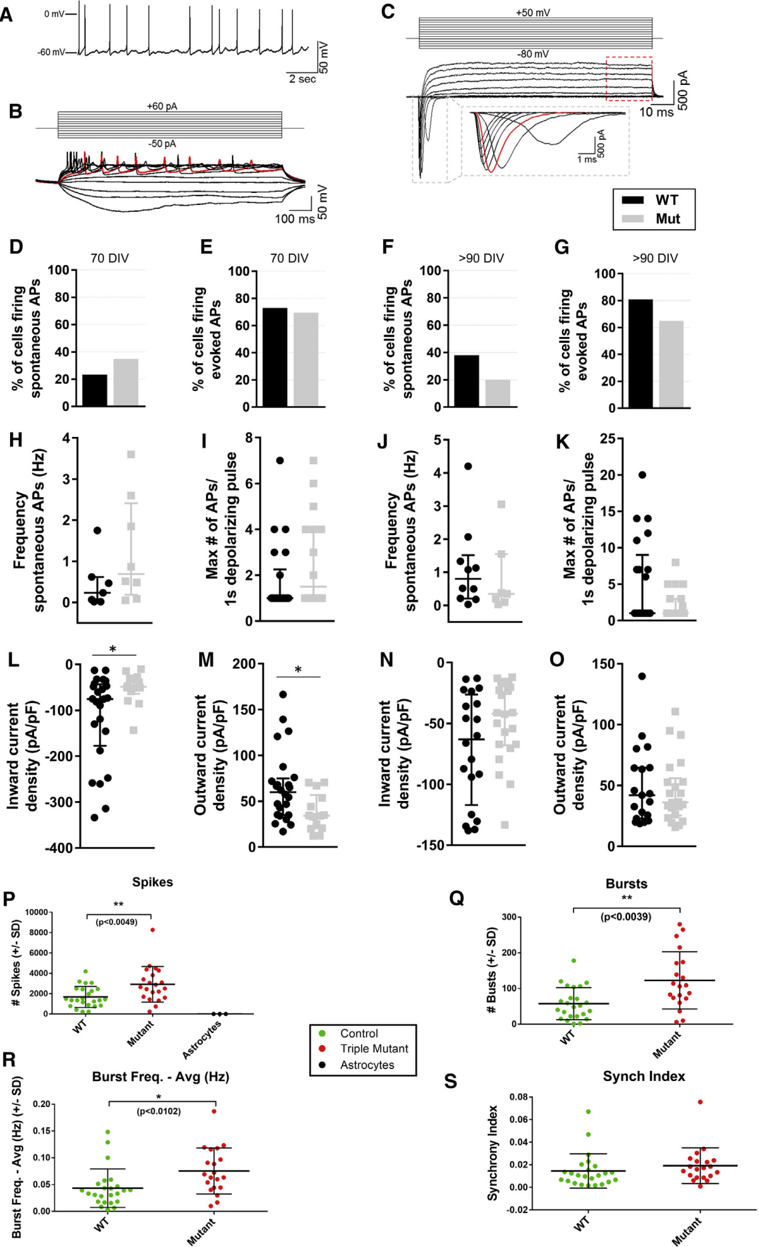
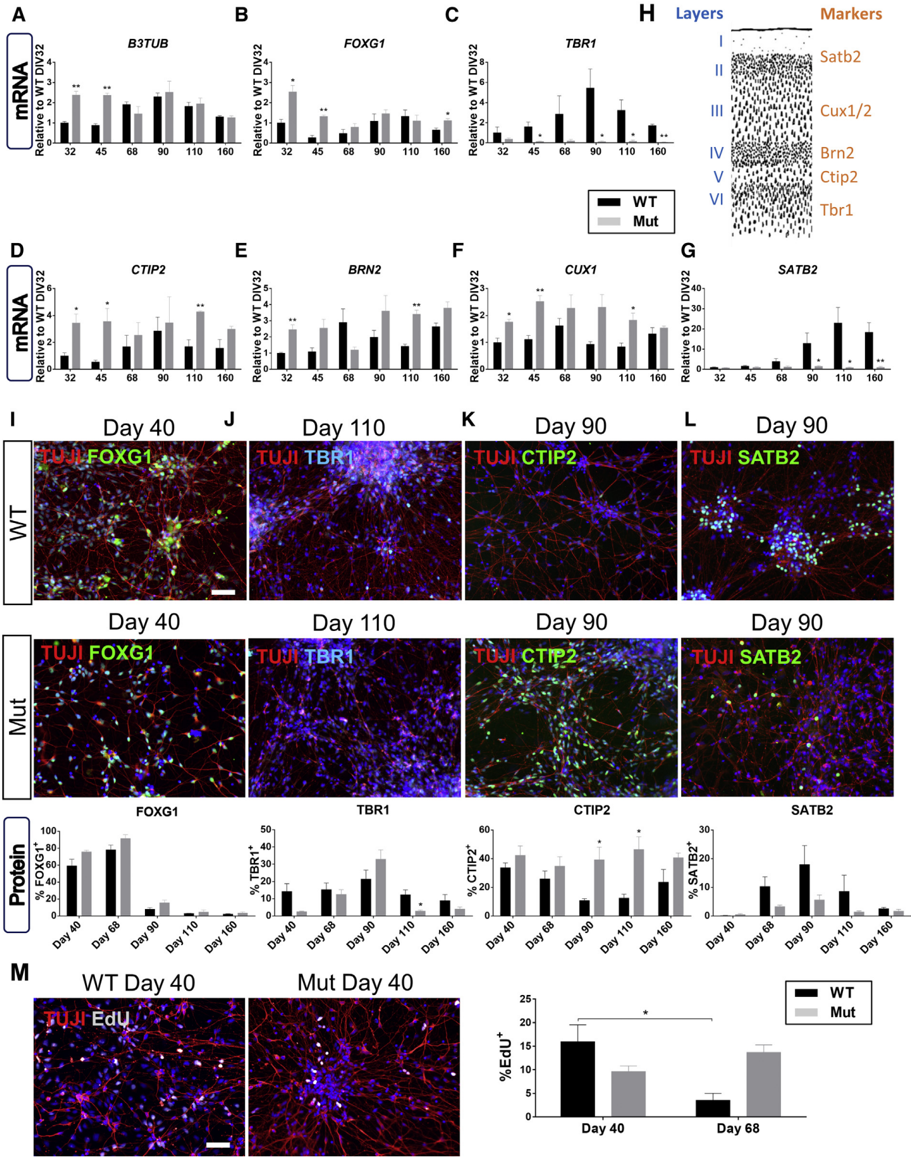
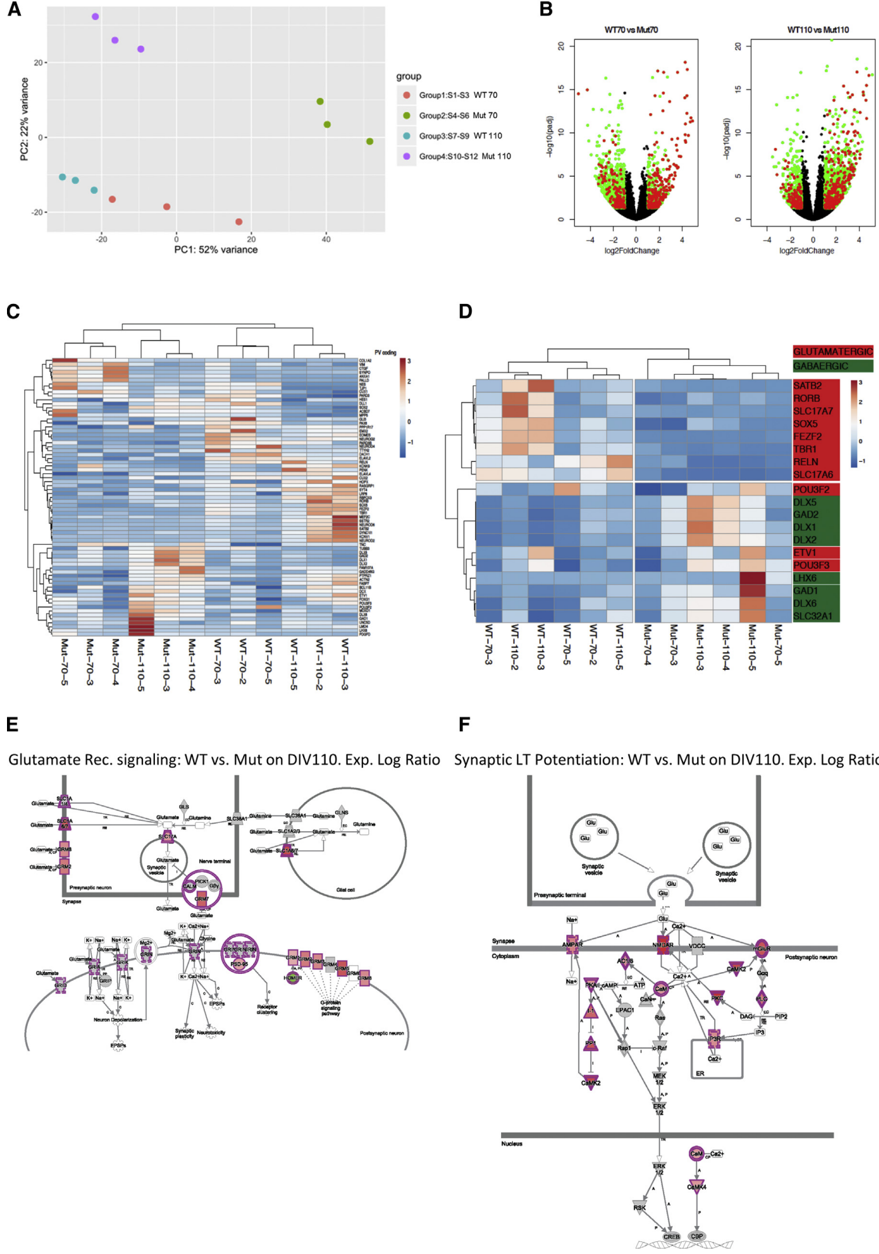
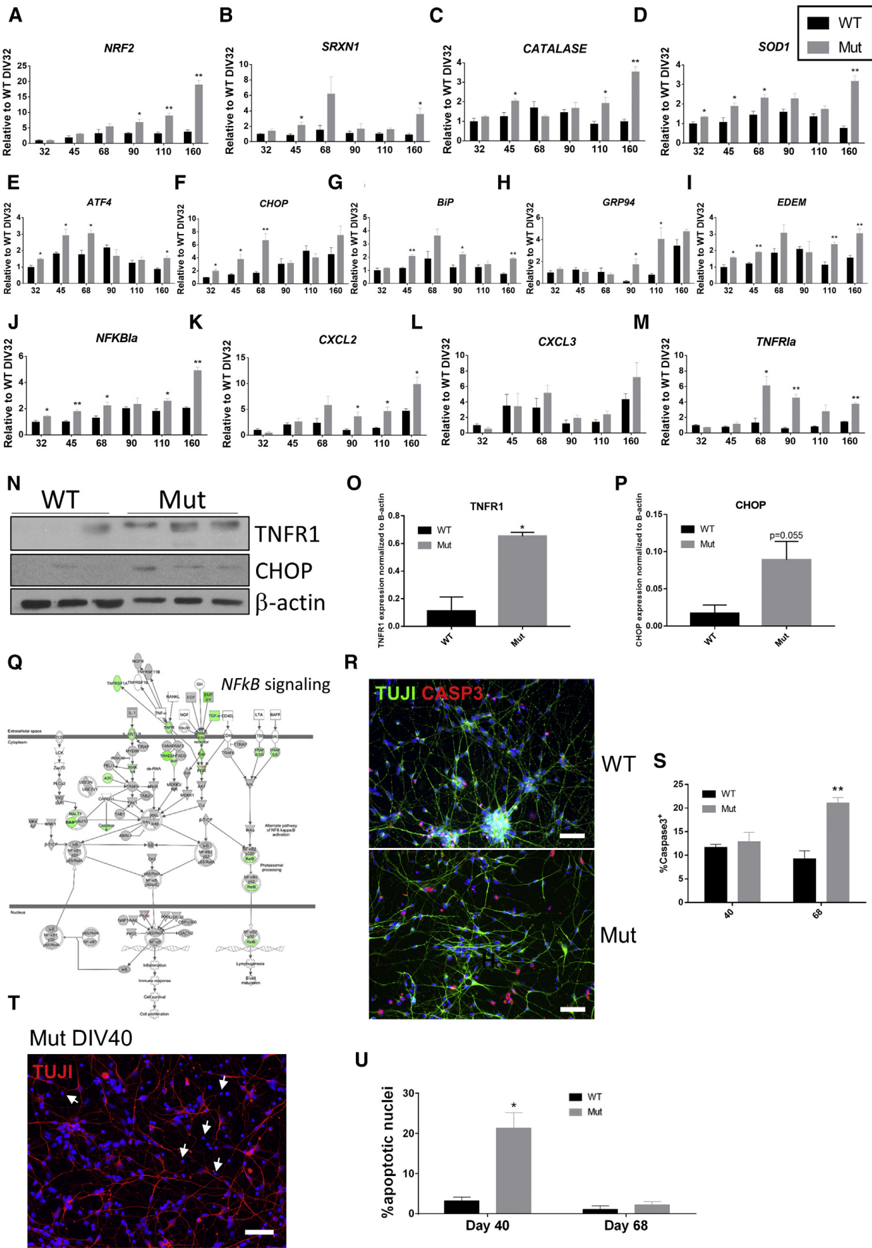
Introduction: Tauopathies are neurodegenerative diseases characterized by TAU protein–related pathology, including frontotemporal dementia and Alzheimer's disease among others. Mutant TAU animal models are available, but none of them faithfully recapitulates human pathology and are not suitable for drug screening. Methods: To create a new in vitro tauopathy model, we generated a footprint‐free triple MAPT‐mutant human induced pluripotent stem cell line (N279K, P301L, and E10+16 mutations) using clustered regularly interspaced short palindromic repeats‐FokI and piggyBac transposase technology. Results: Mutant neurons expressed pathogenic 4R and phosphorylated TAU, endogenously triggered TAU aggregation, and had increased electrophysiological activity. TAU‐mutant cells presented deficiencies in neurite outgrowth, aberrant sequence of differentiation to cortical neurons, and a significant activation of stress response pathways. RNA sequencing confirmed stress activation, demonstrated a shift toward GABAergic identity, and an upregulation of neurodegenerative pathways. Discussion: In summary, we generated a novel in vitro human induced pluripotent stem cell TAU‐mutant model displaying neurodegenerative disease phenotypes that could be used for disease modeling and drug screening.
Overview
The claims and statistics of this paper haven’t been checked yet.
Run the check — free, no account needed. It reads the open-access text and checks the sources it cites.
Integrity signals
Registry
Cites
Statistics
Figures
Verification
Claims the paper makes
The claims and statistics of this paper haven’t been checked yet.
Run the check — free, no account needed. It reads the open-access text and checks the sources it cites.
Claims other papers make about this one
Each is checked against this paper’s own text: does it say what the citing paper says it does?
In the citing paper
“tau knockout in primary hippocampal neurons and human iPSC-derived neurons reduces neurite outgrowth43–45.”
From Multi-omic phenotyping of MAPT V337M neurons reveals early changes in axonogenesis and tau phosphorylation (2026) · cites this paper as [45]
Self-check
Percentages, sums and reported differences re-computed from the paper’s own numbers.
The self-check needs the paper’s full text.
Citations
Cites
Excitatory actions of gaba during development: the nature of the nurture
Ben-Ari, Y. (2002) · Nature Reviews Neuroscience · doi:10.1038/nrn920 · Cited by 2,448
Dimeric CRISPR RNA-guided FokI nucleases for highly specific genome editing
Tsai, S. Q., Wyvekens, N., Khayter, C., Foden, J. A., Thapar, V., Reyon, D., Goodwin, M. J., Aryee, M. J., & Joung, J. K. (2014) · Nature Biotechnology · doi:10.1038/nbt.2908 · Cited by 952
Arendt, T., Stieler, J. T., & Holzer, M. (2016) · Brain Research Bulletin · doi:10.1016/j.brainresbull.2016.08.018 · Cited by 609
Advances in tau-focused drug discovery for Alzheimer's disease and related tauopathies
Brunden, K. R., Trojanowski, J. Q., & Lee, V. M.-Y. (2009) · Nature Reviews Drug Discovery · doi:10.1038/nrd2959 · Cited by 440
Tbr1 regulates regional and laminar identity of postmitotic neurons in developing neocortex
Bedogni, F., Hodge, R. D., Elsen, G. E., Nelson, B. R., Daza, R. A. M., Beyer, R. P., Bammler, T. K., Rubenstein, J. L. R., & Hevner, R. F. (2010) · Proceedings of the National Academy of Sciences · doi:10.1073/pnas.1002285107 · Cited by 322
Hallmarks of Alzheimer’s Disease in Stem-Cell-Derived Human Neurons Transplanted into Mouse Brain
Espuny-Camacho, I., Arranz, A. M., Fiers, M., Snellinx, A., Ando, K., Munck, S., Bonnefont, J., Lambot, L., Corthout, N., Omodho, L., et al. (2017) · Neuron · doi:10.1016/j.neuron.2017.02.001 · Cited by 244
Self-citationTau Oligomers: The Toxic Player at Synapses in Alzheimer’s Disease
Guerrero-Muñoz, M. J., Gerson, J., & Castillo-Carranza, D. L. (2015) · Frontiers in Cellular Neuroscience · doi:10.3389/fncel.2015.00464 · Cited by 168
Overproduction of Upper-Layer Neurons in the Neocortex Leads to Autism-like Features in Mice
Fang, W.-Q., Chen, W.-W., Jiang, L., Liu, K., Yung, W.-H., Fu, A. K. Y., & Ip, N. Y. (2014) · Cell Reports · doi:10.1016/j.celrep.2014.11.003 · Cited by 114
Ehrlich, M., Hallmann, A.-L., Reinhardt, P., Araúzo-Bravo, M. J., Korr, S., Röpke, A., Psathaki, O. E., Ehling, P., Meuth, S. G., Oblak, A. L., et al. (2015) · Stem Cell Reports · doi:10.1016/j.stemcr.2015.06.001 · Cited by 94
Cortical neurogenesis from pluripotent stem cells: complexity emerging from simplicity
Anderson, S., & Vanderhaeghen, P. (2014) · Current Opinion in Neurobiology · doi:10.1016/j.conb.2014.03.012 · Cited by 40
Research works printed but not linked: 38
- 10.1016/S0166-2236(98)01337-X · DOI · Paper page
- 10.1016/j.neuron.2013.12.003 · DOI · Paper page
- 10.1016/0896-6273(89)90210-9 · DOI · Paper page
- 10.1016/S0896-6273(00)80615-7 · DOI · Paper page
- 10.1101/cshperspect.a006254 · DOI
- 10.3389/fnagi.2015.00192 · DOI
- 10.1073/pnas.96.10.5598 · DOI
- 10.1111/j.1750-3639.2007.00051.x · DOI
- 10.1016/j.stemcr.2013.08.001 · DOI · Paper page
- 10.1186/s13024-015-0042-7 · DOI
- 10.1038/srep34904 · DOI
- 10.1007/s004010051052 · DOI
- 10.1038/31508 · DOI · Paper page
- 10.1038/nprot.2013.126 · DOI
- 10.1038/nprot.2012.116 · DOI · Paper page
- 10.1177/1087057116638029 · DOI
- 10.1093/brain/awv222 · DOI · Paper page
- 10.1038/nbt.3777 · DOI · Paper page
- 10.1002/glia.22990 · DOI
- 10.1155/2015/151979 · DOI
- 10.1007/s00401-017-1707-9 · DOI · Paper page
- 10.1016/j.neurobiolaging.2013.01.017 · DOI
- 10.1016/j.nbd.2015.10.007 · DOI
- 10.1002/path.3969 · DOI
- 10.1016/j.neuron.2010.11.030 · DOI · Paper page
- 10.1016/j.nlm.2010.12.005 · DOI
- 10.3233/JAD-122296 · DOI
- 10.1523/JNEUROSCI.2552-14.2015 · DOI
- 10.1007/s00401-012-1038-9 · DOI
- 10.1113/jphysiol.1989.sp017762 · DOI · Paper page
- 10.7554/eLife.20142 · DOI
- 10.1016/j.stemcr.2014.12.001 · DOI
- 10.1523/JNEUROSCI.1008-07.2007 · DOI
- 10.1038/nmeth.1323 · DOI
- 10.1093/nar/gkq319 · DOI
- 10.1016/j.stemcr.2015.09.004 · DOI
- 10.1016/j.cell.2010.12.032 · DOI · Paper page
- 10.1093/nar/gkv468 · DOI
Cited by
Microtubules gate tau condensation to spatially regulate microtubule functions
Tan, R., Lam, A. J., Tan, T., Han, J., Nowakowski, D. W., Vershinin, M., Simó, S., Ori-McKenney, K. M., & McKenney, R. J. (2019) · Nature Cell Biology · doi:10.1038/s41556-019-0375-5 · Cited by 231
Mohl, G. A., Dixon, G., Marzette, E., McKetney, J., Samelson, A. J., Serras, C. P., Jin, J., Ariqat, N., Keys, A., Chavira, C., et al. (2026) · npj Dementia · doi:10.1038/s44400-026-00076-w · Cited by 5
Metadata
- Authors
- García‐León, J. A., Cabrera‐Socorro, A., Eggermont, K., Swijsen, A., Terryn, J., Fazal, R., Nami, F., Ordovás, L., Quiles, A., Lluis, F., Serneels, L., Wierda, K., Sierksma, A., Kreir, M., Pestana, F., Van Damme, P., De Strooper, B., Thorrez, L., Ebneth, A., & Verfaillie, C. M.
- Venue
- Alzheimer's & Dementia
- Publisher
- Wiley
- Published
- 2018-07-20
- Volume
- 14
- Issue
- 10
- Pages
- 1261-1280
- ISSN
- 1552-5260
- 1552-5279
- Cited by
- 50
- References
- 10
- Language
- en
- Update notices
- correction (2020-04-22)
About these checks
Registry, retraction, Cites and statistics results are computed, not judged, with one exception: a printed reference that no index lists is read once by a model before it counts as a citation error. Claims are extracted by a model and kept only when their quote appears verbatim in the text; each cited source is then checked, with a model’s help, for whether it says what the claim relies on. Those verdicts can be wrong — read the claim’s quote and the cited source before relying on one.
Statistics and arithmetic are recomputed, not judged.
Confidence bands are shown only for fields calibrated on our annotated test set. None is calibrated yet, so no band is shown.
What counts as a claim ›How we measure confidence ›How we check this ›
Are you an author, or do you see a problem with this page? Request a review
Data sources
Bibliographic data: Semantic Scholar, OpenAlex, Crossref.
Contains information from the Semantic Scholar Academic Graph Datasets, made available under the ODC Attribution License (ODC-BY 1.0).
Semantic Scholar’s data is described in: Kinney, R., et al. (2023). The Semantic Scholar Open Data Platform. arXiv:2301.10140.
