Student or educator? Sign up with your school email and get 6 months of Pro free.
Cited by 9Poxvirus research and outbreaksEnzyme Structure and FunctionProtein Structure and Dynamics

The DOI matches its Crossref record; 49 of the 49 references it cites were found in a registry or an index.

The 2.3 Å Structure of A21, a Protein Component of the Conserved Poxvirus Entry-Fusion Complex

Open access

Published version of a preprint

Abstract

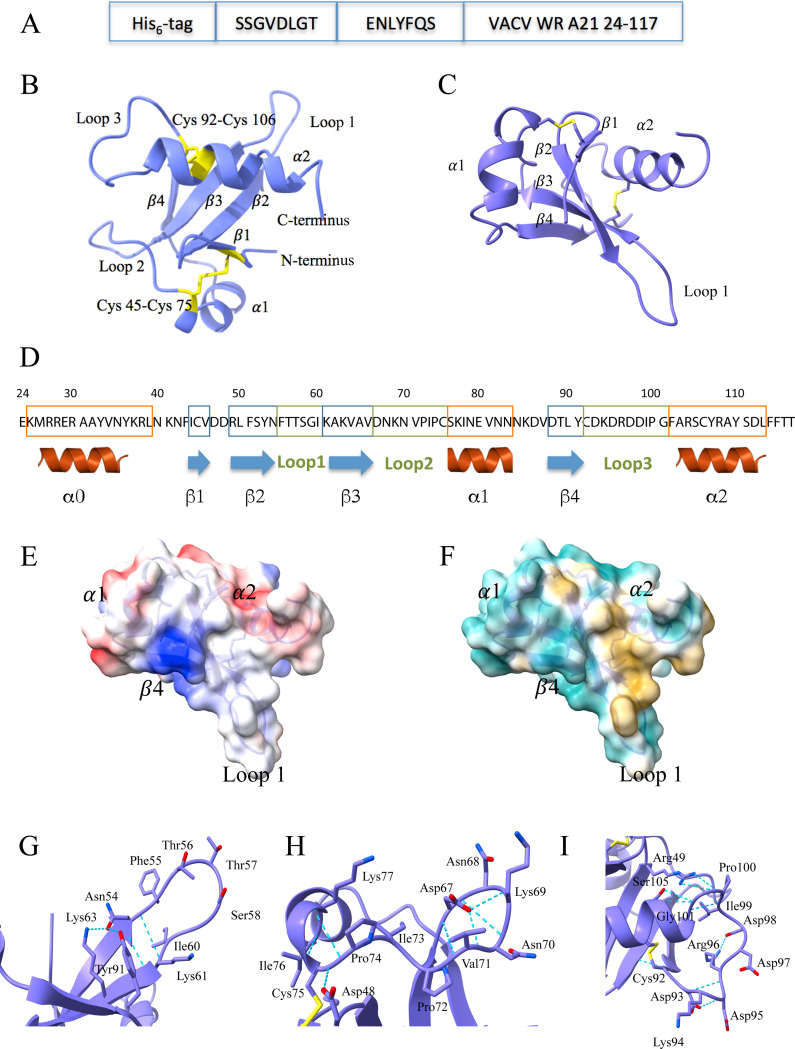
Poxviruses are exceptional in having an entry-fusion complex (EFC) consisting of eleven conserved proteins embedded in the membrane of mature virions. With the goal of understanding the function of the EFC, extensive efforts have been made to determine the structures and roles of its components, and to date, structures have been determined for nine of the eleven proteins. Here, we report the crystal structure of A21, the 10th EFC protein, comprising two α-helices clasping a twisted antiparallel β-sheet stabilized by two conserved disulfide bonds. The stability of each of the three A21 loops is provided by hydrogen bonds between main-chain atoms and several highly conserved residues, making the overall fold of A21 and its orthologs resilient to evolutionary change. Based on AlphaFold modeling and phylogenetic analysis of A21, we suggest that its highly conserved N-terminal transmembrane domain and C-terminal α-helix enable A21 integration into EFC, where it primarily interacts with the G3/L5 subcomplex and the smallest of EFC components, the O3 protein.

Overview

The claims and statistics of this paper haven’t been checked yet.

Run the check — free, no account needed. It reads the open-access text and checks the sources it cites.

A few free checks a day · papers already verified open instantly · results are public

Integrity signals

Registry

Crossref · 10.1016/j.jmb.2025.169097

Cites

49 of 49 references verified0 citation errors · 0 not checkable

Statistics

Figures

Figure 1. A21 structure and analysis. A, Expression construct of the A21 ectodomain. Shown are the His6-tag for affinity purification, the SSGVDLGT linker, the tobacco etch virus (TEV) protease recognition sequence ENLYFQS, and residues 24–117 of A21 from vaccinia virus Western Reserve strain (VACV WR). B, X-ray crystal structure of A21. Ribbon trace (purple) and disulfide bonds (yellow) are shown together with the two α-helices (α1-α2), four β-strands (β1: Ile44-Val46, β2: Arg49-Asn54, β3: Lys61-Val66, and β4: Asp88-Tyr91), and three loops (Loop 1- Loop 3). The two disulfide bonds are labeled. C, X-ray crystal structure of A21 rotated and translated from panel B. D, Electrostatic potential surface of A21 shown in the same orientation as in panel C and based on the X-ray structure (residues 41–117). The color varies from more negative surface potential (red) to zero potential (white) to more positive potential (blue). E, Hydrophobicity surface of A21 in the same orientation as in panel C. The color varies from a more hydrophobic surface (yellow) to a more hydrophilic surface (cyan). F, Close-up of Loop 1 (Asn54-Ile60) and the hydrogen bonds (blue dashed lines) that stabilize it. G, Close-up of Loop 2 (Asp67-Cys75) and its hydrogen bonds. H, Close-up of Loop 3 (Cys92-Gly101) and its hydrogen bonds. I, Secondary structure diagram of the A21 ectodomain. The α0-helix is shown as predicted from the residues 24–39, which though expressed, were not seen in the electron density.
Figure 1. A21 structure and analysis. A, Expression construct of the A21 ectodomain. Shown are the His6-tag for affinity purification, the SSGVDLGT linker, the tobacco etch virus (TEV) protease recognition sequence ENLYFQS, and residues 24–117 of A21 from vaccinia virus Western Reserve strain (VACV WR). B, X-ray crystal structure of A21. Ribbon trace (purple) and disulfide bonds (yellow) are shown together with the two α-helices (α1-α2), four β-strands (β1: Ile44-Val46, β2: Arg49-Asn54, β3: Lys61-Val66, and β4: Asp88-Tyr91), and three loops (Loop 1- Loop 3). The two disulfide bonds are labeled. C, X-ray crystal structure of A21 rotated and translated from panel B. D, Electrostatic potential surface of A21 shown in the same orientation as in panel C and based on the X-ray structure (residues 41–117). The color varies from more negative surface potential (red) to zero potential (white) to more positive potential (blue). E, Hydrophobicity surface of A21 in the same orientation as in panel C. The color varies from a more hydrophobic surface (yellow) to a more hydrophilic surface (cyan). F, Close-up of Loop 1 (Asn54-Ile60) and the hydrogen bonds (blue dashed lines) that stabilize it. G, Close-up of Loop 2 (Asp67-Cys75) and its hydrogen bonds. H, Close-up of Loop 3 (Cys92-Gly101) and its hydrogen bonds. I, Secondary structure diagram of the A21 ectodomain. The α0-helix is shown as predicted from the residues 24–39, which though expressed, were not seen in the electron density.CC0 · PubMed Central
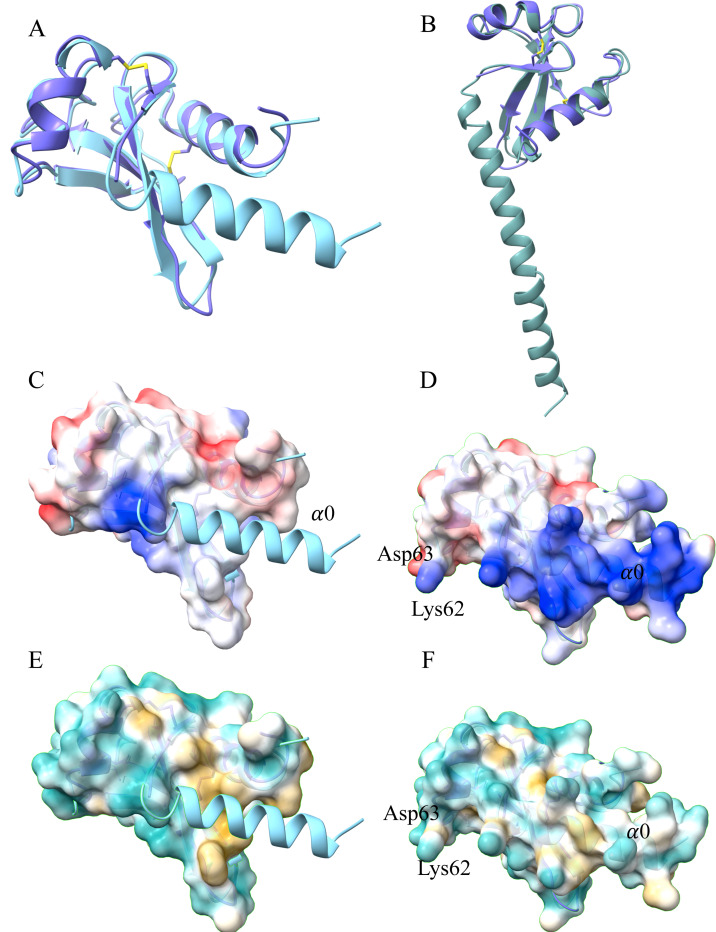
Figure 2. Comparison of the X-ray crystal structure with the AlphaFold 2.0 model of A21. A, Comparison of the A21 X-ray structure (41–117, purple) with the AlphaFold2.0 model (24–117, cyan), revealing a root mean squared deviation (RMSD) of 1.3 Å using 75 Cα pairs. Note the N-terminal α0-helix in the foreground (cyan) is modeled by AlphaFold2.0 but was disordered in the X-ray structure. B, Comparison of the A21 X-ray structure (41–117, purple) with the full-length A21 AlphaFold2.0 generated model (1–117, teal) that includes the predicted A21 transmembrane domain. Note that the predicted transmembrane helix extends from the α0-helix, together making a longer predicted helix. C-D, Comparison of electrostatic potential between surfaces of the X-ray structure (panel C) and of the AlphaFold2.0 model (panel D). In panel D, note the positively charged (blue) region arising from the modeled N-terminal α0-helix (α0), that is shown in panel C as a ribbon (cyan). E-F, Analogous to panels C and D, comparison of hydrophobicity between surfaces of the X-ray structure (panel E) and of the AlphaFold2.0 model (panel F). In panel E, note the hydrophobic surface (yellow) located under the modeled α0-helix (cyan ribbon).
Figure 2. Comparison of the X-ray crystal structure with the AlphaFold 2.0 model of A21. A, Comparison of the A21 X-ray structure (41–117, purple) with the AlphaFold2.0 model (24–117, cyan), revealing a root mean squared deviation (RMSD) of 1.3 Å using 75 Cα pairs. Note the N-terminal α0-helix in the foreground (cyan) is modeled by AlphaFold2.0 but was disordered in the X-ray structure. B, Comparison of the A21 X-ray structure (41–117, purple) with the full-length A21 AlphaFold2.0 generated model (1–117, teal) that includes the predicted A21 transmembrane domain. Note that the predicted transmembrane helix extends from the α0-helix, together making a longer predicted helix. C-D, Comparison of electrostatic potential between surfaces of the X-ray structure (panel C) and of the AlphaFold2.0 model (panel D). In panel D, note the positively charged (blue) region arising from the modeled N-terminal α0-helix (α0), that is shown in panel C as a ribbon (cyan). E-F, Analogous to panels C and D, comparison of hydrophobicity between surfaces of the X-ray structure (panel E) and of the AlphaFold2.0 model (panel F). In panel E, note the hydrophobic surface (yellow) located under the modeled α0-helix (cyan ribbon).CC0 · PubMed Central
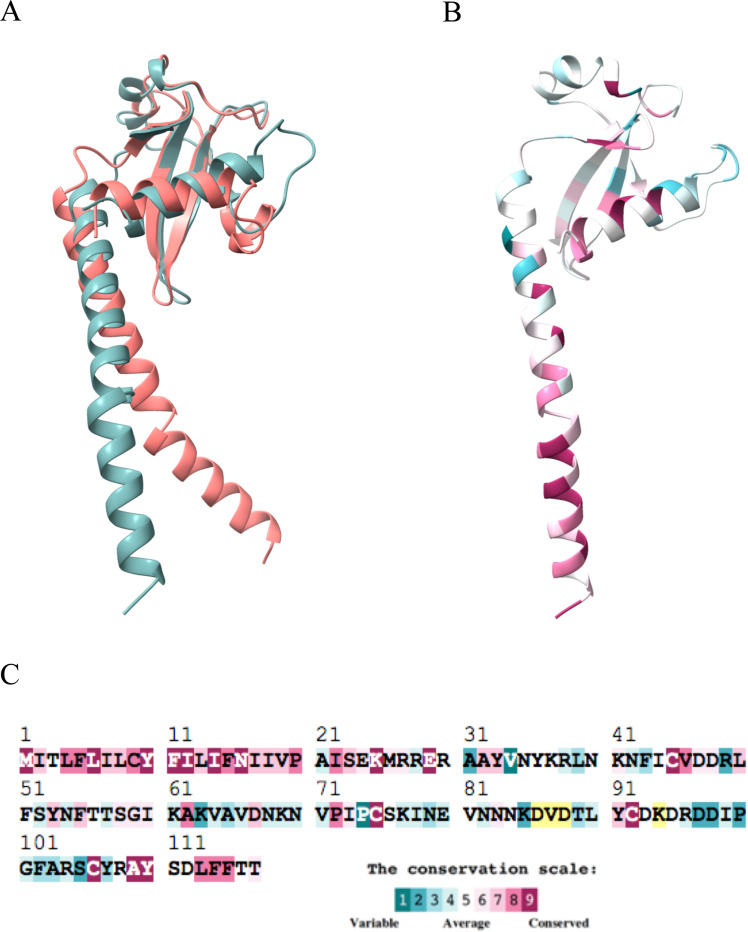
Figure 3. A21 sequence conservation analysis. A, Comparison of the AlphaFold2.0 generated models of VACV A21 (1–117, teal) with the A21 ortholog from salmon gill poxvirus (SGP) (salmon in color). The RMSD between 34 Cα pairs is 0.8 Å. B, VACV A21 model painted according to the degree of the protein sequence conservation among nineteen poxviruses and represented by the color scale in panel C. C, VACV A21 sequence color-coded to show conservation. Note the high number of conserved residues at the N-terminal and C-terminal portions of A21. Color coding is as shown in inset. Some residues had insufficient data (yellow) due to insertions and deletions.
Figure 3. A21 sequence conservation analysis. A, Comparison of the AlphaFold2.0 generated models of VACV A21 (1–117, teal) with the A21 ortholog from salmon gill poxvirus (SGP) (salmon in color). The RMSD between 34 Cα pairs is 0.8 Å. B, VACV A21 model painted according to the degree of the protein sequence conservation among nineteen poxviruses and represented by the color scale in panel C. C, VACV A21 sequence color-coded to show conservation. Note the high number of conserved residues at the N-terminal and C-terminal portions of A21. Color coding is as shown in inset. Some residues had insufficient data (yellow) due to insertions and deletions.CC0 · PubMed Central
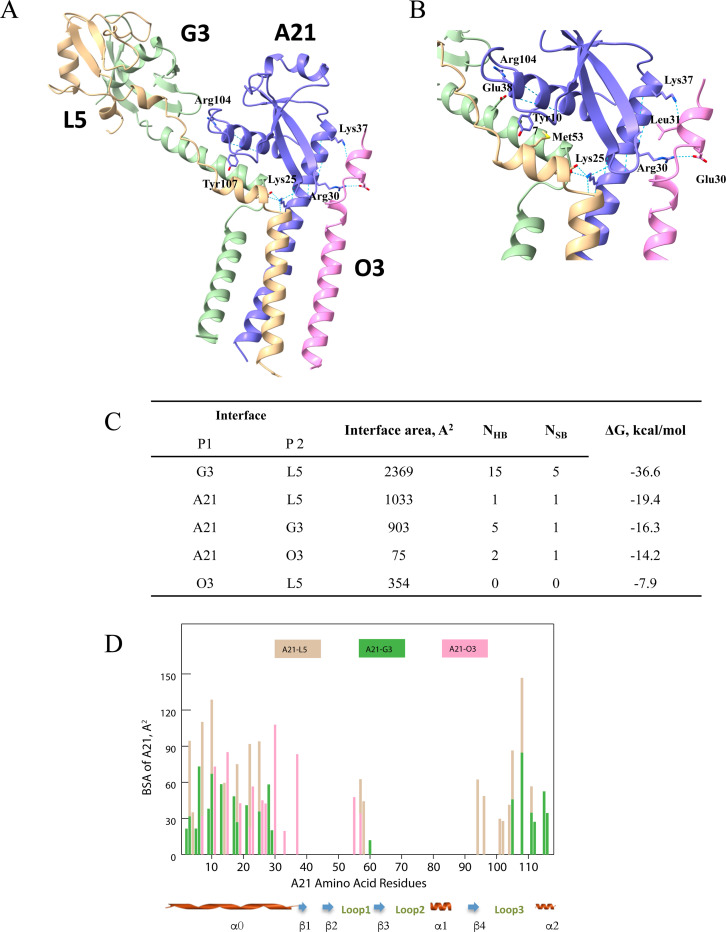
Figure 4. Modeling of A21/O3/G3/L5 subcomplex. A, Overview of the subcomplex with A21 in purple, O3 in pink, G3 in green, and L5 in beige. Key A21 residues providing for subcomplex formation are labeled. B, Close up of a portion of the subcomplex including the modeled A21 α0-helix making contacts with O3. Sidechains for subcomplex residues that participate in charge-charge and hydrogen bonding interactions between subunits are shown. C, Analysis of the subcomplex interfaces with the PISA server [46, 50] (see “Methods”). NHB, number of hydrogen bonds and NSB, number of salt bridges. D, Buried surface area (BSA) per A21 residue in the A21/G3/L5/O3 subcomplex. For example, at A21 residue position 30 on the x-axis, a pink bar extends to a BSA on the y-axis of about 110 Å2, signifying the interaction between residue 30 and the O3 subunit (pink). The BSA of some A21 residues result from interactions with two subunits. An example of this is at position 10 on the x-axis, where G3 (green) contributes about 70 Å2 and L5 (beige) contributes about 130 Å2 to the BSA of residue 10. Note that the majority of interactions and BSA occur at the N-terminal and C-terminal portions of the A21 molecule.
Figure 4. Modeling of A21/O3/G3/L5 subcomplex. A, Overview of the subcomplex with A21 in purple, O3 in pink, G3 in green, and L5 in beige. Key A21 residues providing for subcomplex formation are labeled. B, Close up of a portion of the subcomplex including the modeled A21 α0-helix making contacts with O3. Sidechains for subcomplex residues that participate in charge-charge and hydrogen bonding interactions between subunits are shown. C, Analysis of the subcomplex interfaces with the PISA server [46, 50] (see “Methods”). NHB, number of hydrogen bonds and NSB, number of salt bridges. D, Buried surface area (BSA) per A21 residue in the A21/G3/L5/O3 subcomplex. For example, at A21 residue position 30 on the x-axis, a pink bar extends to a BSA on the y-axis of about 110 Å2, signifying the interaction between residue 30 and the O3 subunit (pink). The BSA of some A21 residues result from interactions with two subunits. An example of this is at position 10 on the x-axis, where G3 (green) contributes about 70 Å2 and L5 (beige) contributes about 130 Å2 to the BSA of residue 10. Note that the majority of interactions and BSA occur at the N-terminal and C-terminal portions of the A21 molecule.CC0 · PubMed Central

Verification

Claims the paper makes

The claims and statistics of this paper haven’t been checked yet.

Run the check — free, no account needed. It reads the open-access text and checks the sources it cites.

A few free checks a day · papers already verified open instantly · results are public

Self-check

Percentages, sums and reported differences re-computed from the paper’s own numbers.

The self-check needs the paper’s full text.

Citations

Cites

Show all 49 references

Metadata

Authors
Diesterbeck, U. S., Muslinkina, L. A., Gittis, A. G., Singh, K., Moss, B., & Garboczi, D. N.
Affiliations
National Institutes of Health (US)
Corresponding author
  • Moss, Bernard
  • Garboczi, David N.
Venue
Journal of Molecular Biology
Publisher
Elsevier BV
Published
2025-06
Volume
437
Issue
12
Pages
169097
ISSN
0022-2836 (ISSN-L)
OpenAlex
W4408596215
Cited by
9
References
49
Citations by year
2026: 5 · 2025: 4
FWCI
4.52
Type
journal article
Language
en
Open access
Licence
  • public-domain
  • www.elsevier.com/tdm/userlicense/1.0/ (tdm)
  • www.elsevier.com/legal/tdmrep-license (tdm)
Locations
  • Journal of Molecular Biology (publishedVersion)
  • bioRxiv (Cold Spring Harbor Laboratory) (acceptedVersion, public-domain)
  • PubMed (publishedVersion)
  • PubMed Central (publishedVersion)
  • PubMed Central (submittedVersion, public-domain)
Funders
  • Division of Intramural Research
  • National Institute of Allergy and Infectious Diseases
Topics
  • Life Sciences › Immunology and Microbiology › Virology › Poxvirus research and outbreaks
  • Life Sciences › Biochemistry, Genetics and Molecular Biology › Structural Biology › Enzyme Structure and Function
  • Life Sciences › Biochemistry, Genetics and Molecular Biology › Molecular Biology › Protein Structure and Dynamics
Keywords
protein crystal structure, transmembrane domain, protein evolution, phylogenetic analysis
MeSH terms
Amino Acid Sequence, Models, Molecular, Phylogeny, Poxviridae, Protein Conformation, Viral Proteins, Crystallography, X-Ray, Virus Internalization

About these checks

Registry, retraction, Cites and statistics results are computed, not judged, with one exception: a printed reference that no index lists is read once by a model before it counts as a citation error. Claims are extracted by a model and kept only when their quote appears verbatim in the text; each cited source is then checked, with a model’s help, for whether it says what the claim relies on. Those verdicts can be wrong — read the claim’s quote and the cited source before relying on one.

Statistics and arithmetic are recomputed, not judged.

Confidence bands are shown only for fields calibrated on our annotated test set. None is calibrated yet, so no band is shown.

What counts as a claim ›How we measure confidence ›How we check this ›

Are you an author, or do you see a problem with this page? Request a review

How to cite

Cite CoChat for the checks on this page, and the paper for its own findings.

This page
CoChat. (2026). Citation check: The 2.3 Å Structure of A21, a Protein Component of the Conserved Poxvirus Entry-Fusion Complex. https://app.cochat.ai/papers/10.1016/j.jmb.2025.169097
The paper
Diesterbeck, U. S., Muslinkina, L. A., Gittis, A. G., Singh, K., Moss, B., & Garboczi, D. N. (2025). The 2.3 Å Structure of A21, a Protein Component of the Conserved Poxvirus Entry-Fusion Complex. Journal of Molecular Biology. https://doi.org/10.1016/j.jmb.2025.169097

Data sources

Bibliographic data: Semantic Scholar, OpenAlex, Crossref.

Contains information from the Semantic Scholar Academic Graph Datasets, made available under the ODC Attribution License (ODC-BY 1.0).

Semantic Scholar’s data is described in: Kinney, R., et al. (2023). The Semantic Scholar Open Data Platform. arXiv:2301.10140.