

The DOI matches its Crossref record; 59 of the 59 references it cites were found in a registry or an index.
Estimating the transfer function from neuronal activity to BOLD using simultaneous EEG-fMRI
Open accessAbstract
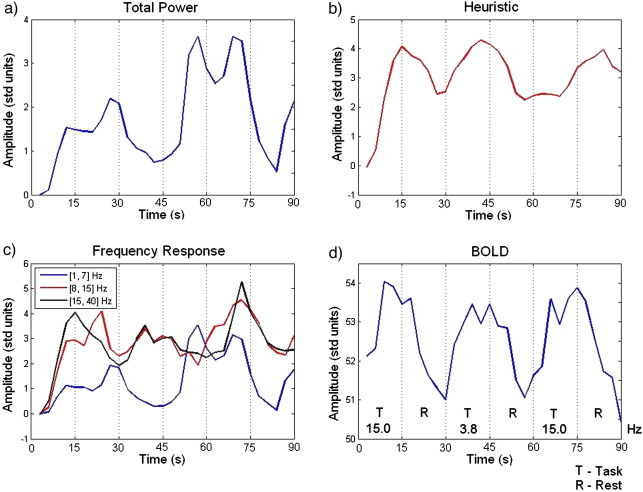
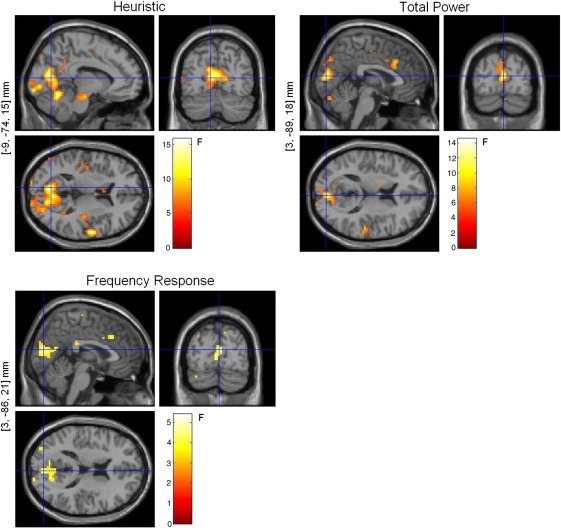
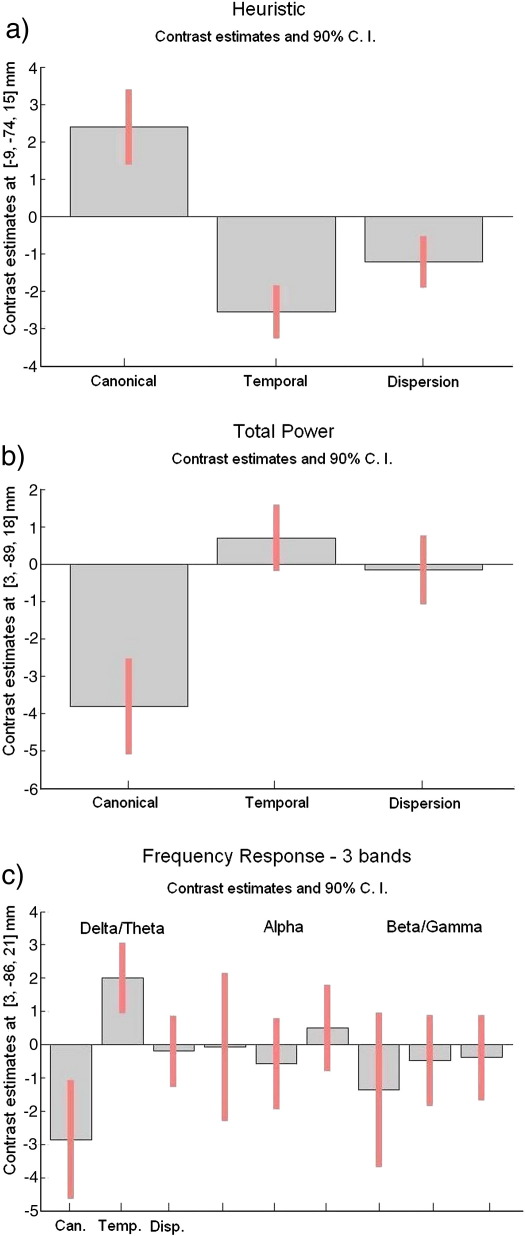
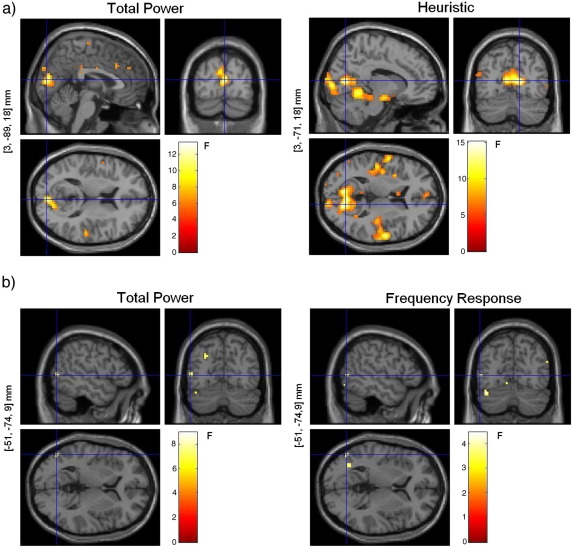
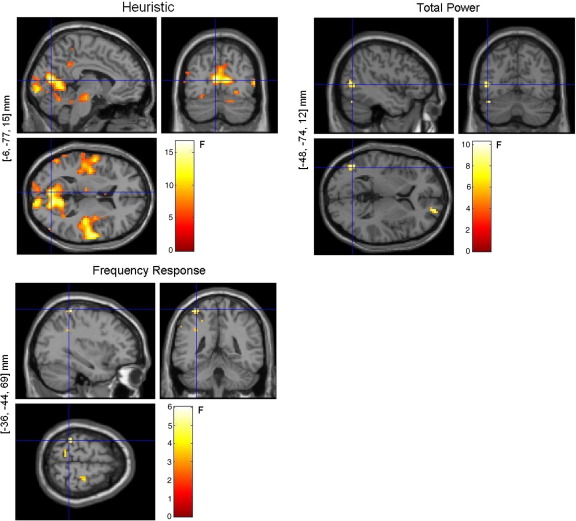
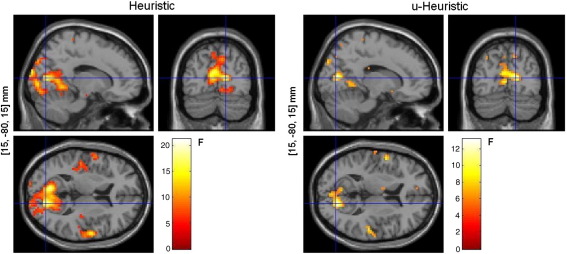
Previous studies using combined electrical and hemodynamic measurements of brain activity, such as EEG and (BOLD) fMRI, have yielded discrepant results regarding the relationship between neuronal activity and the associated BOLD response. In particular, some studies suggest that this link, or transfer function, depends on the frequency content of neuronal activity, while others suggest that total neuronal power accounts for the changes in BOLD. Here we explored this dependency by comparing different frequency-dependent and -independent transfer functions, using simultaneous EEG-fMRI. Our results suggest that changes in BOLD are indeed associated with changes in the spectral profile of neuronal activity and that these changes do not arise from one specific spectral band. Instead they result from the dynamics of the various frequency components together, in particular, from the relative power between high and low frequencies. Understanding the nature of the link between neuronal activity and BOLD plays a crucial role in improving the interpretability of BOLD images as well as on the design of more robust and realistic models for the integration of EEG and fMRI.
Overview
The claims and statistics of this paper haven’t been checked yet.
Run the check — free, no account needed. It reads the open-access text and checks the sources it cites.
Integrity signals
Registry
Cites
Statistics
Figures
Verification
Claims the paper makes
The claims and statistics of this paper haven’t been checked yet.
Run the check — free, no account needed. It reads the open-access text and checks the sources it cites.
Claims other papers make about this one
Each is checked against this paper’s own text: does it say what the citing paper says it does?
In the citing paper
“This is because it is generally assumed that fMRI signals scale with the predominant frequency of neuronal activity (Kilner et al., 2005; Laufs & Duncan 2007; Rosa et al., 2010).”
From Network discovery with DCM (2011) · cites this paper as Rosa et al., 2010
Self-check
Percentages, sums and reported differences re-computed from the paper’s own numbers.
The self-check needs the paper’s full text.
Citations
Cites
Co-Planar Stereotaxic Atlas of the Human Brain
Talairach, J., & Tournoux, P. (1988) · Medical Entomology and Zoology · Cited by 11,798
Statistical parametric maps in functional imaging: A general linear approach
Friston, K. J., Holmes, A. P., Worsley, K. J., Poline, J. ‐., Frith, C. D., & Frackowiak, R. S. J. (1994) · Human Brain Mapping · doi:10.1002/hbm.460020402 · Cited by 9,688
Co-planar stereotaxic atlas of the human brain
Laitinen, L. (1989) · Clinical Neurology and Neurosurgery · doi:10.1016/0303-8467(89)90128-5 · Cited by 7,565
Neurophysiological investigation of the basis of the fMRI signal
Logothetis, N. K., Pauls, J., Augath, M., Trinath, T., & Oeltermann, A. (2001) · Nature · doi:10.1038/35084005 · Cited by 6,551
Hämäläinen, M., Hari, R., Ilmoniemi, R. J., Knuutila, J., & Lounasmaa, O. V. (1993) · Reviews of Modern Physics · doi:10.1103/revmodphys.65.413 · Cited by 4,684
A new SPM toolbox for combining probabilistic cytoarchitectonic maps and functional imaging data
Eickhoff, S. B., Stephan, K. E., Mohlberg, H., Grefkes, C., Fink, G. R., Amunts, K., & Zilles, K. (2005) · NeuroImage · doi:10.1016/j.neuroimage.2004.12.034 · Cited by 4,033
What we can do and what we cannot do with fMRI
Logothetis, N. K. (2008) · Nature · doi:10.1038/nature06976 · Cited by 3,612
Statistical Parametric Mapping: The Analysis of Functional Brain Images
Penny, W. D., Friston, K. J., Ashburner, J., Kiebel, S. J., & Thomas, N. (2007) · UCL Discovery (University College London) · Cited by 3,339
Oscillatory gamma activity in humans and its role in object representation
Tallon‐Baudry, C. (1999) · Trends in Cognitive Sciences · doi:10.1016/s1364-6613(99)01299-1 · Cited by 2,205
Frackowiak, R. S. J. (1997) · Cited by 1,713
Cited by
Sorted by citations
Scheeringa, R., Fries, P., Petersson, K. M., Oostenveld, R., Grothe, I., Norris, D. G., Peter Hagoort, A., & BASTIAANSEN, M. C. M. (2011) · Neuron · doi:10.1016/j.neuron.2010.11.044 · Cited by 479
Magri, C., Schridde, U., Murayama, Y., Panzeri, S., & Logothetis, N. K. (2012) · Journal of Neuroscience · doi:10.1523/jneurosci.3985-11.2012 · Cited by 356
Friston, K. J., Li, B., Daunizeau, J., & Stephan, K. E. (2011) · NeuroImage · doi:10.1016/j.neuroimage.2010.12.039 · Cited by 283
Transfer Function between EEG and BOLD Signals of Epileptic Activity
Leite, M., Leal, A., & Figueiredo, P. (2013) · Frontiers in Neurology · doi:10.3389/fneur.2013.00001 · Cited by 234
Neurovascular coupling in normal aging: A combined optical, ERP and fMRI study
Fabiani, M., Gordon, B. A., Maclin, E. L., Pearson, M. A., Brumback, C. R., Low, K. A., McAuley, E., Sutton, B. P., Kramer, A. F., & Gratton, G. (2013) · NeuroImage · doi:10.1016/j.neuroimage.2013.04.113 · Cited by 230
Metadata
- Authors
- Rosa, M. J., Kilner, J., Blankenburg, F., Josephs, O., & Penny, W.
- Affiliations
- Wellcome Centre for Human Neuroimaging (GB)
- Bernstein Center for Computational Neuroscience Berlin (DE)
- Corresponding author
- Rosa, M.J.
- Venue
- NeuroImage
- Publisher
- Elsevier BV
- Published
- 2010-01
- Volume
- 49
- Issue
- 2
- Pages
- 1496-1509
- ISSN
- 1053-8119 (ISSN-L)
- PMC
- PMC2793371
- OpenAlex
- W2011544331
- Cited by
- 105
- References
- 59
- Citations by year
- 2026: 2 · 2025: 4 · 2024: 5 · 2023: 3 · 2022: 5 · 2021: 4 · 2020: 4 · 2019: 7 · 2018: 6 · 2017: 4 · 2016: 9 · 2015: 6 · 2014: 8 · 2013: 10 · 2012: 9
- FWCI
- 7.02
- Type
- journal article
- Language
- en
- Open access
- hybrid
- doi.org
- Licence
- Locations
- NeuroImage (publishedVersion, cc-by)
- PubMed Central (publishedVersion, cc-by)
- PubMed (publishedVersion)
- UCL Discovery (University College London) (submittedVersion)
- Research Portal (King's College London) (submittedVersion, other-oa)
- Funders
- Wellcome Trust and the Portuguese Foundation for Science and Technology (FCT)
- Topics
- Health Sciences › Medicine › Radiology, Nuclear Medicine and Imaging › Advanced MRI Techniques and Applications
- Health Sciences › Medicine › Radiology, Nuclear Medicine and Imaging › Optical Imaging and Spectroscopy Techniques
- Health Sciences › Medicine › Radiology, Nuclear Medicine and Imaging › Advanced Neuroimaging Techniques and Applications
- Keywords
- BOLD signal, neuronal activity, transfer function, EEG-fMRI integration, spectral power, hemodynamic response, simultaneous EEG-fMRI
- MeSH terms
- Adult, Algorithms, Brain, Electroencephalography, Humans, Magnetic Resonance Imaging, Male, Models, Theoretical, Neurons, Oxygen, Photic Stimulation, Signal Processing, Computer-Assisted, Time Factors, Visual Perception, Cluster Analysis, Artifacts, Nonlinear Dynamics, Principal Component Analysis
About these checks
Registry, retraction, Cites and statistics results are computed, not judged, with one exception: a printed reference that no index lists is read once by a model before it counts as a citation error. Claims are extracted by a model and kept only when their quote appears verbatim in the text; each cited source is then checked, with a model’s help, for whether it says what the claim relies on. Those verdicts can be wrong — read the claim’s quote and the cited source before relying on one.
Statistics and arithmetic are recomputed, not judged.
Confidence bands are shown only for fields calibrated on our annotated test set. None is calibrated yet, so no band is shown.
What counts as a claim ›How we measure confidence ›How we check this ›
Are you an author, or do you see a problem with this page? Request a review
