

The DOI matches its Crossref record; 81 of the 91 references it cites were found in a registry or an index.
Investigating white matter fibre density and morphology using fixel-based analysis.
Open accessAbstract
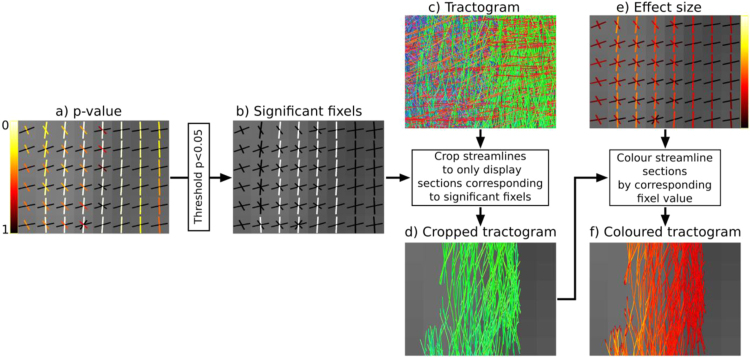
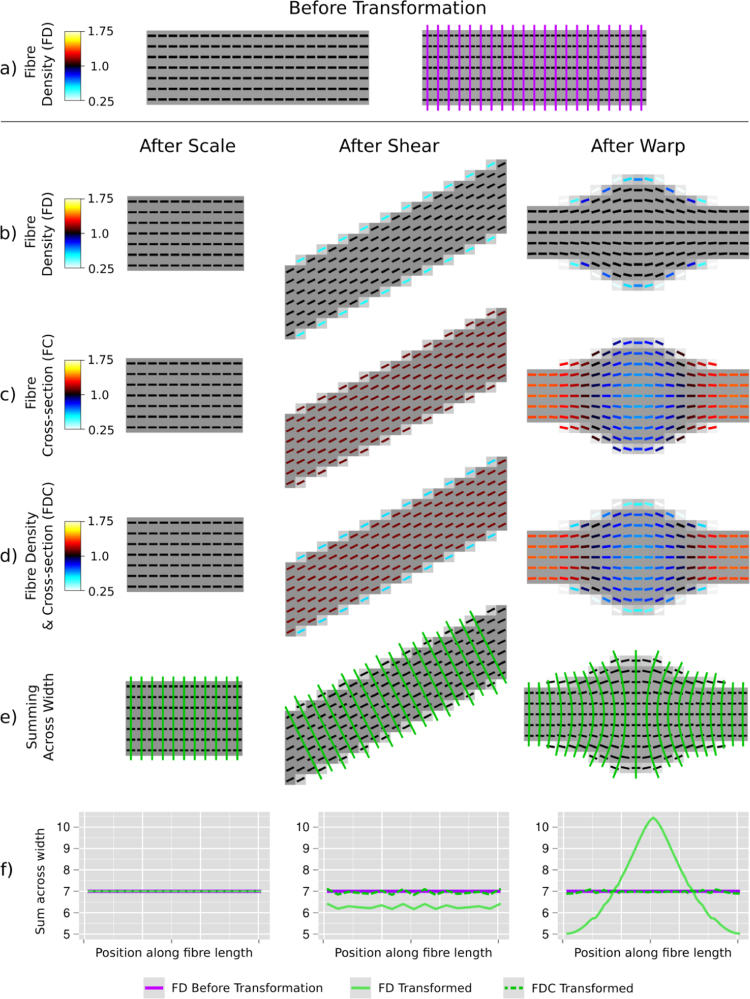
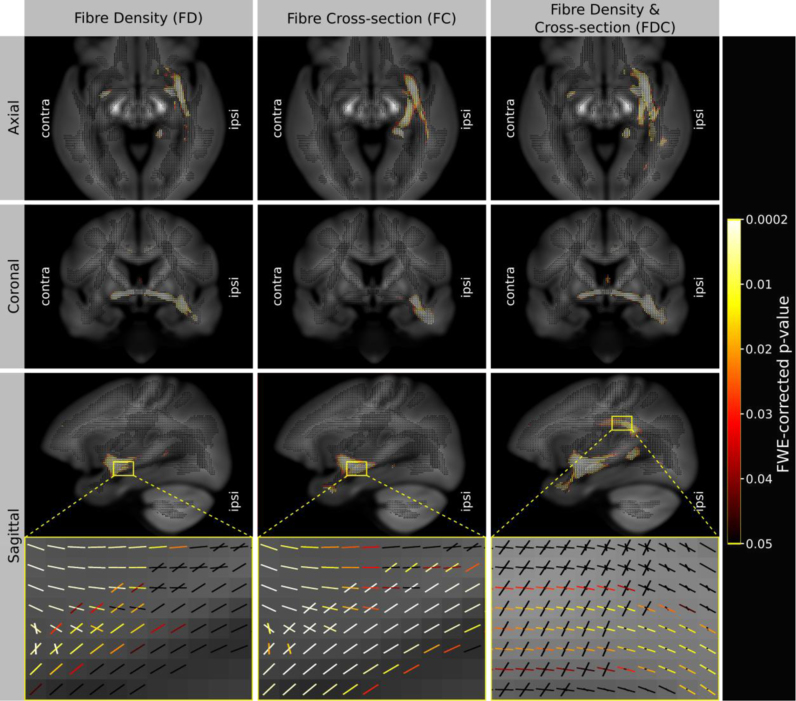
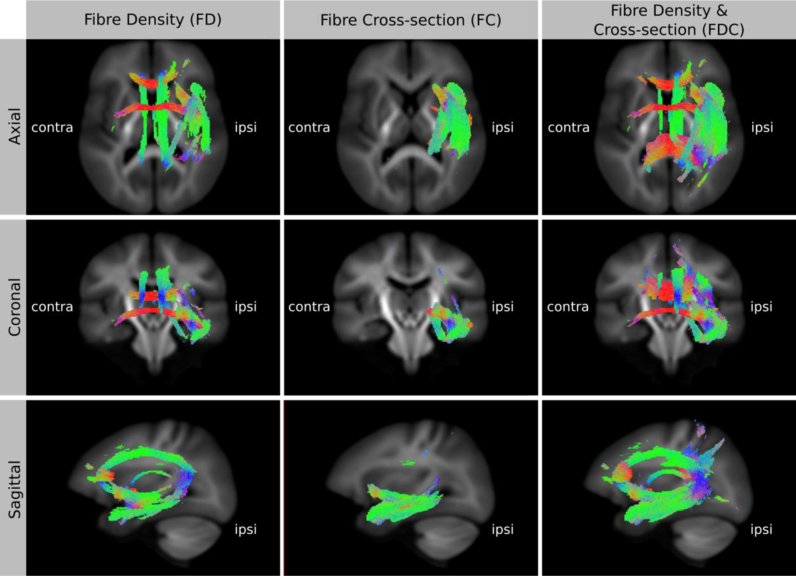
Voxel-based analysis of diffusion MRI data is increasingly popular. However, most white matter voxels contain contributions from multiple fibre populations (often referred to as crossing fibres), and therefore voxel-averaged quantitative measures (e.g. fractional anisotropy) are not fibre-specific and have poor interpretability. Using higher-order diffusion models, parameters related to fibre density can be extracted for individual fibre populations within each voxel ('fixels'), and recent advances in statistics enable the multi-subject analysis of such data. However, investigating within-voxel microscopic fibre density alone does not account for macroscopic differences in the white matter morphology (e.g. the calibre of a fibre bundle). In this work, we introduce a novel method to investigate the latter, which we call fixel-based morphometry (FBM). To obtain a more complete measure related to the total number of white matter axons, information from both within-voxel microscopic fibre density and macroscopic morphology must be combined. We therefore present the FBM method as an integral piece within a comprehensive fixel-based analysis framework to investigate measures of fibre density, fibre-bundle morphology (cross-section), and a combined measure of fibre density and cross-section. We performed simulations to demonstrate the proposed measures using various transformations of a numerical fibre bundle phantom. Finally, we provide an example of such an analysis by comparing a clinical patient group to a healthy control group, which demonstrates that all three measures provide distinct and complementary information. By capturing information from both sources, the combined fibre density and cross-section measure is likely to be more sensitive to certain pathologies and more directly interpretable.
Overview
The claims and statistics of this paper haven’t been checked yet.
Run the check — free, no account needed. It reads the open-access text and checks the sources it cites.
Integrity signals
Registry
Cites
Statistics
Figures
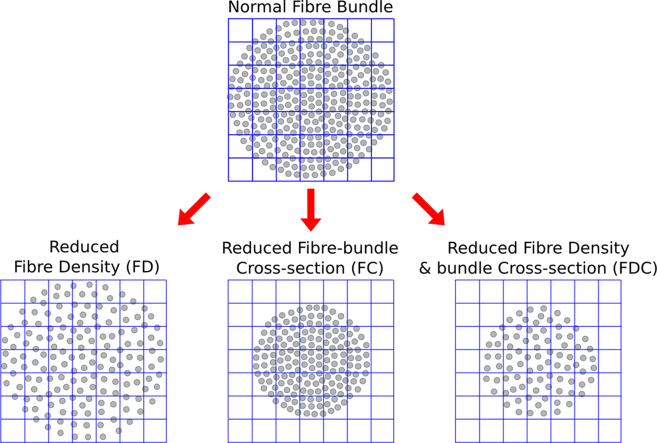
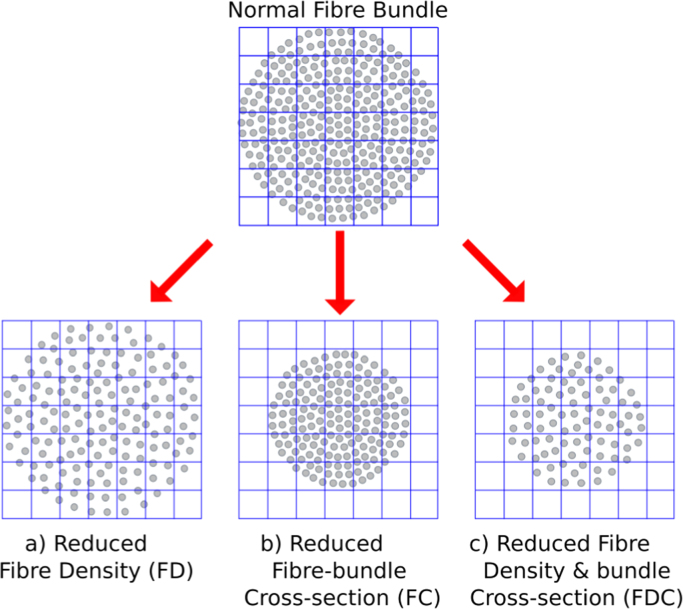
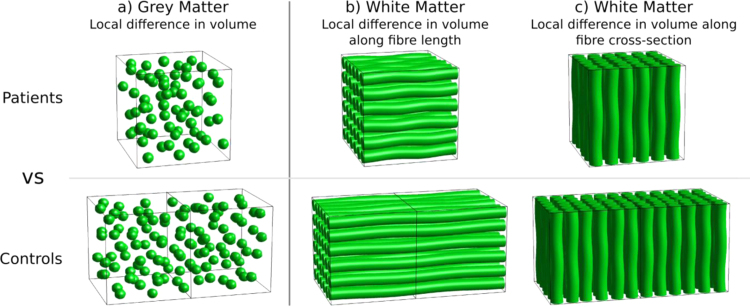
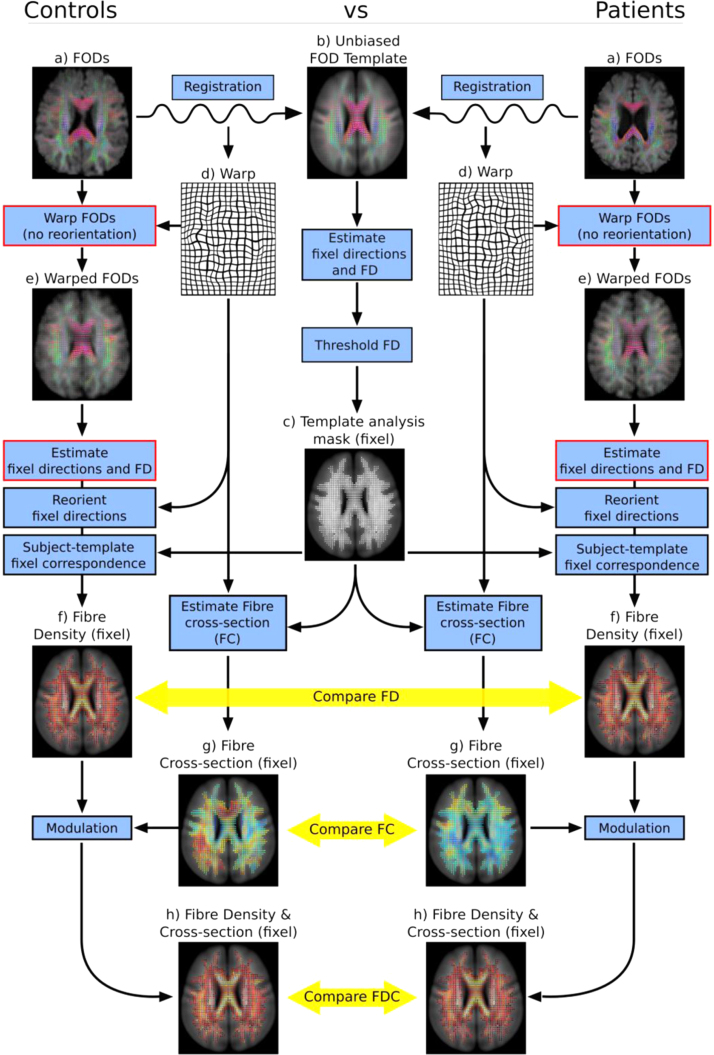
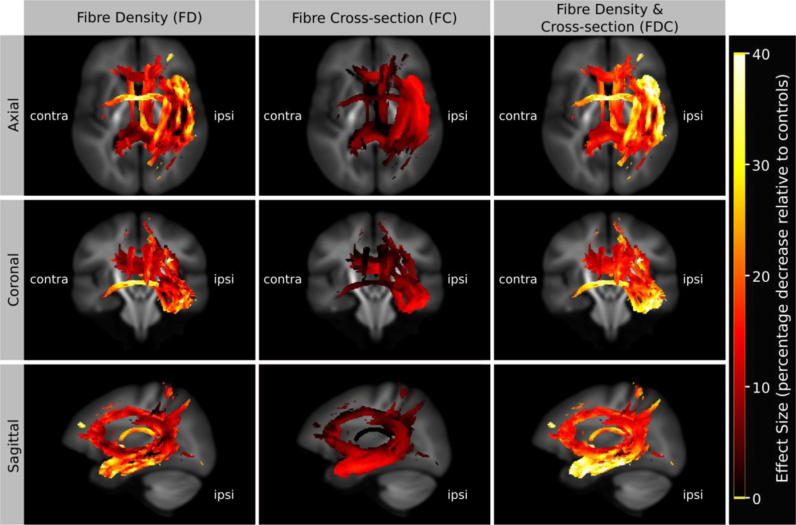
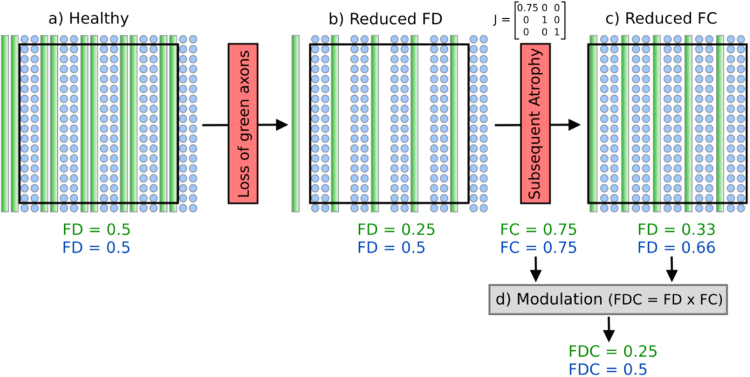
Verification
Claims the paper makes
The claims and statistics of this paper haven’t been checked yet.
Run the check — free, no account needed. It reads the open-access text and checks the sources it cites.
Claims other papers make about this one
Each is checked against this paper’s own text: does it say what the citing paper says it does?
The cited source says what the claim attributes to it.
In the citing paper
“recent fixel-based analysis approaches have been proposed to characterize a specific fiber population within a voxel (i.e., a “fixel”) (Raffelt et al., 2017).”
From Potential Pitfalls of Using Fractional Anisotropy, Axial Diffusivity, and Radial Diffusivity as Biomarkers of Cerebral White Matter Microstructure (2022) · cites this paper as Raffelt et al., 2017
Self-check
Percentages, sums and reported differences re-computed from the paper’s own numbers.
The self-check needs the paper’s full text.
Citations
Cites
Cortical Surface-Based Analysis
Dale, A. M., Fischl, B., & Sereno, M. I. (1999) · NeuroImage · doi:10.1006/nimg.1998.0395 · Cited by 10,910 · cited 1×
“For the FC and FDC analysis, we included intracranial volume (as computed using FreeSurfer from T1-weighted images (Dale et al., 1999)) as a nuisance covariate.”
MethodVoxel-Based Morphometry—The Methods
Ashburner, J., & Friston, K. J. (2000) · NeuroImage · doi:10.1006/nimg.2000.0582 · Cited by 8,676
Tract-based spatial statistics: Voxelwise analysis of multi-subject diffusion data
Smith, S. M., Jenkinson, M., Johansen‐Berg, H., Rueckert, D., Nichols, T. E., Mackay, C. E., Watkins, K. E., Ciccarelli, O., Cader, M. Z., Matthews, P. M., et al. (2006) · NeuroImage · doi:10.1016/j.neuroimage.2006.02.024 · Cited by 6,598 · cited 2×
“Furthermore, as in TBSS (Smith et al., 2006), this approach is likely to suffer from inaccurate FA-based projection in regions of crossing fibres (Bach et al., 2014; De Groot et al., 2013; Schwarz et al., 2014), and lack of fibre-specific inference when investigating voxel-wise measures such as FA.”
MethodBasser, P. J., & Pierpaoli, C. (1996) · Journal of Magnetic Resonance, Series B · doi:10.1006/jmrb.1996.0086 · Cited by 4,306 · cited 2×
“By far the most popular approach to VBA of diffusion MRI is the analysis of diffusion tensor-derived fractional anisotropy (FA) (Basser and Pierpaoli, 1996), with voxel- or clusterlevel statistical inference using packages such as SPM (http://www. fil.ion.ucl.ac.uk/spm/) or FSL…”
MethodPermutation inference for the general linear model
Winkler, A. M., Ridgway, G. R., Webster, M. A., Smith, S. M., & Nichols, T. E. (2014) · NeuroImage · doi:10.1016/j.neuroimage.2014.01.060 · Cited by 3,563 · cited 1×
“Family-wise error corrected p-values were assigned to each fixel using non-parametric permutation testing (Holmes et al., 1996; Winkler et al., 2014) with 5000 permutations.”
MethodSelf-citationProbabilistic diffusion tractography with multiple fibre orientations: What can we gain?
Behrens, T. E. J., Berg, H. J., Jbabdi, S., Rushworth, M. F. S., & Woolrich, M. W. (2007) · NeuroImage · doi:10.1016/j.neuroimage.2006.09.018 · Cited by 3,471
NODDI: Practical in vivo neurite orientation dispersion and density imaging of the human brain
Zhang, H., Schneider, T., Wheeler-Kingshott, C. A., & Alexander, D. C. (2012) · NeuroImage · doi:10.1016/j.neuroimage.2012.03.072 · Cited by 3,288 · cited 6×
“In the context of voxel-averaged DWI measures (e.g. Alexander et al., 2010; Zhang et al., 2012), the ‘density’ of a voxel will also be influenced by partial volume with cerebral spinal fluid.”
BackgroundMethodInfluentialTraining induces changes in white-matter architecture
Scholz, J., Klein, M. C., Behrens, T. E. J., & Johansen-Berg, H. (2009) · Nature Neuroscience · doi:10.1038/nn.2412 · Cited by 1,508 · cited 1×
“, 2012), individual differences and brain-behaviour correlations (Johansen-Berg, 2010), genetics (Meyer-Lindenberg, 2009), structural plasticity (Scholz et al., 2009), treatment response (Szeszko et al.”
BackgroundJeurissen, B., Tournier, J.-D., Dhollander, T., Connelly, A., & Sijbers, J. (2014) · NeuroImage · doi:10.1016/j.neuroimage.2014.07.061 · Cited by 1,484 · cited 1×
“(Jeurissen et al., 2014)) instead of tissue segmentations from T1-weighted images.”
BackgroundSelf-citationDiffusion tensor imaging of white matter tract evolution over the lifespan
Lebel, C., Gee, M., Camicioli, R., Wieler, M., Martin, W., & Beaulieu, C. (2012) · NeuroImage · doi:10.1016/j.neuroimage.2011.11.094 · Cited by 1,100 · cited 1×
“However, most white matter voxels contain contributions from multiple fibre populations (often referred to as crossing fibres), and therefore voxel-averaged quantitative measures (e.g. fractional anisotropy) are not fibre-specific and have poor interpretability.”
Background
Research works printed but not linked: 3
- Jackson, 1993, Optimizing the diagnosis of hippocampal sclerosis using MR imaging, Am. J. Neuroradiol., 14, 753
- Raffelt, D., Crozier, S., Connelly, A., Salvado, O., Tournier, J.-D., 2010. Apparent fibre density: a new measure for high angular resolution diffusion-weighted image analysis. In: Proceedings of the International Society for Magnetic Resonance in Medicine. Presented at the International Society for Magnetic Resonance in Medicine, Stockholm. Sweden, p. 575.
- Tournier, J.-D., Calamante, F., Connelly, A., 2013. A robust spherical deconvolution method for the analysis of low SNR or low angular resolution diffusion data. In: Proceedings of the International Society for Magnetic Resonance in Medicine. Salt Lake City, Utah, USA.
Cited by
Sorted by citations
Items 501–600 of 604
Structural Neuroimaging: From Macroscopic to Microscopic Scales
Wu, D., & Mori, S. (2022) · Handbook of Neuroengineering · doi:10.1007/978-981-15-2848-4_84-1
Left Temporal Lobe Epilepsy Patients Without Hippocampal Sclerosis: a DTI and VBM Study
Tsialios, P., Karavasilis, E., Karanasiou, I., Bonakis, A., Velonakis, G., Efstathopoulos, E., Kelekis, N., & Papathanasiou, M. (2020) · Journal of Systems and Integrative Neuroscience · doi:10.15761/jsin.1000237 · Cited by 1
“Additionally, Vaughan, et al. , demonstrated ipsilateral atrophy of the tapetum, UNCF and IFOF as well as bilateral atrophy of CCGP (or dorsal cingulum) and corpus callosum using fiber density and cross-section (FDC) as alternative WM integrity metrics [41,48].”
Chang, C.-C., Cheng, J.-S., Chang, H.-I., Hsu, S.-W., Huang, C.-W., Chen, Y.-L., & Wang, J.-J. (2026) · European Journal of Radiology Open · doi:10.1016/j.ejro.2026.100823
Dasanayake, D., Amit, S. N., & Chandio, B. (2026) · bioRxiv · doi:10.64898/2026.11.02.763786
“In dMRI, TBM has been extended to diffusion tensor-based registration to identify localized WM morphological differences [10], and fixel-based analysis measures morphology through the fiber cross-section [11].”
Pruckner, P., Mito, R., Vaughan, D. N., Schilling, K. G., Morgan, V. L., Englot, D. J., & Smith, R. E. (2026) · Imaging Neuroscience · doi:10.1162/imag.a.1414
“The fibre density metric was computed for session data ( D. A. Raffelt et al., 2017) and projected to subject template fixels using an advanced fixel correspondence algorithm to mitigate artifactual longitudinal differences due to changes in FOD shape ( R. E. Smith & Connelly, 2018).”
InfluentialSelf-citationFan, C.-Y., Sanders, R. D., Matar, E., Yuan, Y.-X., Li, X., Naismith, S., Calamante, F., & Lv, J.-L. (2026) · doi:10.48550/arxiv.2610.34825
“FOD-derived measures are widely used in fixel-based analyses to characterize fiber-specific white matter properties [21].”
Cortico-striatal network architecture shapes rhythmic biases in music
Lumaca, M., van der Werff, J., Keller, P. E., Kotz, S., Baggio, G., Rosso, M., Kakihara, M., Martin, M., Vuust, P., & Ravignani, A. (2026) · Cerebral Cortex · doi:10.1093/cercor/bhag091
“…tract, we quantified (i) the average FD, reflecting the degree of axonal packing in a fiber population; (ii) fiber cross-section (log10 FC), indicating the cross-sectional size of a fiber population; and (iii) a combination of these two metrics (FDC) ( Raffelt et al. 2017b) ( Supplementary Fig.”
Olculu, C. B., Yılmaz, S., Kose, S., Özalay, Ö., Kan, Ö. Y., Tokmak, S. H., Islamli, J., Kanmaz, S., Kitis, O., Ozbaran, B., et al. (2026) · Epilepsy & Behavior · doi:10.1016/j.yebeh.2026.111320
Baird, M., Seal, M. L., Beare, R., Yang, J. Y.-M., & Anderson, J. F. I. (2026) · Brain Structure and Function · doi:10.1007/s00429-026-03193-7
“…therefore offers significant advantages over DTI, which averages diffusion proper - ties across all fibre populations within a voxel, including greater specificity in regions containing complex crossing fibres and increased biological sensitivity to fibre-specific properties (Raffelt et al. 2017).”
Decaux, N., Roy, J.-C., Desmidt, T., Martinot, M. P., Robert, G., & Coloigner, J. (2026) · arXiv (Cornell University) · doi:10.48550/arxiv.2609.31058
“To characterize local fiber populations, fiber bundle elements (fixels) were extracted per voxel following the approach by Raffelt et al. (Raffelt et al., 2017) and the MRtrix3 implementation.”
Li, R., Li, J., Li, C., 王新刚, Zhou, W., Zou, Y., Zhen, Z., Xiao, L., Na, L., Zou, Z., et al. (2026) · Open Research (University of Surrey) · doi:10.1002/viw2.70210
What's a White Matter 'Fiber'?
Dannhoff, G., Andersson, F., Destrieux, C., & Maldonado, I. (2026) · Clinical anatomy (New York, N.Y. Print) · doi:10.1002/ca.70229
Beeckmans, M., Malderen, S. V., Ferreira, S. M., Hehl, M., Emsell, L., Sunaert, S. G., Radwan, A., & Cuypers, K. (2026) · Frontiers in Aging Neuroscience · doi:10.3389/fnagi.2026.1933331
“The total effect of micro-and macrostructural properties is captured by the combined fiber density and cross-section metric (FDC) (Raffelt et al., 2017; Dhollander et al., 2021).”
Spatiotemporal white-matter development across early childhood
Singh, M., Dimond, D., Dewey, D., Lebel, C. A., & Bray, S. (2026) · Cerebral Cortex · doi:10.1093/cercor/bhag132 · Cited by 1
“…the methodological limitations of tensor-based metrics, we implemented fixel-based analysis (FBA), a diffusion framework that is robust to complex fiber architecture, providing more biologically specific metrics of WM microstructure and macrostructure ( Raffelt et al. 2017; Dhollander et al. 2021).”
A systematic review of structural brain differences in school-aged children born preterm
Coward, E., Mckinnon, K., Richardson, H., & Fletcher-Watson, S. (2026) · Developmental Cognitive Neuroscience · doi:10.1016/j.dcn.2026.101818
“…by using a variety of techniques ranging from conventional magnetic resonance imaging (MRI), which measures brain structure (e.g., cortical volume/surface area), to diffusion tensor imaging (DTI), which measures white-matter connectivity (Hinojosa-Rodríguez et al., 2017; Raffelt et al., 2017).”
Li, Y., Hu, Y., Yang, Y., Li, W., Fan, M., Wang, Z., Zhang, W., & Wang, Y. (2026) · Frontiers in Immunology · doi:10.3389/fimmu.2026.1909595
Quantifying visual pathway overlap to identify training-related microstructural change in hemianopiaPreprint
Browne, M., Millington-Truby, R. S., Bridge, H., Sahraie, A., & Ajina, S. (2026) · bioRxiv · doi:10.64898/2026.07.28.740991
“Such methods could be considered in future, larger studies, as well as possible application of fixel based analyses to consider differences in fibre density (Raffelt et al., 2017).”
Decoding everyday levels of musical training from subcortical white-matter architecture
Lumaca, M., Pearce, M. T., Keller, P. E., Vuust, P., Brattico, E., Baggio, G., Hat, K., Heggli, O. A., & Sandberg, K. (2026) · Imaging Neuroscience · doi:10.1162/imag.a.1325
“Our results underscore the importance of white-matter bandwidth in distributed networks, a property that mass-univariate diffusion analyses (e.g., diffusion tensor imaging and fixel-based analyses) ( Ashburner & Friston, 2000; Raffelt et al., 2017) may not adequately characterize.”
Methodological Evolution of Diffusion MRI in Chronic Pain: A Narrative Review
Li, H.-R., Wang, Y.-Q., Li, M.-T., Yang, H.-G., Qiu, Z.-Q., & Xu, X. (2026) · Journal of Pain Research · doi:10.2147/jpr.s624864
Hyde, C., Fuelscher, I., Rosch, K., Seymour, K., Crocetti, D., Silk, T., Singh, M., & Mostofsky, S. (2026) · NeuroImage: Clinical · doi:10.1016/j.nicl.2026.104053
Newman, B., Foreman, R., Donahue, E., Jakowec, M., Petkus, A., Holschneider, D., O'Neill, J., Schiehser, D., Petzinger, G., & Horn, J. V. V. (2026) · Frontiers in Neurology · doi:10.3389/fneur.2026.1863964
Epigenetic and Brain Structure Covariation Patterns in Typical and Atypical Development
Chirokoff, V., Wrigglesworth, J., Fransquet, P., Wong, Y., Craig, J. M., & Silk, T. (2026) · Human Brain Mapping · doi:10.1002/hbm.70587
Yang, M., Li, H., Li, M.-L., Wang, Q., Deng, L.-H., Zhao, L.-S., Yu, H., Li, X.-J., Deng, W., Guo, W.-J., et al. (2026) · Translational Psychiatry · doi:10.1038/s41398-026-04277-y
“Preprocessed DWI images were converted to MRtrix3 format ( “ .mif ” ) using “ mrconvert ” and were processed according to the MRtrix3 fi xel-based analysis steps (www.MRtrix.readthedocs.io) [15].”
Silva, J. D. S., IJzerman, R., Klein, M., Barkhof, F., Moll, A., Snoek, F., & van Duinkerken, E. (2026) · Metabolic brain disease · doi:10.1007/s11011-026-01926-5
“Lastly, single-tissue constrained spherical deconvolution was used for fiber orientation density estimation (Jeurissen et al. 2014 ), and global intensity normalization within subjects was applied (Raffelt et al. 2017 ).”
She, Y., Wei, J.-H., Wang, J., Liu, Y., Chen, S.-C., Zhang, M., Yang, Q., Mo, L.-J., Tan, C.-H., Liu, X., et al. (2026) · Brain Imaging and Behavior · doi:10.1007/s11682-026-01172-4
“Individual FOD data were then transformed to template space (Raffelt et al. 2017, Dhollander et al. 2021 ).”
InfluentialKitagawa, T., Kamagata, K., Uchida, W., Takabayashi, K., Andica, C., Rui, Z., Ozawa, T., Hagiwara, A., Akashi, T., Sano, K., et al. (2026) · Neurobiology of Disease · doi:10.1016/j.nbd.2026.107518
Oladosu, O., Lo, F., Geeraert, B. L., Lebel, C., & Zhang, Y. (2026) · Scientific Reports · doi:10.1038/s41598-026-60107-7
“The template was constructed using b2000 data from another 30 individuals as commonly done to balance quality and computational time, one template each for predicted and source dataset, following the single-shell fixel-based analysis pipeline 32,33 .”
Coutiño, D., Guerrero-Zavala, J., Domínguez-Frausto, C. A., García-Guillén, M., Coronado-Leija, R., Ramírez-Manzanares, A., Hernandez-Gutierrez, E., Descoteaux, M., Ayala, M., Badillo, M., et al. (2026) · PLoS ONE · doi:10.1371/journal.pone.0349951
Newman, B., Horn, J. V. V., Druzgal, T., & Puglia, M. (2026) · Frontiers in Neuroscience · doi:10.3389/fnins.2026.1830684
Koops, E. A., Giudicessi, A., Baena, A. Y., Martinez, L., Félix, N. A. B., Medrano, R., Dutta, J., Gonzalez, I., Álvarez, S., Aguillon, D. F., et al. (2026) · Alzheimer s & Dementia · doi:10.1002/alz.71587
“43 To characterize potential non-linear relationships between LC-EC tract metrics and age/estimated years to disease onset in mutation carriers, we conducted post-hoc piecewise linear regression including 95% confidence intervals (CIs) for the breakpoint estimation.”
Saito, Y., Syeda, W. T., Gurleyen, Y., Rapado‐Castro, M., Biase, M. A. D., Wannan, C., Mito, R., & Pantelis, C. (2026) · Biological Psychiatry Cognitive Neuroscience and Neuroimaging · doi:10.1016/j.bpsc.2026.05.015
Qiu, Y., & Jiao, C. (2026) · Brain Sciences · doi:10.3390/brainsci16060655
“Notably, when using FA and MD as indicators of white matter integrity, these metrics cannot fully isolate the contribution of individual fibers within voxels characterized by complex multi-fiber architectures, such as crossing fibers [62–64].”
Ultra-rare variants in LAMA2 are risk factors for frontotemporal dementia and motor neuron disease
Lok, H. C., Dobson‐Stone, C., Hallupp, M., Matis, S., Landín-Romero, R., Guennewig, B., Mundell, H. D., Don, A. S., Fifita, J. A., McCann, E. P., et al. (2026) · Human Molecular Genetics · doi:10.1093/hmg/ddag034
“Pre-processing [88–96] and fixel-based tractography [97, 98] were performed using standard methodologies.”
Chu, T. D. X., Hui, L. M., Khatri, N., & Chen, J. J. (2026) · Neurobiology of Aging · doi:10.1016/j.neurobiolaging.2026.05.004
Colaes, R., Schroyen, G., Radwan, A., Laic, R. A. G., Sleurs, C., Helsper, S., Himmelreich, U., Hatse, S., Smeets, A., Deprez, S., et al. (2026) · The Breast · doi:10.1016/j.breast.2026.104788
“Microstructural vulnerabilities were also evident: lower FD in the FAT and IFOF, suggesting lower axonal density [93], also showed associations with higher predicted risk.”
Huang, M., Dalton, M. A., Matis, S., Teng, H. A. C., Cheung, S. C., Hwang, Y. T., Ahmed, R. M., Landín-Romero, R., & Piguet, O. (2026) · Alzheimer s & Dementia · doi:10.1002/alz.71482
“29 Assuch,this approachoffersgreatersensitivitythanDTImodelsindetectingsubtle changes in regions with complex fiber configurations.”
Svaldi, C., Vos, K., Reinders, A., Ćurĉić‐Blake, B., Tseng, J., Jonkers, R., & de Aguiar, V. (2026) · Cortex · doi:10.1016/j.cortex.2026.05.012
Oosterwijck, S. V., Wijnen, J., Brandt, M., Billens, A., Meirezonne, H., Dhondt, E., Bernaers, L., Greef, I. D., Jeurissen, B., Willems, T., et al. (2026) · Perceptual and Motor Skills · doi:10.1177/00315125261441406
Gonzales, M., Kang, X., Cort, C., Adamson, M. M., Chao, S. Z., Yoon, B. C., & Initiative, A. D. N. (2026) · PLoS ONE · doi:10.1371/journal.pone.0346661 · Cited by 1
“One of the shortcomings of voxel-based analysis is that while they reflect general changes to the white matter structure, they are limited in their resolution of multiple fiber populations within a single voxel and in characterizing specific types of white matter microstructural changes [9,11,19].”
Plumart, L., Halbertsma, H. N., Bittencourt, M., Renken, R., & Cornelissen, F. W. (2026) · NeuroImage · doi:10.1016/j.neuroimage.2026.121907
Zhang, Y.-Y., Chen, H.-J., Qi, R.-F., Ke, J., Xu, Q., Zhong, Y., Zhang, L., Lu, G.-M., & Chen, F. (2026) · Brain and Behavior · doi:10.1002/brb3.71354
“This approach provides more accurate and physiologically relevant insights into white matter microstructure compared to conventional methods (Raffelt et al. 2017 ).”
Lee, Z.-L., Tee, M., Tan, W., Huang, X.-Y., Cui, J.-B., Billaud, C., Yu, J., & Hilal, S. (2026) · Alzheimer's & Dementia · doi:10.1002/dad2.70308
“28 FbC is a macroscopic measure of WM 9 , and log(FbC) was calculated.”
Roy, M., Fortier, M., St‐Pierre, V., Morin, M., Boré, A., Edde, M., Vandenberghe, C., Groulx, K., Croteau, É., Richard, G. M., et al. (2026) · Alzheimer s & Dementia Translational Research & Clinical Interventions · doi:10.1002/trc2.70278
“Mean tract diffusion measures (DTI measures, FW, and AFD) were”
Microstructural Correlates of Learning in the Human Brain
Lehmann, N. (2026) · The Neuroscientist · doi:10.1177/10738584261435498
“Building on CSD, fixel-based analysis (FBA) quantifies individual fiber populations within a voxel (“fixels”), rather than collapsing multiple fiber populations into a single voxel-averaged metric (Raffelt et al 2017; Dhollander et al 2021).”
Marek, M. J., Quinones, J. F., Heep, A., & Hildebrandt, A. (2026) · Royal Society Open Science · doi:10.1098/rsos.231980 · Cited by 1
Superficial and deep white matter brain alterations discriminate tinnitus in older adults.
Rodriguez, L. L. G., Rubilar, S. S.-M., Larzabal, H. H., Delgado, C., Medel, V., Delano, P., & Guevara, P. (2026) · Brain Structure and Function · doi:10.1007/s00429-026-03096-7
Wang, W., Yang, Y., Xue, Y., Wang, Y.-Q., Luo, Y.-M., Liu, Y., Lu, F., Shen, G.-P., Xiao, Y., Liu, Z.-Y., et al. (2026) · Scientific Reports · doi:10.1038/s41598-026-45157-1
“Between-group differences in white matter microstructure were examined using FBA 14 .”
InfluentialSex differences in diffusion-weighted imaging outcomes in autosomal dominant Alzheimer’s disease
Giudicessi, A., Koops, E., Baena, A., Alvarez, S., Vidal, M., Martínez, L., Félix, N. A. B., Gonzalez, I., Medrano, R., Tristão-Pereira, C., et al. (2026) · Brain Communications · doi:10.1093/braincomms/fcag081
“31 Tau burden was assessed in three regions of interest known to show early tau accumulation in AD: entorhinal cortex, inferior temporal cortex and precuneus.”
InfluentialZhou, Y.-J., Yang, Y.-H., Cheng, Z.-X., Liu, J.-W., Zhang, Y., Luo, J., Huang, X., Liu, M., Liu, C., Lei, D., et al. (2026) · BMC Psychiatry · doi:10.1186/s12888-026-07961-x
“FBA was performed using the Mrtrix3 official documentation pipeline [21, 36].”
Assessing Measurement Repeatability of a Novel Anisotropic Phantom for Advanced Diffusion MRI Models
Stephens, L., Chavez, S., Kerins, F., & Noseworthy, M. (2026) · Magnetic Resonance in Medicine · doi:10.1002/mrm.70330
“Studies estimate that 33% to 90% of white matter voxels exhibit such complexity and are affected by crossing-fiber effects [16–18].”
Liu, S., Yao, L., Li, F., Ma, X., Weng, X., Li, M., Zhu, J., Liu, C., Zhang, C., & Hu, H. (2026) · Brain and Behavior · doi:10.1002/brb3.71298
“② FC reflects macrostructural changes: axonal loss leads to a reduction in the cross-sectional area of a fiber bundle, indicating decreased spatial occupancy of that tract (Raffelt et al. 2017 ).”
Tamasauskas, A., Perini, I., Minde, J., Keller, S. S., Fallon, N., Frank, B., Morrison, I., & Marshall, A. (2026) · Neurobiology of Pain · doi:10.1016/j.ynpai.2026.100211
“Recommended methodology was followed for Fixel metrics generation (Raffelt, 2017).”
Pyman, P., Kelly, C. E., Dhollander, T., Delagneau, G., Elliott, E., Penington, A. J., Hearps, S., Collins, S. E., Lewis, S., Liang, X., et al. (2026) · Brain Imaging and Behavior · doi:10.1007/s11682-026-01110-4
“FDC reflects the total intra-axonal volume of fibers and their capacity to transmit information (Raffelt et al., 2017).”
Hildesheim, F. E., Jamison, K., Leppert, I., Zumbansen, A., Ophey, A., Funck, T., Kuceyeski, A., & Thiel, A. (2026) · NeuroImage: Clinical · doi:10.1016/j.nicl.2026.103967
“These reductions are tract-specific (Sullivan and Pfefferbaum, 2006), with anterior fiber bundles being typically more affected than posterior tracts (Raffelt et al., 2017).”
Chou, I. W. Y., Manelis, A., Swartz, H. A., Leung, O., Phillips, M. L., So, S., Chu, W., Lu, H., Lam, L. C., & Mak, A. D. P. (2026) · medRxiv · doi:10.64898/2026.01.22.26344600
“FC, defined as the morphological change perpendicular to the fibre (fixel) orientation, was derived by applying warp2metric on the native-to-template warps, and were log-transformed to centre around zero (Raffelt et al., 2017).”
Augustijn, M., Raeve, A. D., Verhelst, H., Warlop, G., & Deconinck, F. J. A. (2026) · Brain Structure and Function · doi:10.1007/s00429-025-03059-4
“…volume fraction) was computed as the integral of the FOD lobe cor - responding to each fixel, while FC (a macrostructural mea - sure related to the cross-sectional area of a fibre bundle) was calculated using the warps generated during registration to the FOD group template (Raffelt et al. 2017).”
InfluentialTsai, C.-C., Chen, C.-L., Yeh, C.-H., Chen, Y.-L., Lin, Y.-C., Cheng, J.-S., & Wang, J.-J. (2026) · European Journal of Radiology · doi:10.1016/j.ejrad.2025.112636
Microstructural White Matter Alterations in Angelman Syndrome: A Fixel‐Based Analysis
Wei, L., Du, X., Qiao, Z.-W., Yang, B., Long, S.-S., Jiang, Y., Wang, Y., & Wang, H. (2025) · Autism Research · doi:10.1002/aur.70160
“Previous studies have suggested that FBA may offer a more accurate assessment of white matter differences compared to conventional tensor-based metrics (Raffelt et al. 2017).”
InfluentialGoodwin, I., Larsen, K. M., Sangchooli, A., Smith, R. E., Banaschewski, T., Barker, G., Bokde, A. L. W., Brühl, R., Desriviéres, S., Garavan, H., et al. (2025) · Human Brain Mapping · doi:10.1002/hbm.70414
Self-citationGiudicessi, A., Koops, E. A., Vila‐Castelar, C., Martinez, L., Ramirez-Perez, N. J., Silva, G., Medrano, R., Martinez, J. E., Solis, I., Alcina, J., et al. (2025) · Journal of Clinical and Experimental Neuropsychology · doi:10.1080/13803395.2025.2591895 · Cited by 3
“…fiber density and cross-section measure (FDC) integrates both microscopic and macroscopic information to provide a comprehensive metric of white matter integrity that is sensitive to changes in both intra-axonal volume and fiber bundle morphology (Dhollander & Connelly, 2016; Raffelt et al., 2017).”
Bao, H.-A. N. T., Wright, D. K., Zamani, A., Roberts, A. C., Rosa, M. G. P., & Reser, D. (2025) · Brain Structure and Function · doi:10.1007/s00429-025-03026-z
“FDC is a composite metric that quantifies white matter connectivity by integrating the fiber density and fiber cross-section, which is useful for detecting subtle connectivity differences and assessing the lateralisation of neural circuits (Raffelt et al. 2017).”
Vidas-Guscic, N., Vasilkovska, T., Pluym, S., van Rijswijk, J., Audekerke, J. V., Tang, H.-Y., Munoz-Sanjuan, I., Pustina, D., Cachope, R., der Linden, A. V., et al. (2025) · bioRxiv · doi:10.1186/s40364-026-00971-7
“Specifically, we previously observed decreases in both fiber density and cross-section at 6 M, indicative of axonal loss and sparsity of the remaining white matter [36, 63].”
End-to-end evaluation of white matter microstructure of the visual pathway in asymmetric glaucomaPreprint
Coutiño, D., Guerrero, J., Domínguez-Frausto, C. A., García-Guillén, M., Coronado-Leija, R., Ramírez-Manzanares, A., Hernandez-Gutierrez, E., Descoteaux, M., Ayala, M., Badillo, M., et al. (2025) · bioRxiv · doi:10.1101/2025.10.20.683506
“From this template, fixel-wise metrics of Fiber Density (FD), Fiber Cross-section (log-FC), and Fiber Density and Cross-section (FDC) were computed [41].”
Ressa, H. J., Newman, B., Jacokes, Z., McPartland, J. C., Kleinhans, N., Druzgal, T., Pelphrey, K., & Horn, J. V. V. (2025) · Imaging neuroscience · doi:10.1162/imag.a.144
“A fixel-based morphometry (FBM) ( D. Raffelt et al., 2012; D. A. Raffelt et al., 2017) approach was used to estimate the intra-axonal cross-sectional area within each voxel to be used as an apparent axonal volume fraction (AVF).”
Lebrun, A., Leprince, Y., Olivieri, P., Moussion, M., Noiray, C., Bottlaender, M., Sarazin, M., & Lagarde, J. (2025) · medRxiv · doi:10.1101/2025.09.05.25333680
“22,23 It provides metrics at both the microstructure (fiber density) and the macrostructure (fiber bundle atrophy) levels.”
THE ROLE OF MRI IN DEBUNKING THE FALLACY OF “MILD” TRAUMATIC BRAIN INJURY
Chen, X., Wright, D. W., Chung, S., & Lui, Y. (2025) · Journal of Magnetic Resonance Imaging · doi:10.1002/jmri.70083
Abnormal Connectivity of the Head Neural Integrator in Cervical Dystonia
Zito, G., Roze, E., Tarrano, C., Ouarab, S., Jegatheesan, P., Ekmen, A., Béranger, B., Valabregue, R., Hubsch, C., Sangla, S., et al. (2025) · Movement Disorders · doi:10.1002/mds.70014
Crotti, M., Radwan, A. M., Itzhak, N. B., Mailleux, L., Kleeren, L., Decraene, L., Feys, H., & Ortibus, E. (2025) · Imaging neuroscience · doi:10.1162/imag.a.122
Wang, X.-Y., Barnett, M., Boonstra, F., Barnett, Y., Cabezas, M., D'Souza, A., Kiernan, M., Kain, K., Law, M., Masters, L., et al. (2025) · arXiv.org · doi:10.48550/arxiv.2508.10950
“Fixel-based analysis FBA [24, 25] is a powerful tool for performing group comparison analysis at the fixel level (i.e., testing for fixel-wise rather than voxel-wise differences) and has previously unmasked differences between patients with ALS and healthy controls (HCs) [20].”
Rosch, K. S., Hyde, C. E., Fuelscher, I. T., Crocetti, D., Singh, M., & Mostofsky, S. H. (2025) · Developmental Medicine & Child Neurology · doi:10.1111/dmcn.16395
“46 Higher values reflect a greater number of axons, supporting more efficient transmission of neural signals.”
Superficial White Matter Brain Alterations Discriminate Tinnitus in Older AdultsPreprint
Rodriguez, L. L. G., Martín, S., Larzabal, H. H., Delgado, C., Medel, V., Delano, P., & Guevara, P. (2025) · medRxiv · doi:10.1101/2025.07.28.25332324
“Additionally, techniques such as fixel-based analysis (Raffelt et al. 2017), neurite orientation dispersion and density imaging (NODDI) (Zhang et al. 2012), and other multi-compartment models can offer deeper insight into microstructural properties by disentangling contributions from axonal…”
TRAMFIX: TRavelling Across Melbourne for FIXel-based analysis (a reproducibility study)Preprint
Mito, R., Genc, S., Halim, J. A., Yang, J. Y., Tournier, J.-D., Kean, M., Kokkinos, C., McIntyre, R., Biase, M. D. D., Smith, R. E., et al. (2025) · bioRxiv · doi:10.1101/2025.07.21.666058
“…psychopathology (Grazioplene et al., 2022; Kristensen et al., 2023, 2024; Lyon et al., 2019) and neurological disorders (Mito et al., 2022, 2024; Raffelt et al., 2017; Vaughan et al., 2017), as well as in healthy development (Genc et al., 2018; Genc, Malpas, et al., 2020) and aging (Kelley et…”
InfluentialSelf-citationElder, M. M., & Ellmore, T. (2025) · bioRxiv · doi:10.1101/2025.07.17.665387
“Given the complexity of memory retrieval and its reliance on distributed white matter networks, we first employed a whole-brain fixel-based analysis (FBA) to identify age-and performance-related variations in fiber density (FD), fiber cross-section (FC), and their combined metric (FDC).”
InfluentialTamasauskas, A., Perini, I., Minde, J., Keller, S., Fallon, N., Frank, B., Morrison, I., & Marshall, A. (2025) · bioRxiv · doi:10.1101/2025.07.09.663977
“Recommended methodology was followed for Fixel metrics generation 52 .”
Qiu, M., Xiang, Y., Li, L.-X., Pan, L., Song, Y.-P., Feng, L., & Jin, L.-J. (2025) · Brain Research Bulletin · doi:10.1016/j.brainresbull.2025.111445
“Nevertheless, the findings obtained from voxel-based analysis (VBA) are confronted with interpretational difficulties because they are based on signal volume disparities rather than precise estimates of axon count or fiber density (Raffelt et al., 2017).”
Raikes, A., Dyke, J., Nerattini, M., Boneu, C., Ajila, T., Fauci, F., Battista, M., Pahlajani, S., Williams, S., Brinton, R. D., et al. (2025) · bioRxiv · doi:10.1101/2025.06.09.658686
“One method for probing such macrostructural features using diffusion MRI is a “fixel-based” approach 24 .”
InfluentialManelis, A., Hu, H., Satz, S., Iyengar, S., & Swartz, H. A. (2025) · Journal of Affective Disorders · doi:10.1016/j.jad.2025.119574 · Cited by 2
Sathe, A., Chatterjee, A., Shashikumar, N., Pechman, K. R., Schilling, K. G., Landman, B. A., Bolton, C. J., Zhang, P., Bender, A. R., Hohman, T. J., et al. (2025) · medRxiv · doi:10.1101/2025.05.29.25328528
“Fixel-based analysis (FBA) (D. A. Raffelt et al., 2017) is an emerging approach that uses dMRI data to quantify properties of individual fiber populations or “fixels” within a voxel.”
Patterns of Structural Disconnection Driving Proprioceptive Deficits After StrokePreprint
Kaeja, M., Gajiyeva, L., Iturria-Medina, Y., Villringer, A., Sehm, B., & Steele, C. (2025) · bioRxiv · doi:10.1101/2025.05.22.655663
Fixel based analysis on diffusion MRI of COVID-19 survivors
Mishra, S. S., Gandhi, T., & Biswal, B. (2025) · Neuroimage: Reports · doi:10.1016/j.ynirp.2025.100253
“For Fixel-Based Analysis (FBA) of dMRI, the steps outlined by Raffelt and colleagues were employed in conjunction with guidelines from the MRtrix documentation (Raffelt et al., 2017).”
InfluentialHakhu, S., Hu, L. S., Beeman, S. C., & Sadleir, R. (2025) · Frontiers in Radiology · doi:10.3389/fradi.2025.1492479
Fixel-Based Analysis of White Matter Alterations in Facial Palsy
Wang, Y., Wang, W., Ma, H., Zhang, C.-H., & Lu, Y.-C. (2024) · The Journal of craniofacial surgery (Print) · doi:10.1097/scs.0000000000010791
“19,20 The brain images of patients with right-sided facial paralysis were horizontally fl ipped for subsequent analysis, with facial nerve injury localized to the left side.”
Kanel, D., Fox, N. A., Pine, D. S., Zeanah, C. H., Nelson, C. A., McLaughlin, K. A., & Sheridan, M. A. (2024) · Developmental Cognitive Neuroscience · doi:10.1016/j.dcn.2024.101440 · Cited by 2
“Fixel-based processing steps were conducted using MRtrix3 software (version 3.0.3), according to procedures outlined in the MRtrix3 documentation (Raffelt et al., 2017).”
InfluentialZhang, J., Wang, Y.-Q., Shu, Z.-Y., Ouyang, Y., Zhang, X.-R., Wang, H.-Q., Zhang, L., Fang, S., Ye, X., & Li, J.-B. (2024) · Cortex; a journal devoted to the study of the nervous system and behavior · doi:10.1016/j.cortex.2024.09.004
Fan, F., Beare, R., Genc, S., Shapiro, J., Takagi, M., Hearps, S. J. C., Parkin, G. M., Rausa, V. C., Anderson, N., Fabiano, F., et al. (2024) · Journal of Neurosurgery: Pediatrics · doi:10.3171/2024.6.peds2499
Visual training after central retinal loss limits structural white matter degradation: an MRI study
Kozak, A., Ninghetto, M., Wieteska, M., Fiedorowicz, M., Wełniak-Kamińska, M., Kossowski, B., Eysel, U., Arckens, L., & Burnat, K. (2024) · Behavioral and Brain Functions · doi:10.1186/s12993-024-00239-w
Park, Y., Joers, J., Guo, B., Hutter, D., Bushara, K., Adanyeguh, I., Eberly, L., Öz, G., & Lenglet, C. (2022) · Frontiers in Neurology · doi:10.3389/fneur.2022.1038298
Fixel-based analysis in patients after the first episode in schizophrenia
Slezak, O., Škoch, A., Žižka, J., Bayer, D., Španiel, F., Tintěra, J., Vaňásek, J., Eliáš, P., & Ryška, P. (2022) · Česká radiologie · doi:10.55095/cesradiol2022/013
124 MEGAbIT – the role of OPM MEG in assessment and diagnosis In mTBI
Allen, C., Rier, L., Halsey, L., Gascoyne, L. E., Dineen, R., das Nair, R., Brookes, M., & Evangelou, N. (2022) · Journal of Neurology Neurosurgery & Psychiatry · doi:10.1136/jnnp-2022-abn.157
128 White matter fibre loss in Parkinson’s disease hallucinations
Zarkali, A., McColgan, P., Leyland, L.-A., Rees, G., & Weil, R. (2022) · Journal of Neurology Neurosurgery & Psychiatry · doi:10.1136/jnnp-2022-abn.161
Dihmis, O., Jamal, R., Carroll, L., & Pengas, G. (2022) · Journal of Neurology Neurosurgery & Psychiatry · doi:10.1136/jnnp-2022-abn.160
Zarkali, A., McColgan, P., Ryten, M., Reynolds, R., Leyland, L.-A., Lees, A., Rees, G., & Weil, R. (2022) · Journal of Neurology Neurosurgery & Psychiatry · doi:10.1136/jnnp-2022-abn.162
Hsu, C., Chong, S., Kung, Y.-C., Kuo, K.-T., Huang, C.-C., & Lin, C.-P. (2022) · bioRxiv · doi:10.1101/2022.03.14.483870
The changes in white matter pathways that occur in acute sports-related mild Traumatic Brain Injury
Mito, R., Parker, D., Abbott, D. F., Makdissi, M., Pedersen, M., & Jackson, G. D. (2022) · medRxiv · doi:10.1101/2022.02.07.22270651
Self-citationMuggli, E., Halliday, J., Elliott, E. J., Penington, A., Thompson, D. K., Spittle, A. J., Forster, D. A., Lewis, S., Hearps, S., & Anderson, P. (2021) · medRxiv · doi:10.1101/2021.06.17.21259124
Diffusion interactions between crossing fibers of the brain
Buldyrev, S., Meng, X.-Y., Reese, T., Mortazavi, F., Rosene, D., Stanley, H., & Wedeen, V. (2021) · Magnetic Resonance in Medicine · doi:10.1002/mrm.28702
Chang, X.-B., Jia, X.-Y., Dong, D.-B., & Wang, Y. (2020) · bioRxiv (Cold Spring Harbor Laboratory) · doi:10.1101/2020.11.06.372300
Stick Stippling for Joint 3D Visualization of Diffusion MRI Fiber Orientations and Density
Cabeen, R. P., Laidlaw, D., & Toga, A. (2020) · bioRxiv · doi:10.1101/2020.06.15.153098
A Measure of Whole-Brain White Matter TopographyPreprint
Wang, J., & Shi, Y. (2019) · bioRxiv (Cold Spring Harbor Laboratory) · doi:10.1101/783274
Imaging White Matter Pathology in Epilepsy
Liu, M., Concha, L., Bernhardt, B., Bernasconi, N., & Bernasconi, A. (2019) · Imaging Biomarkers in Epilepsy · doi:10.1017/9781316257951.008
Metadata
- Authors
- Raffelt, D. A., Tournier, J.-D., Smith, R. E., Vaughan, D. N., Jackson, G., Ridgway, G. R., & Connelly, A.
- Affiliations
- Florey Institute of Neuroscience and Mental Health (AU)
- King's College London (GB)
- The University of Melbourne (AU)
- Wellcome Centre for Human Neuroimaging (GB)
- Corresponding author
- Raffelt, David A.
- ORCID
- Venue
- NeuroImage
- Publisher
- Elsevier BV
- Published
- 2017-01
- Volume
- 144
- Issue
- Pt A
- Pages
- 58-73
- ISSN
- 1053-8119 (ISSN-L)
- PMC
- PMC5182031
- OpenAlex
- W2520744072
- Cited by
- 620
- References
- 91
- Citations by year
- 2026: 74 · 2025: 79 · 2024: 78 · 2023: 76 · 2022: 84 · 2021: 91 · 2020: 71 · 2019: 30 · 2018: 26 · 2017: 9
- FWCI
- 19.39
- Type
- journal article
- Language
- en
- Open access
- hybrid
- doi.org
- Locations
- NeuroImage (publishedVersion, cc-by)
- PubMed Central (publishedVersion, cc-by)
- PubMed (publishedVersion)
- UCL Discovery (University College London) (submittedVersion)
- Research Portal (King's College London) (submittedVersion, cc-by)
- Funders
- National Health and Medical Research Council (NHMRC)
- Victorian Government’s Operational Infrastructure
- UK Medical Research Council (MR/J014257/2)
- Wellcome Trust (091593/Z/10/Z)
- Topics
- Health Sciences › Medicine › Radiology, Nuclear Medicine and Imaging › Advanced Neuroimaging Techniques and Applications
- Life Sciences › Neuroscience › Cognitive Neuroscience › Functional Brain Connectivity Studies
- Health Sciences › Medicine › Radiology, Nuclear Medicine and Imaging › Advanced MRI Techniques and Applications
- Keywords
- fixel-based analysis, crossing fibers, axon number
- MeSH terms
- Humans, Nerve Fibers, Myelinated, Diffusion Magnetic Resonance Imaging, White Matter
About these checks
Registry, retraction, Cites and statistics results are computed, not judged, with one exception: a printed reference that no index lists is read once by a model before it counts as a citation error. Claims are extracted by a model and kept only when their quote appears verbatim in the text; each cited source is then checked, with a model’s help, for whether it says what the claim relies on. Those verdicts can be wrong — read the claim’s quote and the cited source before relying on one.
Statistics and arithmetic are recomputed, not judged.
Confidence bands are shown only for fields calibrated on our annotated test set. None is calibrated yet, so no band is shown.
What counts as a claim ›How we measure confidence ›How we check this ›
Are you an author, or do you see a problem with this page? Request a review
