

The DOI matches its Crossref record; 57 of the 57 references it cites were found in a registry or an index; none of the 53 sources its claims cite is checked for support yet.
Hippocampal subfield volumetry in mild cognitive impairment, Alzheimer's disease and semantic dementia
Open accessAbstract
BACKGROUND: Hippocampal atrophy is a well-known feature of Alzheimer's disease (AD), but sensitivity and specificity of hippocampal volumetry are limited. Neuropathological studies have shown that hippocampal subfields are differentially vulnerable to AD; hippocampal subfield volumetry may thus prove to be more accurate than global hippocampal volumetry to detect AD. METHODS: CA1, subiculum and other subfields were manually delineated from 40 healthy controls, 18 AD, 17 amnestic Mild Cognitive Impairment (aMCI), and 8 semantic dementia (SD) patients using a previously developed high resolution MRI procedure. Non-parametric group comparisons and receiver operating characteristic (ROC) analyses were conducted. Complementary analyses were conducted to evaluate differences of hemispheric asymmetry and anterior-predominance between AD and SD patients and to distinguish aMCI patients with or without β-amyloid deposition as assessed by Florbetapir-TEP. RESULTS: Global hippocampi were atrophied in all three patient groups and volume decreases were maximal in the CA1 subfield (22% loss in aMCI, 27% in both AD and SD; all p < 0.001). In aMCI, CA1 volumetry was more accurate than global hippocampal measurement to distinguish patients from controls (areas under the ROC curve = 0.88 and 0.76, respectively; p = 0.05) and preliminary analyses suggest that it was independent from the presence of β-amyloid deposition. In patients with SD, whereas the degree of CA1 and subiculum atrophy was similar to that found in AD patients, hemispheric and anterior-posterior asymmetry were significantly more marked than in AD with greater involvement of the left and anterior hippocampal subfields. CONCLUSIONS: The findings suggest that CA1 measurement is more sensitive than global hippocampal volumetry to detect structural changes at the pre-dementia stage, although the predominance of CA1 atrophy does not appear to be specific to AD pathophysiological processes.
Overview
AI snapshot
Written from the paper’s full text.
TL;DR
Manual hippocampal subfield volumetry in 40 controls, 17 aMCI, 18 AD, and 8 semantic dementia patients showed maximal atrophy in CA1 across patient groups. CA1 volume was more accurate than global hippocampal volume for distinguishing aMCI from controls, but CA1 predominance was not specific to AD pathophysiology.
Key findings
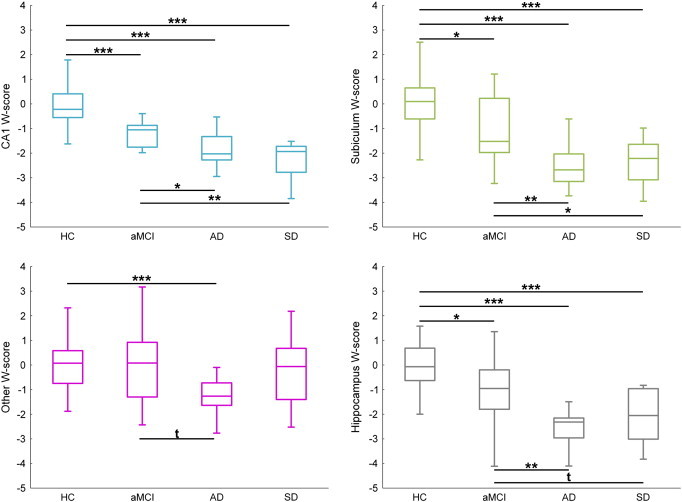
- Global hippocampal volume was reduced in all patient groups: −12% in aMCI, −22% in AD, and −17% in SD. CA1 showed the largest losses: −22% in aMCI and −27% in both AD and SD (all p < 0.001).
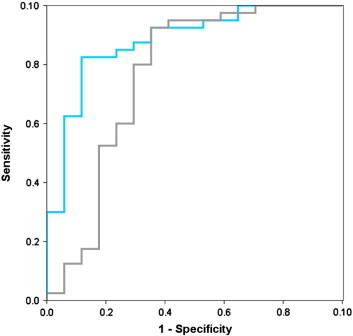
- In aMCI, CA1 volumetry discriminated patients from controls better than global hippocampal volume (AUC = 0.88 [0.78–0.98] vs. 0.76 [0.60–0.93], p = 0.05). In AD vs. controls, no subfield outperformed the whole hippocampus (whole hippocampus AUC = 0.91 [0.78–1]; CA1 = 0.92 [0.85–0.99]).
- SD showed greater hemispheric asymmetry than AD for the whole hippocampus (p = 0.001), subiculum (p = 0.02), and other subfields (p = 0.01), with a trend for CA1 (p = 0.06); SD also had a lower anterior–posterior index for whole hippocampus, CA1, and subiculum, indicating anterior-predominant atrophy.
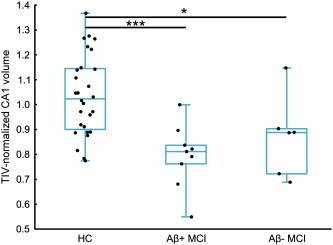
- Among 15 aMCI patients with Florbetapir PET, Aβ-positive aMCI had lower CA1 (p < 0.001), subiculum (p = 0.01), and hippocampal volumes (p = 0.01) than controls, while Aβ-negative aMCI only showed lower CA1 volume (p = 0.04); direct Aβ-positive vs. Aβ-negative comparisons were not significant (all p > 0.25).
Methods
- Cross-sectional study of 83 right-handed participants: 40 healthy controls, 17 aMCI, 18 AD, and 8 SD patients.
- CA1, subiculum, and “other” subfields (CA2–CA3–CA4 plus dentate gyrus) were manually delineated on high-resolution 3-Tesla MRI slices perpendicular to the hippocampal long axis; volumes were TIV-normalized and converted to age- and gender-adjusted W-scores.
- Non-parametric group comparisons (Kruskal–Wallis, Mann–Whitney U), ROC/AUC analyses, asymmetry and anterior–posterior indices, and Florbetapir PET analyses in 18 AD and 15 aMCI patients using a neocortical SUVr threshold of 1.1.
Limitations
- Stated: patient groups were relatively small, especially when aMCI was split by Aβ status; Aβ-related findings were considered preliminary. The paper also states that subfield volumetry provides approximations based on anatomical landmarks, that protocols differ across studies without direct comparison to neuropathological gold standard, and that high-resolution scans are prone to motion artifacts.
- Stated: the absence of significant AD vs. SD differences could be due to lack of statistical power.
- Evident: manual delineation was performed by a single rater, and the text does not report inter-rater or test–retest reliability metrics for the present sample; the design is cross-sectional, so diagnostic/prognostic accuracy over time is not established.
Model-written summary. Check it against the paper before relying on it.
Integrity signals
Registry
Cites
Statistics
Figures
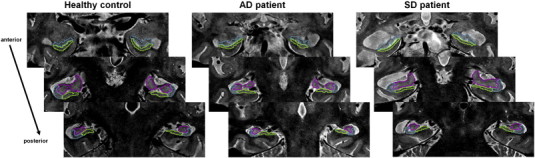
Verification
Claims the paper makes
42 Own result · 25 Not checked yet · 11 Own method · 9 Own interpretation
A result the paper reports from its own data — it cites no other source for it, so there is none to check. The quote shows it is in the paper.
In the paper
“Asymmetry was significantly stronger in SD than in AD for the whole hippocampus (p = 0.001), subiculum (p = 0.02), other (p = 0.01) and a trend was found for CA1 (p = 0.06).”
§ Hippocampal subfield volumetry in mild cognitive impairment, Alzheimer's disease and semantic dementia☆ > Results > Hemispheric asymmetry and anterior–posterior gradient in AD and SD
plaincorrelational- Asserted: passes — The authors put it forward as true.
- Checkable: passes — It can be checked against evidence.
- Load-bearing: unclear — It is unclear whether the paper’s conclusions depend on it.
- Based: passes — The paper gives a reason why it holds.
A result the paper reports from its own data — it cites no other source for it, so there is none to check. The quote shows it is in the paper.
In the paper
“In the SD group, both CA1 and subiculum volumes were significantly reduced relative to HC (− 27% and − 24% respectively, both p < 0.001).”
§ Hippocampal subfield volumetry in mild cognitive impairment, Alzheimer's disease and semantic dementia☆ > Results > Atrophy of hippocampal subfields in patients
plaindirect- Asserted: passes — The authors put it forward as true.
- Checkable: passes — It can be checked against evidence.
- Load-bearing: unclear — It is unclear whether the paper’s conclusions depend on it.
- Based: passes — The paper gives a reason why it holds.
- Rests on an assumption: Healthy controls are free of preclinical Alzheimer's disease pathology.
A result the paper reports from its own data — it cites no other source for it, so there is none to check. The quote shows it is in the paper.
In the paper
“For the AD versus HC discrimination, the AUC of all subfields was significantly higher than 0.5 (mean [95% CI] = 0.92 [0.85–0.99] for CA1, 0.88 [0.76–1] for subiculum, 0.81 [0.67–0.94] for other) but none of them was significantly higher than that of the whole hippocampus (0.91 [0.78–1]).”
§ Hippocampal subfield volumetry in mild cognitive impairment, Alzheimer's disease and semantic dementia☆ > Results > Evaluation of diagnostic accuracy
plain- Asserted: passes — The authors put it forward as true.
- Checkable: passes — It can be checked against evidence.
- Load-bearing: unclear — It is unclear whether the paper’s conclusions depend on it.
- Based: passes — The paper gives a reason why it holds.
- Rests on an assumption: Healthy controls are free of preclinical Alzheimer's disease pathology.
A result the paper reports from its own data — it cites no other source for it, so there is none to check. The quote shows it is in the paper.
In the paper
“A Kruskal–Wallis ANOVA with three groups (HC, Aβ-positive aMCI, Aβ-negative aMCI) was performed on TIV-normalized hippocampal measurements. A significant effect of group was found for CA1 (H = 13.8; p = 0.001), subiculum (H = 5.99; p = 0.05) and global hippocampus (H = 5.98; p = 0.05).”
§ Hippocampal subfield volumetry in mild cognitive impairment, Alzheimer's disease and semantic dementia☆ > Results > Volume of hippocampal subfields versus neocortical amyloid load in aMCI patients
plaincorrelational- Asserted: passes — The authors put it forward as true.
- Checkable: passes — It can be checked against evidence.
- Load-bearing: passes — The paper’s conclusions depend on it.
- Based: passes — The paper gives a reason why it holds.
- Rests on an assumption: Healthy controls are free of preclinical Alzheimer's disease pathology.
A result the paper reports from its own data — it cites no other source for it, so there is none to check. The quote shows it is in the paper.
In the paper
“Asymmetry was significantly stronger in SD than in AD for the whole hippocampus (p = 0.001), subiculum (p = 0.02), other (p = 0.01) and a trend was found for CA1 (p = 0.06).”
§ Hippocampal subfield volumetry in mild cognitive impairment, Alzheimer's disease and semantic dementia☆ > Results > Hemispheric asymmetry and anterior–posterior gradient in AD and SD
plaincorrelational- Asserted: passes — The authors put it forward as true.
- Checkable: passes — It can be checked against evidence.
- Load-bearing: unclear — It is unclear whether the paper’s conclusions depend on it.
- Based: passes — The paper gives a reason why it holds.
A result the paper reports from its own data — it cites no other source for it, so there is none to check. The quote shows it is in the paper.
In the paper
“Similarly to the findings in the AD group, comparing degrees of atrophy (expressed as W-scores) between the three subfields in SD showed that both CA1 and subiculum were significantly more affected than the other subfield (both p < 0.05 Wilcoxon rank-sum test).”
§ Hippocampal subfield volumetry in mild cognitive impairment, Alzheimer's disease and semantic dementia☆ > Results > Atrophy of hippocampal subfields in patients
plain- Asserted: passes — The authors put it forward as true.
- Checkable: passes — It can be checked against evidence.
- Load-bearing: unclear — It is unclear whether the paper’s conclusions depend on it.
- Based: passes — The paper gives a reason why it holds.
- Rests on an assumption: Healthy controls are free of preclinical Alzheimer's disease pathology.
A result the paper reports from its own data — it cites no other source for it, so there is none to check. The quote shows it is in the paper.
In the paper
“None of the volumes differed between AD and SD patients (all p values > 0.15).”
§ Hippocampal subfield volumetry in mild cognitive impairment, Alzheimer's disease and semantic dementia☆ > Results > Atrophy of hippocampal subfields in patients
plain- Asserted: passes — The authors put it forward as true.
- Checkable: passes — It can be checked against evidence.
- Load-bearing: unclear — It is unclear whether the paper’s conclusions depend on it.
- Based: passes — The paper gives a reason why it holds.
A result the paper reports from its own data — it cites no other source for it, so there is none to check. The quote shows it is in the paper.
In the paper
“The direct comparison between Aβ-positive aMCI and Aβ-negative aMCI did not show any significant difference (all p values > 0.25).”
§ Hippocampal subfield volumetry in mild cognitive impairment, Alzheimer's disease and semantic dementia☆ > Results > Volume of hippocampal subfields versus neocortical amyloid load in aMCI patients
plain- Asserted: passes — The authors put it forward as true.
- Checkable: passes — It can be checked against evidence.
- Load-bearing: passes — The paper’s conclusions depend on it.
- Based: passes — The paper gives a reason why it holds.
A result the paper reports from its own data — it cites no other source for it, so there is none to check. The quote shows it is in the paper.
In the paper
“Similarly, none of the volumes significantly correlated with Florbetapir neocortical SUVr in the whole group of 15 aMCI (CA1: Spearman's ρ = − 0.34, p = 0.22; subiculum ρ = − 0.26, p = 0.34; other ρ = − 0.01, p = 0.96; whole hippocampus ρ = − 0.23, p = 0.41).”
§ Hippocampal subfield volumetry in mild cognitive impairment, Alzheimer's disease and semantic dementia☆ > Results > Volume of hippocampal subfields versus neocortical amyloid load in aMCI patients
plainn = 15- Asserted: passes — The authors put it forward as true.
- Checkable: passes — It can be checked against evidence.
- Load-bearing: unclear — It is unclear whether the paper’s conclusions depend on it.
- Based: passes — The paper gives a reason why it holds.
A result the paper reports from its own data — it cites no other source for it, so there is none to check. The quote shows it is in the paper.
In the paper
“Post-hoc analyses revealed that Aβ-positive aMCI had significantly lower CA1 (p < 0.001), subiculum (p = 0.01) and hippocampal volumes (p = 0.01) as compared to HC, while Aβ-negative aMCI only showed lower CA1 volume (p = 0.04) as compared to HC, as illustrated in Fig. 4.”
§ Hippocampal subfield volumetry in mild cognitive impairment, Alzheimer's disease and semantic dementia☆ > Results > Volume of hippocampal subfields versus neocortical amyloid load in aMCI patients
plain- Asserted: passes — The authors put it forward as true.
- Checkable: passes — It can be checked against evidence.
- Load-bearing: passes — The paper’s conclusions depend on it.
- Based: passes — The paper gives a reason why it holds.
- Rests on an assumption: Healthy controls are free of preclinical Alzheimer's disease pathology.
- It may state two separate claims as one. 29
- Probably not a substantial claim. 13
A result the paper reports from its own data — it cites no other source for it, so there is none to check. The quote shows it is in the paper.
In the paper
“In AD, volume decreases were highly significant (p < 0.001) for all three subfields, but atrophy in the other region (− 17%) was significantly lower (p < 0.005 using Wilcoxon rank-sum test) than in both CA1 and subiculum (both − 27%).”
§ Hippocampal subfield volumetry in mild cognitive impairment, Alzheimer's disease and semantic dementia☆ > Results > Atrophy of hippocampal subfields in patients
plaindirect- Asserted: passes — The authors put it forward as true.
- Checkable: passes — It can be checked against evidence.
- Load-bearing: passes — The paper’s conclusions depend on it.
- Based: passes — The paper gives a reason why it holds.
It may state two separate claims as one.
- Rests on an assumption: Healthy controls are free of preclinical Alzheimer's disease pathology.
A result the paper reports from its own data — it cites no other source for it, so there is none to check. The quote shows it is in the paper.
In the paper
“In AD, volume decreases were highly significant (p < 0.001) for all three subfields, but atrophy in the other region (− 17%) was significantly lower (p < 0.005 using Wilcoxon rank-sum test) than in both CA1 and subiculum (both − 27%).”
§ Hippocampal subfield volumetry in mild cognitive impairment, Alzheimer's disease and semantic dementia☆ > Results > Atrophy of hippocampal subfields in patients
plaindirect- Asserted: passes — The authors put it forward as true.
- Checkable: passes — It can be checked against evidence.
- Load-bearing: passes — The paper’s conclusions depend on it.
- Based: passes — The paper gives a reason why it holds.
It may state two separate claims as one.
- Rests on an assumption: Healthy controls are free of preclinical Alzheimer's disease pathology.
A result the paper reports from its own data — it cites no other source for it, so there is none to check. The quote shows it is in the paper.
In the paper
“In AD, volume decreases were highly significant (p < 0.001) for all three subfields, but atrophy in the other region (− 17%) was significantly lower (p < 0.005 using Wilcoxon rank-sum test) than in both CA1 and subiculum (both − 27%).”
§ Hippocampal subfield volumetry in mild cognitive impairment, Alzheimer's disease and semantic dementia☆ > Results > Atrophy of hippocampal subfields in patients
plaindirect- Asserted: passes — The authors put it forward as true.
- Checkable: passes — It can be checked against evidence.
- Load-bearing: passes — The paper’s conclusions depend on it.
- Based: passes — The paper gives a reason why it holds.
It may state two separate claims as one.
- Rests on an assumption: Healthy controls are free of preclinical Alzheimer's disease pathology.
A result the paper reports from its own data — it cites no other source for it, so there is none to check. The quote shows it is in the paper.
In the paper
“Finally, none of the volume measurements were allowed to separate AD from SD as none of the AUCs was significantly different from 0.5: 0.51 [0.27–0.74] for CA1, 0.64 [0.43–0.85] for subiculum, 0.69 [0.45–0.94] for other, and 0.69 [0.47–0.90] for the whole hippocampus.”
§ Hippocampal subfield volumetry in mild cognitive impairment, Alzheimer's disease and semantic dementia☆ > Results > Evaluation of diagnostic accuracy
plain- Asserted: passes — The authors put it forward as true.
- Checkable: passes — It can be checked against evidence.
- Load-bearing: passes — The paper’s conclusions depend on it.
- Based: passes — The paper gives a reason why it holds.
It may state two separate claims as one.
A result the paper reports from its own data — it cites no other source for it, so there is none to check. The quote shows it is in the paper.
In the paper
“In aMCI, atrophy was highly significant in CA1 (− 22%, p < 0.001) and to a lesser extent in the subiculum (− 17%, p = 0.01).”
§ Hippocampal subfield volumetry in mild cognitive impairment, Alzheimer's disease and semantic dementia☆ > Results > Atrophy of hippocampal subfields in patients
plaincorrelational- Asserted: passes — The authors put it forward as true.
- Checkable: passes — It can be checked against evidence.
- Load-bearing: unclear — It is unclear whether the paper’s conclusions depend on it.
- Based: passes — The paper gives a reason why it holds.
It may state two separate claims as one.
- Rests on an assumption: Healthy controls are free of preclinical Alzheimer's disease pathology.
A result the paper reports from its own data — it cites no other source for it, so there is none to check. The quote shows it is in the paper.
In the paper
“For the AD versus HC discrimination, the AUC of all subfields was significantly higher than 0.5 (mean [95% CI] = 0.92 [0.85–0.99] for CA1, 0.88 [0.76–1] for subiculum, 0.81 [0.67–0.94] for other) but none of them was significantly higher than that of the whole hippocampus (0.91 [0.78–1]).”
§ Hippocampal subfield volumetry in mild cognitive impairment, Alzheimer's disease and semantic dementia☆ > Results > Evaluation of diagnostic accuracy
plaincorrelational- Asserted: passes — The authors put it forward as true.
- Checkable: passes — It can be checked against evidence.
- Load-bearing: passes — The paper’s conclusions depend on it.
- Based: passes — The paper gives a reason why it holds.
It may state two separate claims as one.
- Rests on an assumption: Healthy controls are free of preclinical Alzheimer's disease pathology.
A result the paper reports from its own data — it cites no other source for it, so there is none to check. The quote shows it is in the paper.
In the paper
“For the AD versus HC discrimination, the AUC of all subfields was significantly higher than 0.5 (mean [95% CI] = 0.92 [0.85–0.99] for CA1, 0.88 [0.76–1] for subiculum, 0.81 [0.67–0.94] for other) but none of them was significantly higher than that of the whole hippocampus (0.91 [0.78–1]).”
§ Hippocampal subfield volumetry in mild cognitive impairment, Alzheimer's disease and semantic dementia☆ > Results > Evaluation of diagnostic accuracy
plaincorrelational- Asserted: passes — The authors put it forward as true.
- Checkable: passes — It can be checked against evidence.
- Load-bearing: unclear — It is unclear whether the paper’s conclusions depend on it.
- Based: passes — The paper gives a reason why it holds.
It may state two separate claims as one.
- Rests on an assumption: Healthy controls are free of preclinical Alzheimer's disease pathology.
A result the paper reports from its own data — it cites no other source for it, so there is none to check. The quote shows it is in the paper.
In the paper
“For the AD versus HC discrimination, the AUC of all subfields was significantly higher than 0.5 (mean [95% CI] = 0.92 [0.85–0.99] for CA1, 0.88 [0.76–1] for subiculum, 0.81 [0.67–0.94] for other) but none of them was significantly higher than that of the whole hippocampus (0.91 [0.78–1]).”
§ Hippocampal subfield volumetry in mild cognitive impairment, Alzheimer's disease and semantic dementia☆ > Results > Evaluation of diagnostic accuracy
plaincorrelational- Asserted: passes — The authors put it forward as true.
- Checkable: passes — It can be checked against evidence.
- Load-bearing: passes — The paper’s conclusions depend on it.
- Based: passes — The paper gives a reason why it holds.
It may state two separate claims as one.
- Rests on an assumption: Healthy controls are free of preclinical Alzheimer's disease pathology.
A result the paper reports from its own data — it cites no other source for it, so there is none to check. The quote shows it is in the paper.
In the paper
“For the discrimination between HC and aMCI, the AUC of CA1 (0.88 [0.78–0.98]) was significantly higher than 0.5 and higher than the AUC of the whole hippocampus (0.76 [0.60–0.93], p = 0.05; see Fig. 3)”
- Also stated in: § Results · plain
“In aMCI, CA1 volumetry was more accurate than global hippocampal measurement to distinguish patients from controls (areas under the ROC curve = 0.88 and 0.76, respectively; p = 0.05)”
§ Hippocampal subfield volumetry in mild cognitive impairment, Alzheimer's disease and semantic dementia☆ > Results > Evaluation of diagnostic accuracy
plain- Asserted: passes — The authors put it forward as true.
- Checkable: passes — It can be checked against evidence.
- Load-bearing: passes — The paper’s conclusions depend on it.
- Based: passes — The paper gives a reason why it holds.
It may state two separate claims as one.
- Rests on an assumption: Healthy controls are free of preclinical Alzheimer's disease pathology.
- Also stated in: § Results · plain
A result the paper reports from its own data — it cites no other source for it, so there is none to check. The quote shows it is in the paper.
In the paper
“whereas the subiculum AUC (0.74 [0.59–0.90]) was significantly higher than 0.5 but did not perform better than the whole hippocampus”
§ Hippocampal subfield volumetry in mild cognitive impairment, Alzheimer's disease and semantic dementia☆ > Results > Evaluation of diagnostic accuracy
plain- Asserted: passes — The authors put it forward as true.
- Checkable: passes — It can be checked against evidence.
- Load-bearing: passes — The paper’s conclusions depend on it.
- Based: passes — The paper gives a reason why it holds.
It may state two separate claims as one.
- Rests on an assumption: Healthy controls are free of preclinical Alzheimer's disease pathology.
A result the paper reports from its own data — it cites no other source for it, so there is none to check. The quote shows it is in the paper.
In the paper
“Briefly, the volume of the whole hippocampus was significantly decreased in all three patient groups as compared to HC (mean volume loss = − 12% for aMCI, − 22% for AD and − 17% for SD).”
- Also stated in: § Results · plain
“Global hippocampi were atrophied in all three patient groups and volume decreases were maximal in the CA1 subfield (22% loss in aMCI, 27% in both AD and SD; all p < 0.001).”
§ Hippocampal subfield volumetry in mild cognitive impairment, Alzheimer's disease and semantic dementia☆ > Results > Atrophy of hippocampal subfields in patients
plaincorrelational- Asserted: passes — The authors put it forward as true.
- Checkable: passes — It can be checked against evidence.
- Load-bearing: passes — The paper’s conclusions depend on it.
- Based: passes — The paper gives a reason why it holds.
It may state two separate claims as one.
- Rests on an assumption: Healthy controls are free of preclinical Alzheimer's disease pathology.
- Also stated in: § Results · plain
A result the paper reports from its own data — it cites no other source for it, so there is none to check. The quote shows it is in the paper.
In the paper
“In aMCI, atrophy was highly significant in CA1 (− 22%, p < 0.001) and to a lesser extent in the subiculum (− 17%, p = 0.01).”
- Also stated in: § Results · plain
“volume decreases were maximal in the CA1 subfield (22% loss in aMCI, 27% in both AD and SD; all p < 0.001).”
§ Hippocampal subfield volumetry in mild cognitive impairment, Alzheimer's disease and semantic dementia☆ > Results > Atrophy of hippocampal subfields in patients
plain- Asserted: passes — The authors put it forward as true.
- Checkable: passes — It can be checked against evidence.
- Load-bearing: passes — The paper’s conclusions depend on it.
- Based: passes — The paper gives a reason why it holds.
It may state two separate claims as one.
- Rests on an assumption: Healthy controls are free of preclinical Alzheimer's disease pathology.
- Also stated in: § Results · plain
A result the paper reports from its own data — it cites no other source for it, so there is none to check. The quote shows it is in the paper.
In the paper
“All AD patients were classified as Aβ-positive and 9 aMCI patients (60% of aMCI patients who underwent Florbetapir-PET) were classified as Aβ-positive.”
§ Hippocampal subfield volumetry in mild cognitive impairment, Alzheimer's disease and semantic dementia☆ > Material and methods > Statistical analyses
plainn = 9- Asserted: passes — The authors put it forward as true.
- Checkable: passes — It can be checked against evidence.
- Load-bearing: passes — The paper’s conclusions depend on it.
- Based: passes — The paper gives a reason why it holds.
It may state two separate claims as one.
None of the sources cited for this claim have been checked yet.
In the paper
“Hippocampal atrophy is a major feature of Alzheimer's disease (AD) (Frisoni et al., 2010) that strongly correlates with AD neuropathology (Bobinski et al., 1996; Jack et al., 2002).”
§ Hippocampal subfield volumetry in mild cognitive impairment, Alzheimer's disease and semantic dementia☆ > Introduction
What the sources say
boostedcorrelational- Asserted: passes — The authors put it forward as true.
- Checkable: passes — It can be checked against evidence.
- Load-bearing: passes — The paper’s conclusions depend on it.
- Based: passes — The paper gives a reason why it holds.
It may state two separate claims as one.
None of the sources cited for this claim have been checked yet.
In the paper
“All patients were recruited from local memory clinics and selected according to corresponding internationally agreed criteria: Petersen's criteria for aMCI (Petersen & Morris, 2005), NINCDS-ADRDA criteria for probable Alzheimer's disease (McKhann et al., 1984) and Neary et al. criteria for SD (Neary et al., 1998).”
§ Hippocampal subfield volumetry in mild cognitive impairment, Alzheimer's disease and semantic dementia☆ > Material and methods > Participants
What the sources say
plain- Asserted: passes — The authors put it forward as true.
- Checkable: passes — It can be checked against evidence.
- Load-bearing: passes — The paper’s conclusions depend on it.
- Based: passes — The paper gives a reason why it holds.
It may state two separate claims as one.
A conclusion the paper draws from its own results — it cites no other source for it, so there is none to check. The quote shows it is in the paper.
In the paper
“By contrast, at the aMCI stage, CA1 volume loss predominated and was found to better discriminate aMCI patients from HC than global hippocampal volume.”
§ Hippocampal subfield volumetry in mild cognitive impairment, Alzheimer's disease and semantic dementia☆ > Discussion
plaincorrelational- Asserted: passes — The authors put it forward as true.
- Checkable: passes — It can be checked against evidence.
- Load-bearing: passes — The paper’s conclusions depend on it.
- Based: passes — The paper gives a reason why it holds.
It may state two separate claims as one.
None of the sources cited for this claim have been checked yet.
In the paper
“Hippocampal volume has thus been proposed as a neuroimaging biomarker for early AD diagnosis (Albert et al., 2011; Dubois et al., 2010).”
§ Hippocampal subfield volumetry in mild cognitive impairment, Alzheimer's disease and semantic dementia☆ > Introduction
What the sources say
plain- Asserted: passes — The authors put it forward as true.
- Checkable: passes — It can be checked against evidence.
- Load-bearing: passes — The paper’s conclusions depend on it.
- Based: passes — The paper gives a reason why it holds.
Probably not a substantial claim.
A conclusion the paper draws from its own results — it cites no other source for it, so there is none to check. The quote shows it is in the paper.
In the paper
“This pattern was not discriminant at the dementia stage as i) no differences were found between AD and SD and ii) hippocampal subfields did not perform better than the whole hippocampus in discriminating AD from HC.”
§ Hippocampal subfield volumetry in mild cognitive impairment, Alzheimer's disease and semantic dementia☆ > Discussion
plain- Asserted: passes — The authors put it forward as true.
- Checkable: passes — It can be checked against evidence.
- Load-bearing: passes — The paper’s conclusions depend on it.
- Based: passes — The paper gives a reason why it holds.
It may state two separate claims as one.
What the paper did — it cites no source for this, so there is none to check. The quote shows it is in the paper.
In the paper
“Note that the main results were unchanged when performing comparisons on raw volumes or TIV-normalized volumes instead of age- and gender-adjusted W-scores as presented here (see Supplementary Fig. 2).”
§ Hippocampal subfield volumetry in mild cognitive impairment, Alzheimer's disease and semantic dementia☆ > Results > Atrophy of hippocampal subfields in patients
plain- Asserted: passes — The authors put it forward as true.
- Checkable: passes — It can be checked against evidence.
- Load-bearing: fails — The paper’s conclusions may not depend on it.
- Based: passes — The paper gives a reason why it holds.
Probably not a substantial claim. The paper’s conclusions may not depend on it.
What the paper did — it cites no source for this, so there is none to check. The quote shows it is in the paper.
In the paper
“All the results remained unchanged when using W-scores instead of TIV-normalized volumes (data not shown).”
§ Hippocampal subfield volumetry in mild cognitive impairment, Alzheimer's disease and semantic dementia☆ > Results > Volume of hippocampal subfields versus neocortical amyloid load in aMCI patients
plain- Asserted: passes — The authors put it forward as true.
- Checkable: passes — It can be checked against evidence.
- Load-bearing: fails — The paper’s conclusions may not depend on it.
- Based: passes — The paper gives a reason why it holds.
Probably not a substantial claim. The paper’s conclusions may not depend on it.
What the paper did — it cites no source for this, so there is none to check. The quote shows it is in the paper.
In the paper
“The 83 participants included in the present study had high quality data.”
§ Hippocampal subfield volumetry in mild cognitive impairment, Alzheimer's disease and semantic dementia☆ > Material and methods > Neuroimaging data processing
plaindirectn = 83- Asserted: passes — The authors put it forward as true.
- Checkable: passes — It can be checked against evidence.
- Load-bearing: passes — The paper’s conclusions depend on it.
- Based: passes — The paper gives a reason why it holds.
It may state two separate claims as one.
What the paper did — it cites no source for this, so there is none to check. The quote shows it is in the paper.
In the paper
“It should also be noted that subfield volumetry as performed in the present study only provides approximations of the exact volumes of the hippocampal subfields, based on anatomical landmarks derived from histological atlases”
§ Hippocampal subfield volumetry in mild cognitive impairment, Alzheimer's disease and semantic dementia☆ > Discussion > Relationships between hippocampal subfield atrophy and Aβ in aMCI
plain- Asserted: passes — The authors put it forward as true.
- Checkable: passes — It can be checked against evidence.
- Load-bearing: fails — The paper’s conclusions may not depend on it.
- Based: passes — The paper gives a reason why it holds.
Probably not a substantial claim. The paper’s conclusions may not depend on it.
In the paper
“Despite this variability, a severe neuronal loss in the CA1 subfield together with a preservation of neurons in the dentate gyrus, consistent with our imaging findings, was reported independently of the histopathological subtypes (Davies et al., 2005).”
§ Hippocampal subfield volumetry in mild cognitive impairment, Alzheimer's disease and semantic dementia☆ > Discussion > Comparison of the pattern of hippocampal atrophy in AD versus SD
What the sources say
- Not checked yetcites Davies et al., 2005 source
plaincorrelational- Asserted: passes — The authors put it forward as true.
- Checkable: passes — It can be checked against evidence.
- Load-bearing: unclear — It is unclear whether the paper’s conclusions depend on it.
- Based: passes — The paper gives a reason why it holds.
It may state two separate claims as one.
What the paper did — it cites no source for this, so there is none to check. The quote shows it is in the paper.
In the paper
“HC were recruited from the community and performed in the normal range on a neuropsychological examination assessing multiple domains of cognition including episodic and semantic memory, executive and visuo-spatial functions, language and praxis.”
§ Hippocampal subfield volumetry in mild cognitive impairment, Alzheimer's disease and semantic dementia☆ > Material and methods > Participants
plainn = 40- Asserted: passes — The authors put it forward as true.
- Checkable: passes — It can be checked against evidence.
- Load-bearing: passes — The paper’s conclusions depend on it.
- Based: passes — The paper gives a reason why it holds.
Probably not a substantial claim.
In the paper
“Yet, the pathological substrate of hippocampal atrophy in SD is not clear, notably because patients with SD can present with heterogeneous pathological features (Davies et al., 2005).”
§ Hippocampal subfield volumetry in mild cognitive impairment, Alzheimer's disease and semantic dementia☆ > Discussion > Comparison of the pattern of hippocampal atrophy in AD versus SD
What the sources say
- Not checked yetcites Davies et al., 2005 source
plain- Asserted: passes — The authors put it forward as true.
- Checkable: passes — It can be checked against evidence.
- Load-bearing: unclear — It is unclear whether the paper’s conclusions depend on it.
- Based: passes — The paper gives a reason why it holds.
It may state two separate claims as one.
What the paper did — it cites no source for this, so there is none to check. The quote shows it is in the paper.
In the paper
“The IMAP Study was approved by regional ethics committee (Comité de Protection des Personnes Nord-Ouest III) and is registered with ClinicalTrials.gov (number NCT01638949).”
§ Hippocampal subfield volumetry in mild cognitive impairment, Alzheimer's disease and semantic dementia☆ > Material and methods > Participants
plain- Asserted: passes — The authors put it forward as true.
- Checkable: passes — It can be checked against evidence.
- Load-bearing: fails — The paper’s conclusions may not depend on it.
- Based: passes — The paper gives a reason why it holds.
Probably not a substantial claim. The paper’s conclusions may not depend on it. It may state two separate claims as one.
What the paper did — it cites no source for this, so there is none to check. The quote shows it is in the paper.
In the paper
“Delineations were performed on slices perpendicular to the long axis of the hippocampus by a single rater, blind to the identity (age, gender, clinical status) of the participants.”
§ Hippocampal subfield volumetry in mild cognitive impairment, Alzheimer's disease and semantic dementia☆ > Material and methods > Neuroimaging data processing
plain- Asserted: passes — The authors put it forward as true.
- Checkable: passes — It can be checked against evidence.
- Load-bearing: passes — The paper’s conclusions depend on it.
- Based: passes — The paper gives a reason why it holds.
Probably not a substantial claim.
None of the sources cited for this claim have been checked yet.
In the paper
“However, discrepancies exist as regards to the area of largest difference between HC and aMCI patients (CA1 (Pluta et al., 2012), CA1–CA2 transition area (Mueller et al., 2010) or subiculum (Hanseeuw, 2011), probably reflecting variations in the anatomical landmarks used for subfield delineation”
§ Hippocampal subfield volumetry in mild cognitive impairment, Alzheimer's disease and semantic dementia☆ > Discussion > Hippocampal subfield atrophy in AD
What the sources say
hedgedconditional- Asserted: passes — The authors put it forward as true.
- Checkable: passes — It can be checked against evidence.
- Load-bearing: unclear — It is unclear whether the paper’s conclusions depend on it.
- Based: passes — The paper gives a reason why it holds.
It may state two separate claims as one.
In the paper
“Raw volumes of each hippocampal subfield and of the whole hippocampus (corresponding to the sum of the three subfields) were first normalized by the TIV to account for inter-individual variability in head size (normalized volume = 1000 × raw volume / TIV) and then transformed into W-scores, i.e. age and gender-adjusted Z-scores (Jack et al., 2002).”
§ Hippocampal subfield volumetry in mild cognitive impairment, Alzheimer's disease and semantic dementia☆ > Material and methods > Statistical analyses
What the sources say
- Not checked yetcites Jack et al., 2002 source
plain- Asserted: passes — The authors put it forward as true.
- Checkable: passes — It can be checked against evidence.
- Load-bearing: passes — The paper’s conclusions depend on it.
- Based: passes — The paper gives a reason why it holds.
Probably not a substantial claim. It may state two separate claims as one.
In the paper
“hippocampal atrophy has been shown to induce PCC hypometabolism through a disconnection process in AD (Villain et al., 2008).”
§ Hippocampal subfield volumetry in mild cognitive impairment, Alzheimer's disease and semantic dementia☆ > Discussion > Comparison of the pattern of hippocampal atrophy in AD versus SD
What the sources say
- Not checked yetcites Villain et al., 2008 source
plaindirect- Asserted: passes — The authors put it forward as true.
- Checkable: passes — It can be checked against evidence.
- Load-bearing: fails — The paper’s conclusions may not depend on it.
- Based: passes — The paper gives a reason why it holds.
Probably not a substantial claim. The paper’s conclusions may not depend on it.
In the paper
“Besides, the connectivity of the hippocampus varies along its anterior–posterior axis, with the posterior part being more strongly connected to the PCC (Poppenk et al., 2013).”
§ Hippocampal subfield volumetry in mild cognitive impairment, Alzheimer's disease and semantic dementia☆ > Discussion > Comparison of the pattern of hippocampal atrophy in AD versus SD
What the sources say
- Not checked yetcites Poppenk et al., 2013 source
plaincorrelational- Asserted: passes — The authors put it forward as true.
- Checkable: passes — It can be checked against evidence.
- Load-bearing: passes — The paper’s conclusions depend on it.
- Based: passes — The paper gives a reason why it holds.
It may state two separate claims as one.
What the paper did — it cites no source for this, so there is none to check. The quote shows it is in the paper.
In the paper
“All participants gave written informed consent to the study prior to the investigation.”
§ Hippocampal subfield volumetry in mild cognitive impairment, Alzheimer's disease and semantic dementia☆ > Material and methods > Participants
plain- Asserted: passes — The authors put it forward as true.
- Checkable: passes — It can be checked against evidence.
- Load-bearing: fails — The paper’s conclusions may not depend on it.
- Based: passes — The paper gives a reason why it holds.
Probably not a substantial claim. The paper’s conclusions may not depend on it.
None of the sources cited for this claim have been checked yet.
In the paper
“The higher vulnerability of CA1 neurons is likely to be at least partly due to the neurofibrillary pathology as the CA1 subfield is the first hippocampal area to be affected by NFT (Braak & Braak, 1991; Schönheit et al., 2004).”
§ Hippocampal subfield volumetry in mild cognitive impairment, Alzheimer's disease and semantic dementia☆ > Discussion > Hippocampal subfield atrophy in AD
What the sources say
hedgedconditional- Asserted: passes — The authors put it forward as true.
- Checkable: passes — It can be checked against evidence.
- Load-bearing: unclear — It is unclear whether the paper’s conclusions depend on it.
- Based: passes — The paper gives a reason why it holds.
It may state two separate claims as one.
What the paper did — it cites no source for this, so there is none to check. The quote shows it is in the paper.
In the paper
“Aβ-positive and Aβ-negative aMCI did not differ in age, gender or education (all p-values > 0.8).”
§ Hippocampal subfield volumetry in mild cognitive impairment, Alzheimer's disease and semantic dementia☆ > Material and methods > Statistical analyses
plainn = 15- Asserted: passes — The authors put it forward as true.
- Checkable: passes — It can be checked against evidence.
- Load-bearing: unclear — It is unclear whether the paper’s conclusions depend on it.
- Based: passes — The paper gives a reason why it holds.
It may state two separate claims as one.
In the paper
“This would rather support hypotheses suggesting that tau pathology could occur independently from Aβ accumulation (Small, 2008), than the amyloid hypothesis where tau-related neurodegeneration is supposed to appear downstream to Aβ.”
§ Hippocampal subfield volumetry in mild cognitive impairment, Alzheimer's disease and semantic dementia☆ > Discussion > Relationships between hippocampal subfield atrophy and Aβ in aMCI
What the sources say
- Not checked yetcites Small, 2008 source
hedgedconditional- Asserted: passes — The authors put it forward as true.
- Checkable: passes — It can be checked against evidence.
- Load-bearing: passes — The paper’s conclusions depend on it.
- Based: passes — The paper gives a reason why it holds.
It may state two separate claims as one.
None of the sources cited for this claim have been checked yet.
In the paper
“Because the presence of Aβ deposition significantly increases the likelihood of having AD pathology in patients with aMCI according to current diagnosis recommendations (Albert et al., 2011; Dubois et al., 2010)”
§ Hippocampal subfield volumetry in mild cognitive impairment, Alzheimer's disease and semantic dementia☆ > Discussion > Relationships between hippocampal subfield atrophy and Aβ in aMCI
What the sources say
boosteddirect- Asserted: passes — The authors put it forward as true.
- Checkable: passes — It can be checked against evidence.
- Load-bearing: passes — The paper’s conclusions depend on it.
- Based: passes — The paper gives a reason why it holds.
Probably not a substantial claim.
What the paper did — it cites no source for this, so there is none to check. The quote shows it is in the paper.
In the paper
“However, these findings should be considered as preliminary given the small size of the aMCI samples when dichotomized in Aβ-positive and Aβ-negative.”
§ Hippocampal subfield volumetry in mild cognitive impairment, Alzheimer's disease and semantic dementia☆ > Discussion > Relationships between hippocampal subfield atrophy and Aβ in aMCI
plain- Asserted: passes — The authors put it forward as true.
- Checkable: passes — It can be checked against evidence.
- Load-bearing: passes — The paper’s conclusions depend on it.
- Based: passes — The paper gives a reason why it holds.
Probably not a substantial claim.
A conclusion the paper draws from its own results — it cites no other source for it, so there is none to check. The quote shows it is in the paper.
In the paper
“Overall, our findings in AD and SD are consistent with the topography of neuronal loss described in post-mortem studies as well as with previous imaging studies that used different methods.”
§ Hippocampal subfield volumetry in mild cognitive impairment, Alzheimer's disease and semantic dementia☆ > Discussion > Conclusion
plaincorrelational- Asserted: passes — The authors put it forward as true.
- Checkable: passes — It can be checked against evidence.
- Load-bearing: passes — The paper’s conclusions depend on it.
- Based: passes — The paper gives a reason why it holds.
It may state two separate claims as one.
None of the sources cited for this claim have been checked yet.
In the paper
“Moreover, several studies have reported a strong negative correlation between neuronal counts and NFT number in the CA1 subfield (Fukutani et al., 2000; Von Gunten et al., 2006) suggesting that the progression of brain atrophy and the progression of NFT are strongly associated (Whitwell et al., 2008).”
§ Hippocampal subfield volumetry in mild cognitive impairment, Alzheimer's disease and semantic dementia☆ > Discussion > Hippocampal subfield atrophy in AD
What the sources say
hedgedcorrelational- Asserted: passes — The authors put it forward as true.
- Checkable: passes — It can be checked against evidence.
- Load-bearing: unclear — It is unclear whether the paper’s conclusions depend on it.
- Based: passes — The paper gives a reason why it holds.
It may state two separate claims as one.
What the paper did — it cites no source for this, so there is none to check. The quote shows it is in the paper.
In the paper
“Although the absence of significant difference could be due to a lack of statistical power”
§ Hippocampal subfield volumetry in mild cognitive impairment, Alzheimer's disease and semantic dementia☆ > Discussion > Comparison of the pattern of hippocampal atrophy in AD versus SD
hedgedconditional- Asserted: passes — The authors put it forward as true.
- Checkable: passes — It can be checked against evidence.
- Load-bearing: fails — The paper’s conclusions may not depend on it.
- Based: passes — The paper gives a reason why it holds.
Probably not a substantial claim. The paper’s conclusions may not depend on it.
The paper relies on this without support.
Healthy controls are free of preclinical Alzheimer's disease pathology.
“HC were recruited from the community and performed in the normal range on a neuropsychological examination assessing multiple domains of cognition including episodic and semantic memory, executive and visuo-spatial functions, language and praxis.”
Claims other papers make about this one
Each is checked against this paper’s own text: does it say what the citing paper says it does?
In the citing paper
“In contrast to 5xFAD, other FAD mouse models show clear intraneuronal Aβ accumulation and neuronal loss in the CA1 region [7, 16, 88], which has also been shown to be one of the earliest and more affected brain regions in AD patients [4, 27, 68, 82].”
From Senescence-related impairment of autophagy induces toxic intraneuronal amyloid-β accumulation in a mouse model of amyloid pathology (2023) · cites this paper as [68]
In the citing paper
“Analogous literature on individuals with MCI is still more controversial, with discrepant data resulting from adoption of the same subfield segmentation procedure.”
From Atrophy of presubiculum and subiculum is the earliest hippocampal anatomical marker of Alzheimer's disease (2015) · cites this paper as [39]
In the citing paper
“Thus, for example, the volume of the subiculum was reported to be normal in MCI in a study that relied on manual segmentation [35] and in another study that used an automated segmentation method [38] but was significantly reduced in two other studies that also used a method of manual [39] or automated segmentation [40].”
From Atrophy of presubiculum and subiculum is the earliest hippocampal anatomical marker of Alzheimer's disease (2015) · cites this paper as [39]
Citations
Cites
McKhann, G., Drachman, D., Folstein, M., Katzman, R., Price, D., & Stadlan, E. M. (1984) · Neurology · doi:10.1212/wnl.34.7.939 · Cited by 27,915
McKhann, G. M., Knopman, D. S., Chertkow, H., Hyman, B. T., Jack, C. R., Kawas, C. H., Klunk, W. E., Koroshetz, W. J., Manly, J. J., Mayeux, R., et al. (2011) · Alzheimer's & Dementia · doi:10.1016/j.jalz.2011.03.005 · Cited by 18,657
Neuropathological stageing of Alzheimer-related changes.
Braak, H., & Braak, E. (1991) · Acta Neuropathologica · doi:10.1007/bf00308809 · Cited by 16,123 · cited 8×
“Interestingly, neuropathological studies have shown a differential vulnerability of hippocampal subfields to AD, with CA1 showing the earliest and strongest changes in terms of both neurofibrillary tangles (NFT) (Braak & Braak, 1991; Schönheit et al., 2004) and neuronal loss (Rössler et al., 2002; West et al., 1994).”
InfluentialAlbert, M. S., DeKosky, S. T., Dickson, D., Dubois, B., Feldman, H. H., Fox, N. C., Gamst, A., Holtzman, D. M., Jagust, W. J., Petersen, R. C., et al. (2011) · Alzheimer's & Dementia · doi:10.1016/j.jalz.2011.03.008 · Cited by 10,152 · cited 7×
“Hippocampal volume has thus been proposed as a neuroimaging biomarker for early AD diagnosis (Albert et al., 2011; Dubois et al., 2010).”
InfluentialFrontotemporal lobar degeneration: A consensus on clinical diagnostic criteria
Neary, D., Snowden, J. S., Gustafson, L., Passant, U., Stuss, D., Black, S., Freedman, M., Kertesz, A., Robert, P. H., Albert, M., et al. (1998) · Neurology · doi:10.1212/wnl.51.6.1546 · Cited by 5,047
Jack, C. R., Knopman, D. S., Jagust, W. J., Petersen, R. C., Weiner, M. W., Aisen, P. S., Shaw, L. M., Vemuri, P., Wiste, H. J., Weigand, S. D., et al. (2013) · The Lancet Neurology · doi:10.1016/s1474-4422(12)70291-0 · Cited by 4,396
Weıntraub, S. (1990) · Archives of Neurology · doi:10.1001/archneur.1990.00530120075013 · Cited by 3,018
The clinical use of structural MRI in Alzheimer disease
Frisoni, G. B., Fox, N. C., Jack, C. R., Scheltens, P., & Thompson, P. M. (2010) · Nature Reviews Neurology · doi:10.1038/nrneurol.2009.215 · Cited by 2,113
Revising the definition of Alzheimer's disease: a new lexicon
Dubois, B., Feldman, H. H., Jacova, C., Cummings, J. L., DeKosky, S. T., Barberger-Gateau, P., Delacourte, A., Frisoni, G., Fox, N. C., Galasko, D., et al. (2010) · The Lancet Neurology · doi:10.1016/s1474-4422(10)70223-4 · Cited by 1,869
Two cortical systems for memory-guided behaviour
Ranganath, C., & Ritchey, M. (2012) · Nature Reviews Neuroscience · doi:10.1038/nrn3338 · Cited by 1,377
Cited by
Sorted by citations
Items 201–289 of 289
Touron, E., de Florès, R., Coulbault, L., Palix, C., Chocat, A., Kuhn, E., Landeau, B., Mézenge, F., Roquet, D., Chauveau, L., et al. (2025) · Alzheimer s Research & Therapy · doi:10.1186/s13195-024-01643-0 · Cited by 5
Self-citationNeuroimaging Findings in Mild Cognitive Impairment
Nobili, F. M., Arnaldi, D., Roccatagliata, L., Chincarini, A., Accardo, J., Picco, A., Ferrara, M., Buschiazzo, A., & Morbelli, S. D. (2014) · Springer eBooks · doi:10.1007/978-3-642-54307-4_12 · Cited by 5
Lara, H. H., Alanís-Garza, E. J., Puente, M. F. E., Mureyko, L., Torres, D. A. A., & Ixtepan-Turrent, L. (2015) · PubMed · Cited by 5
Pan, C., Zhao, E., Ren, J., Zhou, G., Wang, Y., Zhang, R., Shen, Y., Liu, W., & Chen, J. (2025) · Frontiers in Aging Neuroscience · doi:10.3389/fnagi.2025.1685244 · Cited by 3
The possibilities of differential diagnosis of primary progressive aphasia
Medvedeva, A. V., & Гришина, Д. А. (2022) · S S Korsakov Journal of Neurology and Psychiatry · doi:10.17116/jnevro2022122091121 · Cited by 4
Hippocampal Subregions Volume and Texture for the Diagnosis of Mild Cognitive Impairment
Chu, T., Liu, Y., Gui, B., Zhang, Z., Zhang, G., Dong, F., Dong, J., & Lin, S. (2024) · Experimental Aging Research · doi:10.1080/0361073x.2024.2313940 · Cited by 4
Um, Y. H., Kim, T., Jeong, J., Seo, H., Han, J., Hong, S., Lee, C., & Lim, H. K. (2017) · Psychiatry Investigation · doi:10.4306/pi.2017.14.5.698 · Cited by 4
Neuroimaging Findings in Mild Cognitive Impairment
Massa, F., Bauckneht, M., Peira, E., Lapucci, C., Picco, A., Capitanio, S., Arnaldi, D., Roccatagliata, L., Chincarini, A., & Nobili, F. M. (2020) · Springer eBooks · doi:10.1007/978-3-030-53168-3_12 · Cited by 4
Kobayashi, R., Hayashi, H., Kawakatsu, S., Shibuya, Y., Morioka, D., Ohba, M., Yoshioka, M., Sakamoto, K., Kanoto, M., & Otani, K. (2022) · Current Alzheimer Research · doi:10.2174/1567205019666220820145429 · Cited by 4
Wu, J., Dong, Q., Gui, J., Zhang, J., Su, Y., Chen, K., Thompson, P. M., Caselli, R. J., Reiman, E. M., Ye, J., et al. (2020) · bioRxiv (Cold Spring Harbor Laboratory) · doi:10.1101/2020.10.16.343137 · Cited by 5
Longitudinal surface-based morphometry changes in the hippocampus in dementia
Aziz, S., Penheiro, R., Morrison, C., Zhukovsky, P., Anderson, J. A. E., & (ADNI), T. A. D. N. I. (2026) · Neuropsychologia · doi:10.1016/j.neuropsychologia.2026.109470 · Cited by 3
Simone, M. S. D., Bonarota, S., Serra, L., Rodini, M., Caruso, G., Giove, F., Caltagirone, C., & Carlesimo, G. A. (2025) · Cortex · doi:10.1016/j.cortex.2025.09.009 · Cited by 3
Pusparani, Y., Lin, C.-Y., Jan, Y., Liau, B.-Y., Lin, F., Furqon, E. N., Talal, M., Pravin, S. C., Tsai, Z.-R., & Lung, C.-W. (2026) · Scientific Reports · doi:10.1038/s41598-026-38220-4 · Cited by 3
The Effect of Segmentation Method on Medial Temporal Lobe Subregion Volumes in Aging
Mazloum‐Farzaghi, N., Barense, M. D., Ryan, J. D., Stark, C. E. L., & Olsen, R. K. (2024) · Human Brain Mapping · doi:10.1002/hbm.70054 · Cited by 5
Voxel‐Based Morphometry and Subfield Volumetry Analysis Reveal Limbic System Involvement in Tinnitus
Lee, S., Pyun, S., Sim, Y., Um, S., Tae, W., & Nam, E. (2025) · Journal of Neuroimaging · doi:10.1111/jon.70008 · Cited by 3
Defrancesco, M., Marksteiner, J., Lenhart, L., Klingler, P. J., Steiger, R., Gizewski, E. R., Goebel, G., Deisenhammer, E., & Scherfler, C. (2024) · Progress in Neuro-Psychopharmacology and Biological Psychiatry · doi:10.1016/j.pnpbp.2024.111157 · Cited by 3
Liang, S., Huang, L., Zhu, J., Lin, M., Yang, M., Gao, J., Ma, C., Yin, X., Yang, J., Yang, L., et al. (2025) · Asian Journal of Psychiatry · doi:10.1016/j.ajp.2025.104683 · Cited by 2
Li, D., He, J., Liu, B., Zhu, L., Yang, Y., Peng, Y., Nie, L., & Wang, R. P. (2026) · NeuroImage · doi:10.1016/j.neuroimage.2026.121900 · Cited by 2
Liu, M., Han, T., Wu, Y., Cheng, J., Zhang, L. J., Zhang, B., Zuo, X., Zhu, W., Qiu, S., Geng, Z., et al. (2023) · Environment International · doi:10.1016/j.envint.2023.107905 · Cited by 2
Salman, Y., Huyghe, L., Quenon, L., Ghysens, O., Malotaux, V., Tomé, S. O., Thal, D. R., & Hanseeuw, B. J. (2025) · Journal of Alzheimer s Disease · doi:10.1177/13872877251314199 · Cited by 2
Luo, Y., Cao, Z., Liu, Y., Wu, L., Shan, H., Liu, Y., Ma, T., Zhu, X., Zhou, D., Jiang, B., et al. (2015) · International Journal of Neuroscience · doi:10.3109/00207454.2015.1083018 · Cited by 2
Felisatti, F., Chauveau, L., Marchant, N. L., Collette, F., Demnitz‐King, H., Whitfield, T. J., Requier, F., Mézenge, F., Landeau, B., Palix, C., et al. (2023) · medRxiv · doi:10.1101/2023.07.17.23292755 · Cited by 2
Self-citationEarly-Onset Frontotemporal Dementia-Related Semantic Variant of Primary Progressive Aphasia
Tsiouris, S., Bougias, H., Konitsiotis, S., Papadopoulos, A., & FOTOPOULOS, A. D. (2021) · Clinical Nuclear Medicine · doi:10.1097/rlu.0000000000003934 · Cited by 3
Lee, A., Lah, S. S., Joplin, S., Haroutonian, C., Pye, J., Mowszowski, L., Duffy, S. L., & Naismith, S. L. (2020) · Aging Neuropsychology and Cognition · doi:10.1080/13825585.2020.1842849 · Cited by 2
Liu, M., Hu, L., Tsai, C.-F., Hong, C., Chou, Y.-H., Chang, C., Yang, K., You, Z.-H., & Lau, C. I. (2023) · Brain Sciences · doi:10.3390/brainsci13111582 · Cited by 1
Elmaaty, A. A. A., Eissa, M. A., El-Rashedy, S. K., Zehry, H. I., Mosa, A. A. H., Zarad, C. A., Abdel-Dayem, M. A., Nokrashy, A. E., & Elsherifi, S. S. (2024) · The Egyptian Journal of Neurology Psychiatry and Neurosurgery · doi:10.1186/s41983-024-00912-x · Cited by 1
Wu, Y., Dong, Y., & Wu, Y. (2026) · Expert Systems with Applications · doi:10.1016/j.eswa.2025.131003 · Cited by 1
Homayouni, R., Saifullah, S., Sutton, B. P., & Daugherty, A. M. (2026) · Hippocampus · doi:10.1002/hipo.70082 · Cited by 1
de Florès, R., Joie, R. L., Landeau, B., Perrotin, A., Mézenge, F., Sayette, V. D. L., Eustache, F., Desgranges, B., & Chételat, G. (2014) · Alzheimer s & Dementia · doi:10.1016/j.jalz.2014.05.098 · Cited by 1
Self-citationSemantic Segmentation of Hippocampal Subregions With U-Net Architecture
Nasser, S., Naoui, M., Belalem, G., & Mahmoudi, S. (2021) · International Journal of E-Health and Medical Communications · doi:10.4018/ijehmc.20211101.oa4 · Cited by 1
Balajoo, S. M., Plachti, A., Nicolaisen‐Sobesky, E., Dong, D., Hoffstaedter, F., Meuth, S. G., Melzer, N., Eickhoff, S. B., & Genon, S. (2024) · Human Brain Mapping · doi:10.1002/hbm.70099 · Cited by 1
Building a high-resolution in vivo minimum deformation average model of the human hippocampusPreprint
Jacobsen, N., Munk, J. B., Plocharski, M., Østergaard, L. R., Marstaller, L., Reutens, D. C., Barth, M., Janke, A. L., & Bollmann, S. (2017) · bioRxiv (Cold Spring Harbor Laboratory) · doi:10.1101/160176 · Cited by 1
Evaluation of a cognitive and a morphometric marker for the early detection of Alzheimer's disease
Kälin, A. M. (2015) · Zurich Open Repository and Archive (University of Zurich) · doi:10.5167/uzh-117647 · Cited by 1
Yeung, L., & Brickman, A. M. (2020) · The Wiley Encyclopedia of Health Psychology · doi:10.1002/9781119057840.ch12 · Cited by 1
Piersson, A. D., Mohamad, M., Suppiah, S., & Rajab, N. F. (2021) · medRxiv · doi:10.1101/2021.01.20.21250005 · Cited by 1
Concomitant AD and DLB pathologies shape subfield microglia responses in the hippocampusPreprint
Fixemer, S., Ameli, C., Hammer, G. P., Salamanca, L., Huarte, O. U., Schwartz, C., Gérardy, J., Mechawar, N., Skupin, A., Mittelbronn, M. G. A., et al. (2022) · bioRxiv (Cold Spring Harbor Laboratory) · doi:10.1101/2022.01.06.475218 · Cited by 1
Rich, A., Oh, H., & Initiative, A. D. N. (2025) · bioRxiv (Cold Spring Harbor Laboratory) · doi:10.1101/2025.01.27.635113 · Cited by 1
Tucker, H., Karat, B. G., Ruiter, A. D., Parker, D. M., Lim, S., Denning, A., Ittyerah, R., Levorse, L. M., Trotman, W., Bahena, A., et al. (2025) · bioRxiv (Cold Spring Harbor Laboratory) · doi:10.1101/2025.11.21.689744 · Cited by 1
Tomadesso, C., Perrotin, A., Mézenge, F., Landeau, B., Egret, S., Sayette, V. D. L., Eustache, F., Desgranges, B., & Chételat, G. (2014) · Alzheimer s & Dementia · doi:10.1016/j.jalz.2014.05.163
Self-citationHow does neuroprotective sAPPα initiate its signalling cascade
Prendergast, J. R. (2016) · Otago University Research Archive (University of Otago)
Cognitive Correlates of Anterolateral Entorhinal Cortex Volume Differences in Older Adults
Yeung, L. (2017) · TSpace (University of Toronto)
A Diffeomorphic Vector Field Approach to Analyze the Thickness of the Hippocampus From 7 T MRI
Guyot, A., Fouquier, A. B. G., Gérardin, E., Marie Chupin, A., Glaunès, J., Marrakchi‐Kacem, L., Germain, J., Boutet, C., Cury, C., Hertz‐Pannier, L., et al. (2020) · IEEE Transactions on Biomedical Engineering · doi:10.1109/tbme.2020.2999941
Chapitre 2. La mémoire humaine et ses substrats cérébraux
Eustache, F., & Viard, A. (2021) · EDP Sciences eBooks · doi:10.1051/978-2-7598-2612-4.c005
Self-citationGonzález-Marrero, I., Hernandez-Garcia, J. A., González‐Dávila, E., Carmona-Calero, E. M., González-Toledo, J. M., Castañeyra-Ruiz, L., Hernández-Abad, L. G., & Castañeyra-Perdomo, A. (2021) · Neurología · doi:10.1016/j.nrl.2021.04.017 · Cited by 1
González-Marrero, I., Hernandez-Garcia, J. A., González‐Dávila, E., Carmona-Calero, E. M., González-Toledo, J. M., Catañeyra-Ruiz, L., Abad, L. G. H., & Castañeyra-Perdomo, A. (2023) · Neurología (English Edition) · doi:10.1016/j.nrleng.2023.07.007
Imam, I. (2021) · CRC Press eBooks · doi:10.1201/9781003221258-6
Bertoux, M., O’Callaghan, C., Flanagan, E. C., & Hornberger, M. (2017) · Springer eBooks · doi:10.1007/978-981-287-082-7_311 · Cited by 1
Chang, W., Langella, S., Tang, Y., Ahmad, S., Zhang, H., Yap, P., Giovanello, K. S., & Lin, W. (2020) · Research Square · doi:10.21203/rs.3.rs-129412/v1
Lever, C., & Poulter, S. L. (2020) · Faculty Opinions – Post-Publication Peer Review of the Biomedical Literature · doi:10.3410/f.733246270.793571962
Les signatures neurobiologiques de la conscience
Sciences, A. E. I. D. (2021) · EDP Sciences eBooks · doi:10.1051/978-2-7598-2612-4
Biomarkers based on neuroimages to diagnose neurodegenerative diseases
Reyes, P. A. (2020) · Repositorio Institucional (Pontificia Universidad Javeriana) · doi:10.11144/javeriana.10554.44894
Torralbo, L. (2022) · Digital Library of Theses and Dissertations (Universidade de São Paulo) · doi:10.11606/d.5.2022.tde-28042022-120552
Hippocampal Subregions Volume and Texture for the Diagnosis of Mild Cognitive ImpairmentPreprint
Chu, T., Liu, Y., Zhang, Z., Zhang, G., Dong, F., Dong, J., & Lin, S. (2022) · Research Square · doi:10.21203/rs.3.rs-2182063/v1
Hippocampal Subregions Volume and Texture for the Diagnosis of Mild Cognitive ImpairmentPreprint
Chu, T., Liu, Y., Zhang, Z., Zhang, G., Dong, F., Dong, J., & Lin, S. (2023) · Research Square · doi:10.21203/rs.3.rs-2182063/v2
Memory in Frontotemporal Dementia
Keret, O., Lindbergh, C. A., & Miller, B. L. (2024) · Oxford University Press eBooks · doi:10.1093/oxfordhb/9780190917982.013.60
Convolutional Neural Networks for the segmentation of hippocampal structures in postmortem MRI scans
Anoop, B. N., Li, K., Honnorat, N., Rashid, T., Wang, D., Li, J., Fadaee, E., Charisis, S., Walker, J. M., Richardson, T. E., et al. (2025) · Journal of Neuroscience Methods · doi:10.1016/j.jneumeth.2024.110359
Rich, A., Oh, H., & Initiative, A. D. N. (2025) · Journal of Alzheimer s Disease · doi:10.1177/13872877251361354 · Cited by 1
Zhang, L. M. (2025) · Procedia Computer Science · doi:10.1016/j.procs.2025.07.143
Bezdíček, O., Motýl, J., Nikolai, T., Mazancová, A. F., Hort, J., Jech, R., Vyhnálek, M., & Horáková, H. (2025) · Journal of Neuropsychology · doi:10.1111/jnp.70010
Hippocampal subfield-specific alterations in post-stroke dementia with subcortical lesion
Xu, G., Lin, B., Jiang, Y., Ming, J., Ni, L., Han, G., Zhao, Z., Cai, H., & Gao, L. (2025) · Brain Imaging and Behavior · doi:10.1007/s11682-025-01034-5 · Cited by 1
Fixemer, S., Ameli, C., Hammer, G. P., Salamanca, L., Huarte, O. U., Schwartz, C., Gérardy, J.-J., Mechawar, N., Skupin, A., Mittelbronn, M., et al. (2022) · Figshare · doi:10.6084/m9.figshare.19373331
Fixemer, S., Ameli, C., Hammer, G. P., Salamanca, L., Huarte, O. U., Schwartz, C., Gérardy, J.-J., Mechawar, N., Skupin, A., Mittelbronn, M., et al. (2022) · Figshare · doi:10.6084/m9.figshare.19373346
Fixemer, S., Ameli, C., Hammer, G. P., Salamanca, L., Huarte, O. U., Schwartz, C., Gérardy, J.-J., Mechawar, N., Skupin, A., Mittelbronn, M., et al. (2022) · Figshare · doi:10.6084/m9.figshare.19373328
Fixemer, S., Ameli, C., Hammer, G. P., Salamanca, L., Huarte, O. U., Schwartz, C., Gérardy, J.-J., Mechawar, N., Skupin, A., Mittelbronn, M., et al. (2022) · Figshare · doi:10.6084/m9.figshare.19373352
Fixemer, S., Ameli, C., Hammer, G. P., Salamanca, L., Huarte, O. U., Schwartz, C., Gérardy, J.-J., Mechawar, N., Skupin, A., Mittelbronn, M., et al. (2022) · Figshare · doi:10.6084/m9.figshare.19373343
Fixemer, S., Ameli, C., Hammer, G. P., Salamanca, L., Huarte, O. U., Schwartz, C., Gérardy, J.-J., Mechawar, N., Skupin, A., Mittelbronn, M., et al. (2022) · Figshare · doi:10.6084/m9.figshare.19373334
Fixemer, S., Ameli, C., Hammer, G. P., Salamanca, L., Huarte, O. U., Schwartz, C., Gérardy, J.-J., Mechawar, N., Skupin, A., Mittelbronn, M., et al. (2022) · Figshare · doi:10.6084/m9.figshare.19373325
Fixemer, S., Ameli, C., Hammer, G. P., Salamanca, L., Huarte, O. U., Schwartz, C., Gérardy, J.-J., Mechawar, N., Skupin, A., Mittelbronn, M., et al. (2022) · Figshare · doi:10.6084/m9.figshare.19373337
Cellular scaling laws in the mammalian brain
Chen, F., & Macosko, E. Z. (2026) · Cell · doi:10.1016/j.cell.2026.08.044
Longitudinal MRI study of hippocampal subfields Morphometry in early Parkinson's disease
Wu, T., Ng, S. Y., Teo, T. W. J., Choi, X., Heng, D. L., Neo, S., Xu, Z., Tay, K. Y., Au, W. L., Tan, E. K., et al. (2026) · Parkinsonism & Related Disorders · doi:10.1016/j.parkreldis.2026.108259
Liou, J., Santini, T., Li, J., Gireud, M., Kautz, T. F., Parker‐Garza, J., Guerrero, J. C., Patel, V., Adeyemi, O. F., de Erausquin, G. A., et al. (2026) · Brain Communications · doi:10.1093/braincomms/fcag045
Tomadesso, C. (2018) · theses.fr (ABES) · doi:10.70675/7fad6418zff81z49c7z984dz63aa2e44d7fc
Multi-scale and multimodal imaging biomarkers for the early detection of Alzheimer’s disease
Hett, K. (2019) · theses.fr (ABES) · doi:10.70675/0d4a3118z347az4e13z812cz9ad7566ef5ba
Dautricourt, S. (2021) · theses.fr (ABES) · doi:10.70675/63472a25z31eaz4ebczaebdzd8d2e061b4b8
Suo, Y., Wang, L., Zhao, Y., Wen, Q., Feng, Q., Zhang, H., & Ding, Z. (2026) · Behavioural Brain Research · doi:10.1016/j.bbr.2026.116336
Li, J., Santini, T., Cl, C., de Almeida, B., Chu, C., Alkhateeb, S. K., Sajewski, A. N., Berardinelli, J., Jin, H., Campos, T., et al. (2026) · Research Square · doi:10.21203/rs.3.rs-9794116/v1
Hall, M. C., Picci, G., Rempe, M. P., John, J. A., Webert, L. K., McDonald, K. M., Okelberry, H. J., Johnson, H. J., Horne, L. K., Willett, M. P., et al. (2026) · GeroScience · doi:10.1007/s11357-026-02371-z
Soussi, C., Gonneaud, J., Cabé, N., Lanièpce, A., Marchant, N. L., Collette, F., de Florès, R., Foyard, E., Landeau, B., Mézenge, F., et al. (2026) · EBioMedicine · doi:10.1016/j.ebiom.2026.106376
Self-citationHeller, A. M., Ellis, D. G., Wilhelm, A. F., Nester, C. O., Paré, N., Sergeyev, N., Rabin, L. A., & Warren, D. E. (2026) · Alzheimer s & Dementia Diagnosis Assessment & Disease Monitoring · doi:10.1002/dad2.70429
The human hippocampus can pattern separate memories by meaning
Ilyés, A., Brosig, B., Mező, G., & Keresztes, A. (2026) · Proceedings of the National Academy of Sciences · doi:10.1073/pnas.2603114123
Watanabe, N., Ogawa, A., Osada, T., Adachi, Y., Shirokoshi, T., Kodama, H., Oshima, Y., Tanaka, S., Kaga, H., Tamura, Y., et al. (2026) · bioRxiv (Cold Spring Harbor Laboratory) · doi:10.64898/2026.08.04.742662
Metadata
- Authors
- La Joie, R., Perrotin, A., de La Sayette, V., Egret, S., Doeuvre, L., Belliard, S., Eustache, F., Desgranges, B., & Chételat, G.
- Affiliations
- Inserm (FR)
- Corresponding author
- Chételat, Gaël
- Venue
- NeuroImage: Clinical
- Publisher
- Elsevier BV
- Published
- 2013
- Volume
- 3
- Pages
- 155-162
- ISSN
- 2213-1582 (ISSN-L)
- PMC
- PMC3791274
- OpenAlex
- W2060796157
- Cited by
- 290
- References
- 57
- Citations by year
- 2026: 16 · 2025: 20 · 2024: 24 · 2023: 18 · 2022: 26 · 2021: 28 · 2020: 31 · 2019: 24 · 2018: 24 · 2017: 19 · 2016: 25 · 2015: 22 · 2014: 13
- FWCI
- 14.22
- Type
- journal article
- Language
- en
- Open access
- gold
- doi.org
- Licence
- Locations
- NeuroImage Clinical (publishedVersion, cc-by-nc-sa)
- Europe PMC (PubMed Central) (publishedVersion, cc-by-nc-sa)
- PubMed Central (publishedVersion, cc-by-nc-sa)
- PubMed (publishedVersion)
- HAL (submittedVersion, other-oa)
- Funders
- Fondation Plan Alzheimer (Alzheimer Plan 2008–2012)
- Programme Hospitalier de Recherche Clinique (PHRC National 2011)
- Agence Nationale de la Recherche (ANR LONGVIE 2007)
- Région Basse Normandie, and Institut National de la Santé et de la Recherche Médicale (INSERM)
- Inserm-Liliane Bettencourt School (MD–PhD Program)
- Topics
- Health Sciences › Medicine › Psychiatry and Mental health › Dementia and Cognitive Impairment Research
- Life Sciences › Neuroscience › Cellular and Molecular Neuroscience › Alzheimer's disease research and treatments
- Life Sciences › Neuroscience › Cognitive Neuroscience › Memory and Neural Mechanisms
- Keywords
- hippocampal subfields, hippocampal volumetry, CA1, subiculum, mild cognitive impairment, Alzheimer's disease, semantic dementia, hippocampal atrophy, amyloid-beta deposition, hemispheric lateralization
About these checks
Registry, retraction, Cites and statistics results are computed, not judged, with one exception: a printed reference that no index lists is read once by a model before it counts as a citation error. Claims are extracted by a model and kept only when their quote appears verbatim in the text; each cited source is then checked, with a model’s help, for whether it says what the claim relies on. Those verdicts can be wrong — read the claim’s quote and the cited source before relying on one.
A language model drew the claims from the paper on 2026-10-10, under version 3 of the claim definition (model deepseek-v4.1-flash, prompt extract-v3).
A second model labelled each claim on 2026-10-10 (model jev-1.13-20260917, definition revision gold-guideline-v0.2).
Statistics and arithmetic are recomputed, not judged.
Confidence bands are shown only for fields calibrated on our annotated test set. None is calibrated yet, so no band is shown.
What counts as a claim ›How we measure confidence ›How we check this ›
Are you an author, or do you see a problem with this page? Request a review
